A Novel Multimodal Radiomics Model for Predicting Prognosis of Resected Hepatocellular Carcinoma
←
→
Page content transcription
If your browser does not render page correctly, please read the page content below
ORIGINAL RESEARCH
                                                                                                                                                published: 07 March 2022
                                                                                                                                          doi: 10.3389/fonc.2022.745258

                                              A Novel Multimodal Radiomics Model
                                              for Predicting Prognosis of Resected
                                              Hepatocellular Carcinoma
                                              Ying He 1†, Bin Hu 2†, Chengzhan Zhu 3, Wenjian Xu 2, Yaqiong Ge 4, Xiwei Hao 1,
                                              Bingzi Dong 5, Xin Chen 1, Qian Dong 1,5,6* and Xianjun Zhou 1,5*
                                              1 Department of Pediatric Surgery, The Affiliated Hospital of Qingdao University, Qingdao, China, 2 Department of Radiology,

                                              The Affiliated Hospital of Qingdao University, Qingdao, China, 3 Department of Hepatobiliary and Pancreatic Surgery, The
                                              Affiliated Hospital of Qingdao University, Qingdao, China, 4 GE Healthcare, Shanghai, China, 5 Shandong Key Laboratory of
                                              Digital Medicine and Computer Assisted Surgery, The Affiliated Hospital of Qingdao University, Qingdao, China, 6 Shandong
                                              College Collaborative Innovation Center of Digital Medicine Clinical Treatment and Nutrition Health, Qingdao University,
                                              Qingdao, China
                           Edited by:
                   Alessandro Vitale,
    University Hospital of Padua, Italy       Objective: To explore a new model to predict the prognosis of liver cancer based on MRI
                     Reviewed by:             and CT imaging data.
                    Marco Massani,
         ULSS2 Marca Trevigiana, Italy
                                              Methods: A retrospective study of 103 patients with histologically proven hepatocellular
                        Tingfan Wu,           carcinoma (HCC) was conducted. Patients were randomly divided into training (n = 73)
               GE Healthcare, China           and validation (n = 30) groups. A total of 1,217 radiomics features were extracted from
                 *Correspondence:             regions of interest on CT and MR images of each patient. Univariate Cox regression,
                       Xianjun Zhou
             18661809968@163.com              Spearman’s correlation analysis, Pearson’s correlation analysis, and least absolute
                         Qian Dong            shrinkage and selection operator Cox analysis were used for feature selection in the
             18661801885@163.com
                                              training set, multivariate Cox proportional risk models were established to predict disease-
     †
      These authors have contributed
                 equally to this work
                                              free survival (DFS) and overall survival (OS), and the models were validated using validation
                                              cohort data. Multimodal radiomics scores, integrating CT and MRI data, were applied,
                    Specialty section:        together with clinical risk factors, to construct nomograms for individualized survival
          This article was submitted to
                                              assessment, and calibration curves were used to evaluate model consistency. Harrell’s
                     Surgical Oncology,
                a section of the journal      concordance index (C-index) values were calculated to evaluate the prediction
                  Frontiers in Oncology       performance of the models.
             Received: 21 July 2021
         Accepted: 04 February 2022
                                              Results: The radiomics score established using CT and MR data was an independent
          Published: 07 March 2022            predictor of prognosis (DFS and OS) in patients with HCC (p < 0.05). Prediction models
                             Citation:        illustrated by nomograms for predicting prognosis in liver cancer were established.
He Y, Hu B, Zhu C, Xu W, Ge Y, Hao X,
                                              Integrated CT and MRI and clinical multimodal data had the best predictive
Dong B, Chen X, Dong Q and Zhou X
(2022) A Novel Multimodal Radiomics           performance in the training and validation cohorts for both DFS [(C-index (95% CI):
    Model for Predicting Prognosis of         0.858 (0.811–0.905) and 0.704 (0.563–0.845), respectively)] and OS [C-index (95% CI):
 Resected Hepatocellular Carcinoma.
             Front. Oncol. 12:745258.
                                              0.893 (0.846–0.940) and 0.738 (0.575–0.901), respectively]. The calibration curve
      doi: 10.3389/fonc.2022.745258           showed that the multimodal radiomics model provides greater clinical benefits.

Frontiers in Oncology | www.frontiersin.org                                          1                                         March 2022 | Volume 12 | Article 745258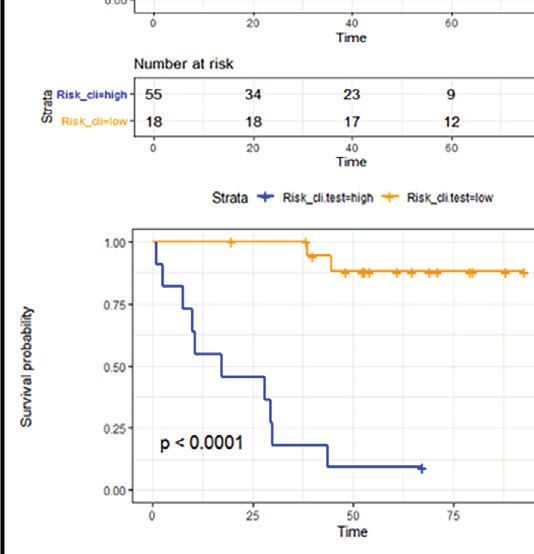
He et al.                                                                                                         Radiomics in Hepatocellular Carcinoma Survival

                                              Conclusion: Multimodal (MRI/CT) radiomics models can serve as effective visual tools
                                              for predicting prognosis in patients with liver cancer. This approach has great potential
                                              to improve treatment decisions when applied for preoperative prediction in patients
                                              with HCC.
                                              Keywords: liver cancer, multimodal imaging, computed tomography, MRI, radiomics, nomogram

INTRODUCTION                                                                           HCC (16–18). Recent HCC management guidelines recognize an
                                                                                       increasing role for gadoxetic acid-enhanced MRI in early
Hepatocellular carcinoma (HCC) is the most common primary                              diagnosis and monitoring post-resection (19). CT or MRI can
liver tumor, accounting for 75%–85% of liver cancers (1). HCC is                       all confirm the diagnosis if a nodule larger than 1-cm diameter is
the second most common cause of cancer death worldwide and                             found with typical vascular features of HCC (hypervascularity in
has high morbidity and mortality rates (2). Surgical resection and                     the arterial phase with washout in the portal venous or delayed
local ablation remain the most commonly used radical treatment                         phase) (20). Further, both CT and MR functional scans can be
methods for HCC; however, tumors recur in 70% of cases after                           useful as supplements to conventional plain scan and dynamic
hepatectomy and 25% of cases after liver transplantation, and the                      enhancement to improve the accuracy of follow-up evaluation of
5-year overall survival (OS) rate is only approximately 25%–55%                        liver cancer (21). In recent years, several qualitative MRI and CT
(3–5). Hence, patients with HCC have a poor prognosis after                            imaging features have been reported. Preliminary evidence
surgery, and the high disease recurrence rate represents a great                       suggests that radiomics features have the potential to predict
challenge to successful treatment (3, 6). Therefore, the                               OS and tumor recurrence in patients with HCC, for example, by
identification of reliable predictors of early recurrence is                            assessing peritumor parenchymal enhancement, satellite
critical for patient risk stratification, support for treatment                         nodules, and non-smooth tumor margins, which are non-
decisions, and improvement of long-term survival.                                      invasive predictors of early HCC recurrence (22–24).
    At present, relevant tumor factors, such as lesion                                     Multimodal fusion technology can be divided into pixel level,
diameter, cirrhosis, multifocality, poorly differentiated tumor,                       feature level, and decision level, which are used to fuse abstract
and microvascular invasion (MVI), are recognized as risk                               features and decision results in original data (13–15). To date,
factors for early disease recurrence (7–10); however, most                             radiomics has been successfully applied in the study of
of these features can only be evaluated by postoperative                               nasopharyngeal carcinoma, non-small cell lung cancer, and
histopathological examination, which is invasive, and the                              rectal cancer (25–27), demonstrating the great potential for the
results are prone to a missed diagnosis. In oncology, the                              development of this approach; however, to our knowledge, the
application of radiomics, which involves the transformation of                         use of contrast analysis of CT-enhanced sequence and MR-
traditional medical images into high-dimensional, quantitative,                        enhanced sequence data to assess patient prognosis remains
and exploitable imaging data, enables in-depth characterization                        rare. In this study, we combined these two novel imaging
of tumor phenotypes and has the potential to provide                                   techniques and explored the performance of multimodal
information on intra-tumor heterogeneity and predict                                   radiomics models derived from MR and CT image data for
posttreatment survival (11, 12). Multimodal machine learning                           prognostic evaluation following HCC resection.
is a method to process and interpret multimodal information
through machine learning. Multimodal fusion is used to fuse
multimodal information and perform targeted prediction
classification or regression problems (13–15). Medical imaging                          MATERIALS AND METHODS
can include data in different forms, such as CT, MRI, PET,
                                                                                       Patients
ultrasound, and X-rays. In different guidelines, either CT or MRI
                                                                                       This study was approved by the Ethics Committee of the
is proposed as the best imaging modality for the diagnosis of
                                                                                       Affiliated Hospital of Qingdao University. Due to its
                                                                                       retrospective nature, the need for patient written informed
Abbreviations: HCC, hepatocellular carcinoma; DFS, disease-free survival; OS,          consent was waived. From February 2014 to December 2020,
overall survival; C-index, Harrell’s concordance index; TACE, transarterial            we collected information from 306 patients with liver cancer, and
chemoembolization; ALT, alanine aminotransferase; AST, aspartate                       135 patients with primary HCC were recruited, based on the
aminotransferase; TBIL, total bilirubin; ALB, albumin; AFP, alpha-fetoprotein;
ROI, region of interest; ICCs, the intra-class coefficient and the inter-class
                                                                                       following inclusion criteria: 1) pathologically confirmed liver
correlation coefficient; GLCM, gray-level co-occurrence features matrix-based           cancer recorded in the medical records at our hospital and 2) CT
features; GLRLM, gray-level run-length matrix-based features; GLSZM, gray-level        and MRI examinations performed within the previous 2 weeks
size zone matrix-based features; GLDM, gray-level dependence matrix-based              before hepatectomy. The exclusion criteria were as follows: 1)
features; Log, Laplace wavelet; LASSO, least absolute shrinkage and selection          other preoperative treatments [transarterial chemoembolization
operator; KM, Kaplan–Meier; Radscore, radiomics score; MVI, microvascular
invasion; BMI, body mass index; PV_TT, portal vein tumor thrombosis; PLT,
                                                                                       (TACE)], targeted drugs, and radiofrequency ablation), except
platelet count; HBsAg, hepatitis B surface antigen status; PT, prothrombin time;       hepatectomy (n = 11); 2) incomplete clinicopathological report
NEUT, neutrophil count.                                                                (n = 10); 3) CT image and MR image quality was poor, and the

Frontiers in Oncology | www.frontiersin.org                                        2                                  March 2022 | Volume 12 | Article 745258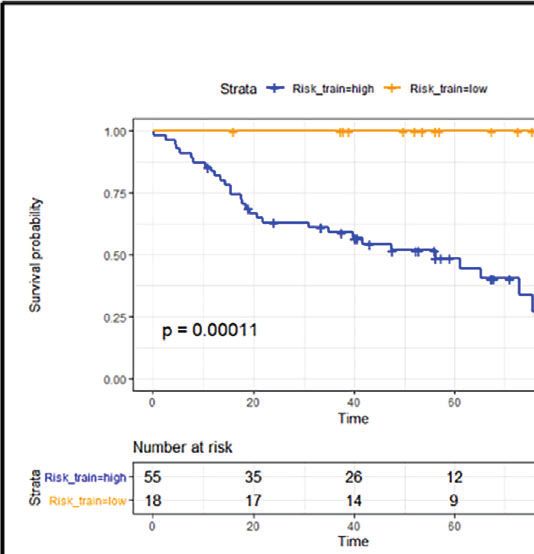
He et al.                                                                                             Radiomics in Hepatocellular Carcinoma Survival

lesion could not be recognized or the lesion image was less than           Tumor Segmentation
three layers (n = 3); 4) lost to follow-up (n = 4); and 5) error           The tumor region of interest (ROI) was manually delineated on
occurred in the feature extraction process (n = 4). The final study         multi-phase CT and MR images by a radiologist with more than
population included 103 patients. The entire cohort was                    10 years of experience (Reader 1) using ITK-SNAP (version
randomly divided into a training cohort (n = 73) and a                     3.6.0; http://www.itksnap.org) to segment each tumor CT stage
validation cohort (n = 30) (ratio, 7:3). Training queues were              and MR stage. A two-dimensional ROI of the largest section of
used to build single-modal and multimodal radiomics models,                the tumor was selected, outlined, and saved as an NII file. Two
which were evaluated using validation queues.                              weeks later, Reader 1 randomly selected 50 HCC patients and
                                                                           delineated the ROI again to evaluate the intra-class correlation
Clinical Endpoints and Follow-Up                                           coefficient of ROI. Additionally, another radiologist (Reader 2)
The endpoints of this study were disease-free survival (DFS) and           independently performed ROI mapping for the randomly
OS. DFS was measured from the date of surgery until disease                selected 50 HCC patients to evaluate the inter-class
progression, death from any cause, or the last visit in follow-up          correlation coefficient.
(censored), and nomograms were also built based on the DFS.
Disease progression, including local recurrence distant                    Image Preprocessing and
metastasis, was confirmed by clinical examination and imaging               Feature Extraction
methods such as abdominopelvic CT or MRI or was biopsy-                    At the beginning of extraction, pre-processing was necessary to
proven. OS was defined as the time to death from any cause. All             improve discrimination between texture features. To eliminate
patients were followed up after surgery. Serum alanine                     the batch effect of different equipment, all the data were
transaminase (ALT), aspartate transaminase (AST), total                    normalized through z-score standardization to a standard
bilirubin (TBIL), albumin (ALB), and alpha-fetoprotein (AFP)               intensity range with a mean value of 0 and SD of 1, and the
levels were obtained. Liver ultrasound examination was                     image slices were resampled to voxel size = 1 * 1 * 1 cm3. With
performed monthly within the 3 months after surgery and                    the use of IBSI compliant AK software (Analysis Kit Software,
once every 3 months thereafter. CT examination of the lungs                version 3.3.0, GE Healthcare), 1,217 radiomics features were
and enhanced CT or MRI of the liver were performed every 3                 extracted from CT and MR images, including first-order
months during the first 2 years and once every 6 months                     statistical features, morphological features, gray-level co-
thereafter. The minimum follow-up period was 3 days after                  occurrence features, matrix-based features (GLCM), gray-level
surgery, while the maximum follow-up time was 92.8 months.                 run-length matrix-based features (GLRLM), gray-level size zone
                                                                           matrix-based features (GLSZM), gray-level dependence matrix-
Image Acquisition                                                          based features (GLDM), and (Log) Laplace wavelet changes.
CT Scanning Methods and Parameters                                         Furthermore, intra-class and inter-class correlation coefficients
Three-stage enhanced scans of the upper abdomen were                       (ICCs) were used to evaluate the intra-observer and inter-
obtained using a German CT (SOMATOM Definition Flash,                       observer reproducibility of feature extraction. The intra-class
Siemens, Munich, Germany) and an American Discovery CT                     correlation coefficient was calculated by comparing the ROI of
(GE Healthcare, Chicago, IL, USA). Scans ranged from the top of            Reader 1 twice. The inter-class correlation coefficient between
the liver to the lower edges of both kidneys. Scanning parameters          the groups was evaluated by comparing the ROI of Reader 1 with
were as follows: voltage, 120 kV; current, 200–350 mA; scanning            that of Reader 2. When ICCs exceeded 0.75 both within and
layer thickness, 5 mm; layer spacing, 5 mm; and matrix, 512 ×              between observers, this feature was considered to have a good
512. For contrast-enhanced scanning, a double-barreled high-               consistency. Finally, the ICC range for CT (Balance, Venous, and
pressure syringe was used to inject iohexol, containing 350 mg/            Artery) was 0.175–1, and 917 features with ICC > 0.75 were
ml of iodine, via the peripheral vein (flow rate, 3.0 ml/s; dose, 1.5       retained for each phase. The ICC range for MR (Balance,
ml/kg). The delay times for the arterial, venous, and equilibrium          Venous, and Artery) was 0.256–1, and 946 features with ICC >
phases were 30, 60, and 120 s, respectively.                               0.75 were retained.

MRI Scanning Methods and Parameters                                        Feature Selection and Model Construction
MRI scanning was conducted using a 3.0 T Signa HDXT MR                     Features with ICC values > 0.75 both within and between groups
superconducting apparatus and an 8-channel body-phase front                were retained for further analysis. In the training set, features
coil. Rapid volume acquisition Liver Acquisition with Volume               with p < 0.05 in univariate Cox regression analysis were retained,
Acceleration (LAVA) imaging of the liver was conducted using               and Spearman’s correlation analysis and Pearson’s correlation
the following parameters: repetition time (TR), 4.2 ms; echo time          analysis were applied to eliminate characteristics that were highly
(TE), 2.0 ms; layer thickness, 4.8–5.4 mm; layer spacing, 1.4–2.7          correlated (selected coefficient threshold |r| = 0.8). The least
mm; field, 42.0 × 33.6 cm; and matrix, 320 × 192. The contrast              absolute shrinkage and selection operator (LASSO) Cox
agent, gadolinium diethylenetriamine penta-acetic acid, was used           regression with 10-fold cross-validation was used for further
for enhanced scanning (dose, 0.2 mmol/kg; injection flow rate, 2.0          feature screening. Then, features with non-zero coefficients
ml/s). The delay times of the arterial, portal, and equilibrium            selected by LASSO analysis were linearly weighted. Next,
phases were 20–23, 60, and 180 s, respectively.                            radiomics scores (Radscores) were calculated for each patient.

Frontiers in Oncology | www.frontiersin.org                            3                                  March 2022 | Volume 12 | Article 745258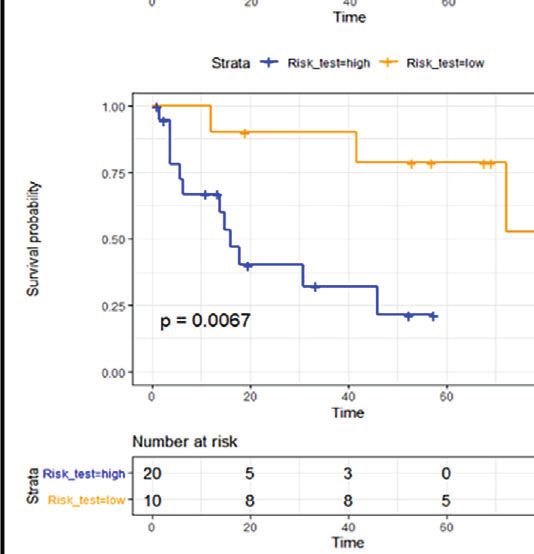
He et al.                                                                                               Radiomics in Hepatocellular Carcinoma Survival

The Radscore was the result of the Cox regression radiomics                 group (n = 103) were 25.9 (0.1–88.1) months and 43.7 (0.1–92.8)
model. It was the linear combination weighted by the                        months, respectively.
corresponding LASSO coefficients of each feature selected of
each patient, and patients were then divided into high-risk and             Radiomics Signature Construction
low-risk groups, according to their best truncation value in each           Features retained after each feature dimension reduction are listed
model and the labeled high-risk group (riskscore = 1) and the               in Supplementary Table S1. Finally, for prediction of DFS, 7, 12,
low-risk group (riskscore = 0). Kaplan–Meier (KM) analysis was              and 17 features were selected from CT, MRI, and their combined
used to plot DFS and OS curves, and the log-rank test was used to           features, respectively, and used to build models. For prediction of
evaluate the differences between high-risk and low-risk groups.             OS, 8, 16, and 17 features were selected to establish the model from
The same threshold was then applied to the validation queue. C-             CT, MRI, and their combined features, respectively. The details of
index values were used to evaluate the performance of the model.            selected features of DFS and OS are included in Supplementary
                                                                            Figure S1 and Table S2. The calculated CT_radscore,
Nomogram Construction                                                       MRI_radscore, and Combined_radscore were based on
First, univariate Cox analysis was used to analyze risk factors and         selected features.
screen for features with p < 0.05. Clinical factors with p < 0.05 and           We performed the univariate Cox analysis to determine the
Radscore for CT and MRI data combined (Combined_radscore)                   role of clinical features of patients on DFS in HCC (Table 2).
were included in the multivariate Cox stepwise regression model, to         Three clinical characteristics, namely, tumor diameter, liver
investigate independent predictors of survival in HCC patients.             capsule invasion, and MVI were identified by univariate
Clinical factors and Combined_radscore (with p < 0.05) in the               analysis (p < 0.05). Clinical features with p < 0.05 were
univariate Cox analysis were enrolled to establish a nomogram to            included in backward stepwise multivariate regression analysis.
predict patients’ 2-year, 4-year, and 5-year survival rates. C-index        The results show that MVI was an independent predictor of
values were used to evaluate the performance of the model, and              HCC in the multivariable analysis (p < 0.05). We performed the
calibration curves were generated and discrimination ability was            univariate Cox analysis to determine the role of clinical
quantified to compare predicted and actual survival rates.                   characteristics on the OS of patients in HCC (Table 3). Six
                                                                            clinical characteristics, namely, body mass index (BMI), tumor
Statistical Analysis                                                        diameter, MVI, portal vein tumor thrombosis (PV_TT), platelet
All statistical analyses were performed using R3.5.1 (https://www.          count (PLT), and Bleeding_volume were identified by univariate
r-project.org/). A t-test or Mann–Whitney U test was used to                analysis (p < 0.05). Clinical characteristics with p < 0.05 were
evaluate differences in continuous variables, and the chi-square or         included in backward stepwise multivariate regression analysis.
Fisher’s exact test to assess differences in categorical variables.         The results show that BMI, MVI, and Bleeding_volume were
Continuous numerical variables are represented by the median                independent predictors of HCC in the multivariable analysis (p <
(25th percentile, 75th percentile), and categorical variables are           0.05). The clinical models were built based on clinical risk
represented by percentages. Shapiro’s test function in the R                features, and the Clinical_score of each model was calculated.
package was used to test for normality. Spearman’s correlation                  Combined_radscore and clinical factors were included in
analysis and Pearson’s correlation analysis were used to eliminate          univariate Cox regression for analyzing DFS, and factors with
redundant features. Pearson’s correlation analysis was used for the         p < 0.05 were included in backward stepwise multivariate Cox
features that conform to the normal distribution, and Spearman’s            regression analysis (Table 4). The results show that Radscore and
correlation analysis was used for the features that do not conform          MVI were independent predictors of HCC in the multivariable
to normal distribution. The surv_cutpoint function in the R                 analysis (p < 0.05). Combined_radscore and clinical factors were
package was used to calculate optimal truncation values. The                included in univariate Cox regression for analyzing OS, and
KM method and log-rank test were used to estimate DFS and                   factors with p < 0.05 were included in backward stepwise
OS. Calibration curves were used to evaluate the degree of                  multivariate Cox regression analysis (Table 5). The results
alignment of nomograms. Two-sided p-values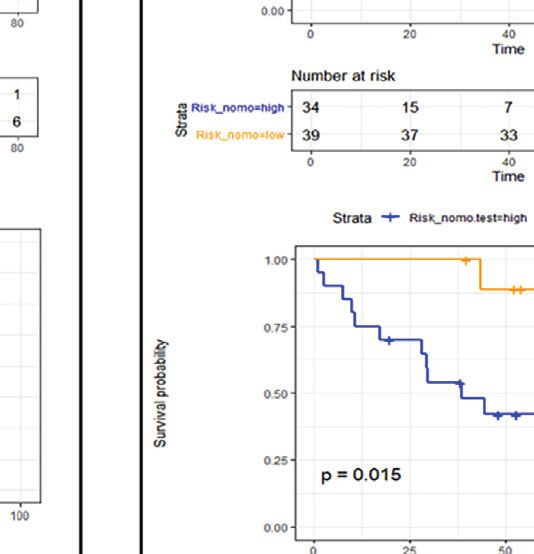
He et al.                                                                                                                       Radiomics in Hepatocellular Carcinoma Survival

TABLE 1 | Demographic and clinicopathological characteristics of patients with liver cancer.

Variable                                                                        Training cohort (N = 73)                     Validation cohort (N = 30)                        p

Age (years),                                       >60                                  32 (0.44)                                      12 (0.40)                            0.721
                                                   ≤60                                  41 (0.56)                                      18 (0.60)
Gender                                            Male                                  60 (0.82)                                      7 (0.23)                             0.520
                                                Female                                  13 (0.18)                                      23 (0.77)
Alcohol abuse (%)                               Present                                 13 (0.18)                                      6 (0.20)                             0.794
                                                Absent                                  60 (0.82)                                      24 (0.80)
AFP (ng/ml, %)                                     ≤20                                  32 (0.44)                                      11 (0.37)                            0.503
                                                   >20                                  41 (0.56)                                      19 (0.63)
HBV (%)                                         Present                                 63 (0.86)                                      23 (0.77)                            0.231
                                                Absent                                  10 (0.14)                                      7 (0.23)
HBsAg (%)                                       Positive                                62 (0.85)                                      23 (0.77)                            0.316
                                               Negative                                 11 (0.15)                                      7 (0.23)
Pos_operation_TACE (%)                          Present                                 29 (0.40)                                      10 (0.33)                            0.543
                                                Absent                                  44 (0.60)                                      20 (0.67)
Tumor diameter (cm, %)                           ≤5 cm                                  52 (0.71)                                      17 (0.57)                            0.153
                                                 >5 cm                                  21 (0.29)                                      13 (0.43)
Tumor number (%)                                    ≥2                                   8 (0.11)                                      3 (0.10)                             0.835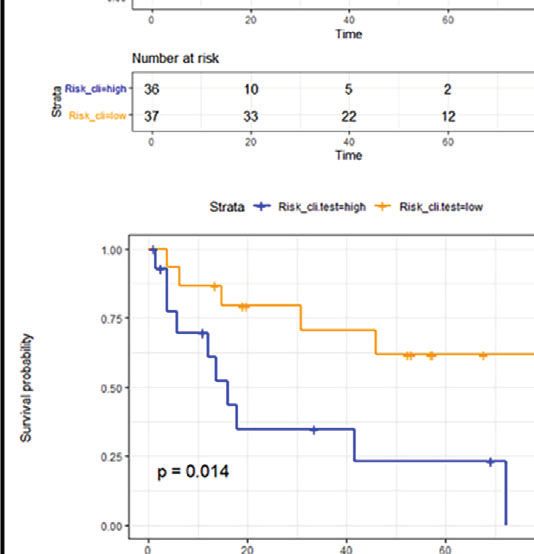
He et al.                                                                                                                            Radiomics in Hepatocellular Carcinoma Survival

TABLE 2 | Univariate and multivariate analyses of training cohort to identify patient clinical features with prognostic value for DFS.

Variable                                                            Univariate analysis                                                            Multivariate analysis

                                                      HR (95% CI)                                 p-Value                             HR (95% CI)                               p-Value

Age                                                0.994 (0.961–1.028)                              0.708
Gender                                             1.712 (0.723–4.055)                              0.222
BMI                                                1.014 (0.992–1.036)                              0.229
Alcohol                                            1.088 (0.506–2.342)                              0.829
Liver cirrhosis                                    1.436 (0.607–3.399)                              0.410
Histopathological grade                            1.361 (0.842–2.199)                              0.209
Tumor diameter                                      1.128 (1.02–1.247)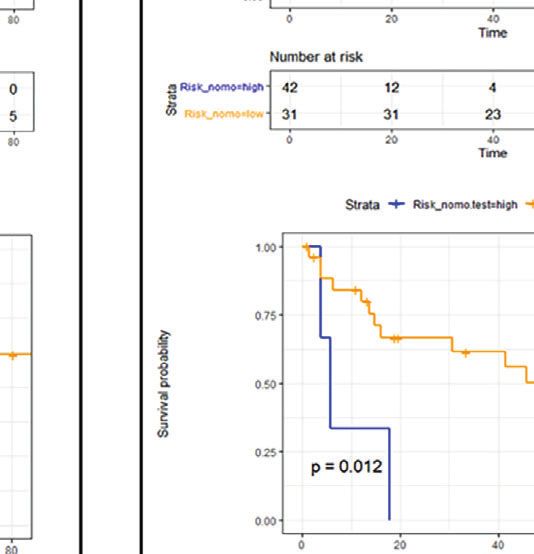
He et al.                                                                                                                            Radiomics in Hepatocellular Carcinoma Survival

TABLE 3 | Univariate and multivariate analyses of training cohort to identify patient clinical features with prognostic value for OS.

Variable                                                          Univariate analysis                                                            Multivariate analysis

                                                     HR (95% CI)                                 p-Value                             HR (95% CI)                                p-Value

Age                                               1.018 (0.98–1.057)                              0.351
Gender                                            0.484 (0.215–1.092)                             0.081
BMI                                               0.881 (0.798–0.972)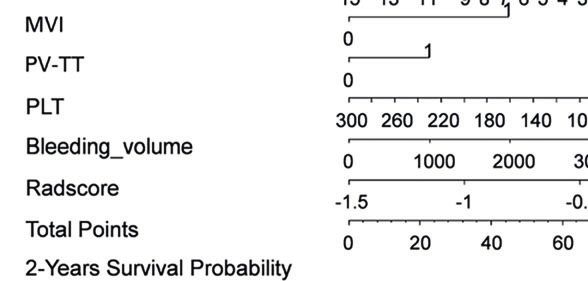
He et al. Radiomics in Hepatocellular Carcinoma Survival
A B C
D E
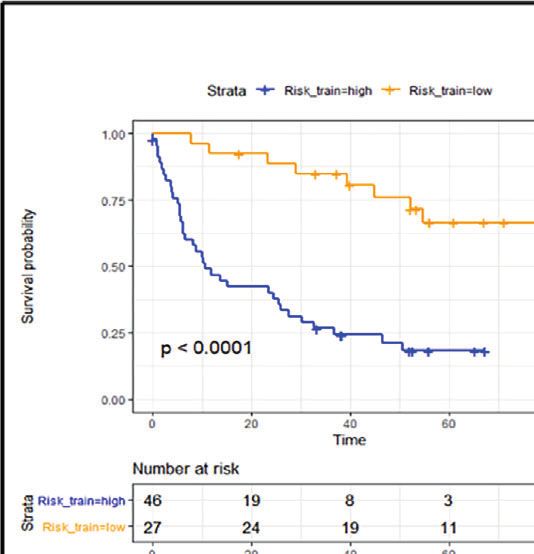
FIGURE 1 | Patient DFS KM curves for each model. (A) CT_DFS; (B) MRI_DFS; (C) CT+MRI_DFS; (D) Clinical_DFS; (E) CT+MRI+Clinical_DFS. p-Values were
calculated using the log-rank test. Training cohort curves are shown on the top and validation cohorts on the bottom in each panel. DFS, disease-free survival; KM,
Kaplan–Meier.
Frontiers in Oncology | www.frontiersin.org 8 March 2022 | Volume 12 | Article 745258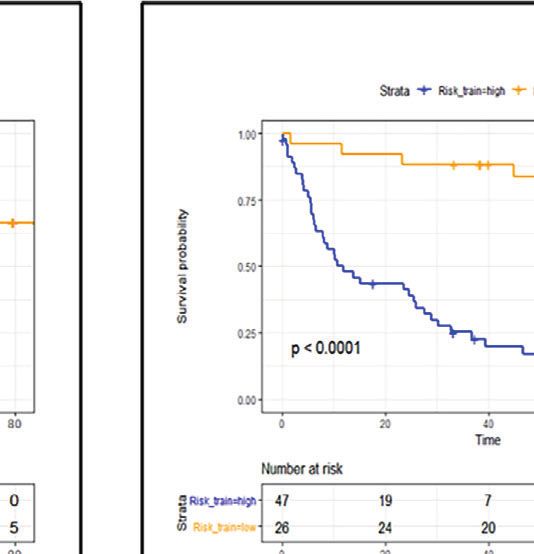
He et al.                                                                                                             Radiomics in Hepatocellular Carcinoma Survival

        A                                                   B                                                   C

            D                                               E

 FIGURE 2 | Patient OS KM curves for each model: (A) CT_OS; (B) MRI_OS; (C) CT+MRI_OS; (D) Clinical_OS; (E) CT+MRI+Clinical_OS. p-Values were calculated
 using the log-rank test. Training cohort curves are shown on the top and validation cohorts on the bottom in each panel. OS, overall survival; KM, Kaplan–Meier.

Frontiers in Oncology | www.frontiersin.org                                      9                                        March 2022 | Volume 12 | Article 745258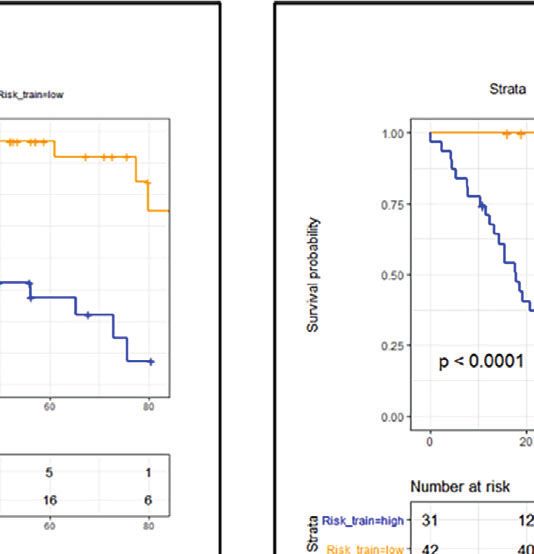
He et al.                                                                                                              Radiomics in Hepatocellular Carcinoma Survival

                               A

                                   B

                               C                                                       D

 FIGURE 3 | Development of nomograms and calibration curves for DFS and OS in training cohorts. (A) Prognostic nomogram for DFS. (B) The prognostic
 nomogram for OS. (C) Calibration curves for DFS in the training cohort. (D) Calibration curves for OS in the training cohort. To determine the number of factors
 associated with the probability of survival, a straight line was drawn to the relevant point on the axis for each patient, and the process was repeated for each
 variable. Scores for each risk factor were then summarized, with the final sum marked on the overall point axis. DFS and OS estimated using the nomogram are
 plotted on the x-axis. Observed DFS or OS are plotted on the y-axis, and the estimated results are compared with the actual results. The consistency of estimated
 and observed calibrations for 2-year, 4-year, and 5-year survival results is shown for each model. DFS, disease-free survival; OS, overall survival.

TABLE 6 | The performance of each model in the training and validation cohorts.

                                           Model                                  Training cohort                                         Validation cohort

Disease-free survival                                                  C-index                      95% CI                      C-index                     95% CI
                                       CT                               0.742                    0.668–0.816                     0.614                   0.442–0.786
                                       MRI                              0.772                    0.705–0.839                     0.587                   0.412–0.763
                                       CT+MRI                           0.826                    0.767–0.885                     0.653                   0.490–0.816
                                       Clinical                         0.717                    0.648–0.786                     0.657                   0.504–0.809
                                       CT+MRI+Clinical                  0.858                    0.811–0.905                     0.704                   0.563–0.845
Overall survival                       CT                               0.740                    0.650–0.830                     0.624                   0.450–0.789
                                       MRI                              0.833                    0.768–0.898                     0.601                   0.401–0.801
                                       CT+MRI                           0.865                    0.810–0.920                     0.653                   0.471–0.835
                                       Clinical                         0.802                    0.714–0.890                     0.705                   0.597–0.803
                                       CT+MRI+Clinical                  0.893                    0.846–0.940                     0.738                   0.575–0.901

Frontiers in Oncology | www.frontiersin.org                                       10                                       March 2022 | Volume 12 | Article 745258
He et al. Radiomics in Hepatocellular Carcinoma Survival
reflect information related to tumor heterogeneity, which are not LASSO logistic regression model, and constructed a Radscore
visible to the human eye. Hence, radiomics can provide a non- model. The results showed that inclusion of CT-based radiomics
invasive, low-cost, and reproducible means to capture tumor features with routine clinical variables significantly predicted
phenotypes that may be associated with intra-tumor early recurrence (≤1 year) postoperatively and that the diagnostic
heterogeneity (30). To date, radiomics has been used in performance of the model combining radiomics and clinical
research to explore liver tumors, including numerous studies factors was superior to that of the model with clinical features
applied to the diagnosis, prognosis, pathological grading, and alone for estimating early recurrence. It seems to be obvious that
MVI of liver cancer (31–34). Many previous studies have assessing tumorous disease with single modal radiomics
demonstrated the role of radiomics in survival assessment for information will not be comprehensive. However, the
patients with different types of cancer, including non-small cell development of methods and strategies for the integration of
lung, breast, and thyroid cancers (35–37). information of different dimensions is still in its early stages, and
We developed a new multimodal radiomics model to combining prediction models, as performed in the current study,
compare the value of enhanced CT and MRI sequence data for might increase their precision and could be extended to other
prognosis prediction in patients with HCC and to compare this diagnostic indicators. Further research following this scheme
with the predictive performance of clinicopathological factors. In is warranted.
this study, we extracted 1,217 features from CT and MR images This study has several limitations. First, our study was
and finally identified non-zero coefficient features associated conducted in a single institution. Although all CT and MR
with DFS and prognostic features associated with OS by images were obtained using a uniform scanner and
LASSO regression analysis. Specific feature dimension standardized imaging acquisition sequences, to reduce bias and
reduction and features screening processes are also shown in variance in our results and improve the robustness of the model,
the Supplementary Materials. Radscore values were calculated further confirmation using patient data from other institutions is
using these features. KM survival analysis methods and log-rank needed. Second, the use of manually drawn two-dimensional
tests were used to evaluate their prognostic value. ROI is time-consuming and inconvenient for clinical application;
In our study, the results of multivariate analyses showed that hence, the feasibility of automatic segmentation or semi-
MVI, Bleeding_volume, and PLT were independent predictors of segmentation in radiomics analysis will be the focus of future
the prognosis of HCC patients, which was consistent with the research. Third, the number of patients in this study is not large
results of previous studies (7–10). The CT+MRI+Clinical model because not all HCC patients need to undergo CT and MR in
was superior to that of a model comprising clinical features clinical practice. In addition, the cost of conducting CT and MR
alone, CT alone, MRI alone, or CT+MRI combined model, at the same time is relatively expensive, so there are some
indicating that the multimodal radiomics model approach may obstacles to implementation. Finally, our single-center study
have a greater value in predicting DFS and OS of resected HCC. primarily included patients who had undergone CT and MR,
The multimodal model can provide more abundant information. with a small sample size. We will work with other hospitals to
In addition, for all KM curves of predicting DFS and OS, the explore the robustness of similar multimodal models in
low-risk group had significantly higher survival times than the the future.
high-risk group (p < 0.05), indicating that Radscore was an In conclusion, our results suggest that Radscore is an
independent predictor of HCC, and this finding was confirmed independent prognostic factor in patients with HCC.
in the multivariate Cox proportional risk model (p < 0.05) in Multimodal imaging profiles have great potential to improve
both DFS and OS. Thus, Radscore improves traditional individualized assessment of likely prognosis after surgery and
prognostic ability and represents a potentially effective and may guide the individualized care of patients with HCC.
promising tool for evaluating the prognosis of patients with
HCC. This is consistent with the study by Zhao et al. (38). In a
prior study, Zhang et al. (28) established single and multimodal
logic models for predicting LVI, with excellent predictive power DATA AVAILABILITY STATEMENT
in training (area under the curve (AUC), 0.884; 95% CI, 0.803–
0.964) and validation (AUC, 0.876; 95% CI, 0.721–1.000). Their The raw data supporting the conclusions of this article will be
results are similar to our study, but our model also included made available by the authors, without undue reservation.
clinical factors. Univariate and multivariate Cox analyses were
used to select clinical factors into the model to analyze the
prognosis, which was more convincing and scientific by
comparing the prediction performance of various modes, and ETHICS STATEMENT
it was shown in nomograms. Our Radscore-based nomograms
yielded a better discriminative ability than these traditional The studies involving human participants were reviewed and
methods for predicting prognosis in HCC patients. approved by the Affiliated Hospital of Qingdao University.
Zhou et al. (24, 38) extracted radiomics features from arterial Written informed consent for participation was not required
and portal phase CT images of 215 HCC patients undergoing for this study in accordance with the national legislation and the
partial hepatectomy, screened the imaging features through a institutional requirements.
Frontiers in Oncology | www.frontiersin.org 11 March 2022 | Volume 12 | Article 745258He et al. Radiomics in Hepatocellular Carcinoma Survival
AUTHOR CONTRIBUTIONS FUNDING
YH, CZ, QD, BH, and XZ contributed to the conception and This work wassupported byClinicalMedicine + X (grant number 3756).
design. YH, BH, WX, and XC organized the database. YG, XH,
and BD managed the patient and provided technical support. YH
wrote the first draft of the manuscript. YH and YG performed SUPPLEMENTARY MATERIAL
the statistical analysis, CZ, QD, and XZ reviewed and revised the
manuscript. All authors listed have made a substantial, direct, The Supplementary Material for this article can be found online
and intellectual contribution to the work and approved it at: https://www.frontiersin.org/articles/10.3389/fonc.2022.
for publication. 745258/full#supplementary-material
15. Ramachandram D, Taylor GW. Deep Multimodal Learning: A Survey on
REFERENCES Recent Advances and Trends. IEEE Signal Process Mag (2017) 34(6):96–108.
1. Bray F, Ferlay J, Soerjomataram I, Siegel RL, Torre LA, Jemal A. Global doi: 10.1109/MSP.2017.2738401
Cancer Statistics 2018: GLOBOCAN Estimates of Incidence and Mortality 16. European Association for the Study of the Liver. Electronic address and L.
Worldwide for 36 Cancers in 185 Countries. CA Cancer J Clin (2018) 68:394– European Association for the Study of the. EASL Clinical Practice Guidelines:
424. doi: 10.3322/caac.21492 Management of Hepatocellular Carcinoma. J Hepatol (2018) 69:182–236.
2. C. Global Burden of Disease Liver Cancer, Akinyemiju T, Abera S, Ahmed M, doi: 10.1016/j.jhep.2018.03.019
Alam N, Alemayohu MA, et al. The Burden of Primary Liver Cancer and 17. Marrero JA, Kulik LM, Sirlin CB, Zhu AX, Finn RS, Abecassis MM, et al.
Underlying Etiologies From 1990 to 2015 at the Global, Regional, and Diagnosis, Staging, and Management of Hepatocellular Carcinoma: 2018
National Level: Results From the Global Burden of Disease Study 2015. Practice Guidance by the American Association for the Study of Liver
JAMA Oncol (2017) 3:1683–91. doi: 10.1001/jamaoncol.2017.3055 Diseases. Hepatology (2018) 68:723–50. doi: 10.1002/hep.29913
3. Poon RT, Fan ST, Lo CM, Liu CL, Wong J. Long-Term Survival and Pattern of 18. Omata M, Cheng AL, Kokudo N, Kudo M, Lee JM, Jia J, et al. Asia-Pacific
Recurrence After Resection of Small Hepatocellular Carcinoma in Patients Clinical Practice Guidelines on the Management of Hepatocellular
With Preserved Liver Function: Implications for a Strategy of Salvage Carcinoma: A 2017 Update. Hepatol Int (2017) 11:317–70. doi: 10.1007/
Transplantation. Ann Surg (2002) 235(3):373–82. doi: 10.1097/00000658- s12072-017-9799-9
200203000-00009 19. Zech CJ, Ba-Ssalamah A, Berg T, Chandarana H, Chau GY, Grazioli L, et al.
4. Shah SA, Cleary SP, Wei AC, Yang I, Taylor BR, Hemming AW, et al. Recurrence Consensus Report From the 8th International Forum for Liver Magnetic
After Liver Resection for Hepatocellular Carcinoma: Risk Factors, Treatment, Resonance Imaging. Eur Radiol (2020) 30(1):370–82. doi: 10.1007/s00330-
and Outcomes. Surg (2007) 141(3):330–9. doi: 10.1016/j.surg.2006.06.028 019-06369-4
5. Lacaze L, Scotte M. Surgical Treatment of Intra Hepatic Recurrence of 20. Vogel A, Cervantes A, Chau I, Daniele B, Llovet JM, Meyer T, et al. ESMO
Hepatocellular Carcinoma. World J Hepatol (2015) 7(13):1755–60. Guidelines Committee. Hepatocellular Carcinoma: ESMO Clinical Practice
doi: 10.4254/wjh.v7.i13.1755 Guidelines for Diagnosis, Treatment and Follow-Up. Ann Oncol (2018) 29
6. Lau WY, Lai EC. Hepatocellular Carcinoma: Current Management and (Suppl 4):iv238–55. doi: 10.1093/annonc/mdy308
Recent Advances. Hepatobiliary Pancreat Dis Int (2008) 7:237–57. 21. Meng XP, Wang YC, Zhou JY, Yu Q, Lu CQ, Xia C, et al. Comparison of MRI
7. Li SH, Guo ZX, Xiao CZ, Wei W, Shi M, Chen ZY, et al. Risk Factors for Early and CT for the Prediction of Microvascular Invasion in Solitary
and Late Intrahepatic Recurrence in Patients With Single Hepatocellular Hepatocellular Carcinoma Based on a Non-Radiomics and Radiomics
Carcinoma Without Macrovascular Invasion After Curative Resection. Asian Method: Which Imaging Modality Is Better? J Magn Reson Imaging (2021)
Pac J Cancer Prev (2013) 14:4759–63. doi: 10.7314/apjcp.2013.14.8.4759 54:526–36. doi: 10.1002/jmri.27575
8. Zhou YM, Yang JM, Li B, Yin ZF, Xu F, Wang B, et al. Risk Factors for Early 22. An C, Kim DW, Park YN, Chung YE, Rhee H, Kim MJ. Single Hepatocellular
Recurrence of Small Hepatocellular Carcinoma After Curative Resection. Carcinoma: Preoperative MR Imaging to Predict Early Recurrence After
Hepatobiliary Pancreat Dis Int (2010) 9:33–7. Curative Resection. Radiology (2015) 276:433–43. doi: 10.1148/
9. Hirokawa F, Hayashi M, Asakuma M, Shimizu T, Inoue Y, Uchiyama K. Risk radiol.15142394
Factors and Patterns of Early Recurrence After Curative Hepatectomy for 23. Ahn SJ, Kim JH, Park SJ, Kim ST, Han JK. Hepatocellular Carcinoma:
Hepatocellular Carcinoma. Surg Oncol (2016) 25:24–9. doi: 10.1016/ Preoperative Gadoxetic Acid-Enhanced MR Imaging Can Predict Early
j.suronc.2015.12.002 Recurrence After Curative Resection Using Image Features and Texture
10. Poon RT, Fan ST, Ng IO, Lo CM, Liu CL, Wong J. Different Risk Factors and Analysis. Abdom Radiol (NY) (2019) 44:539–48. doi: 10.1007/s00261-018-
Prognosis for Early and Late Intrahepatic Recurrence After Resection of 1768-9
Hepatocellular Carcinoma. Cancer (2000) 89:500–7. doi: 10.1002/1097-0142 24. Zhou Y, He L, Huang Y, Chen S, Wu P, Ye W, et al. CT-Based Radiomics
(20000801)89:33.0.CO;2-O Signature: A Potential Biomarker for Preoperative Prediction of Early
11. Summers RM. Are We at a Crossroads or a Plateau? Radiomics and Machine Recurrence in Hepatocellular Carcinoma. Abdom Radiol (NY) (2017)
Learning in Abdominal Oncology Imaging. Abdom Radiol (NY) (2019) 42:1695–704. doi: 10.1007/s00261-017-1072-0
44:1985–9. doi: 10.1007/s00261-018-1613-1 25. Zhang B, Tian J, Dong D, Gu D, Dong Y, Zhang L, et al. Radiomics Features of
12. Limkin EJ, Sun R, Dercle L, Zacharaki EI, Robert C, Reuze S, et al. Promises Multiparametric MRI as Novel Prognostic Factors in Advanced
and Challenges for the Implementation of Computational Medical Imaging Nasopharyngeal Carcinoma. Clin Cancer Res (2017) 23:4259–69.
(Radiomics) in Oncology. Ann Oncol (2017) 28:1191–206. doi: 10.1093/ doi: 10.1158/1078-0432
annonc/mdx034 26. Fave X, Zhang L, Yang J, Mackin D, Balter P, Gomez D, et al. Delta-Radiomics
13. Baltrusaitis T, Ahuja C, Morency LP. Multimodal Machine Learning: A Features for the Prediction of Patient Outcomes in Non-Small Cell Lung
Survey and Taxonomy. IEEE Trans Pattern Anal Mach Intell (2019) Cancer. Sci Rep (2017) 7:588. doi: 10.1038/s41598-017-00665-z
41:423–43. doi: 10.1109/TPAMI.2018.2798607 27. Cusumano D, Meijer G, Lenkowicz J, Chiloiro G, Boldrini L, Masciocchi C,
14. Atrey PK, Hossain MA, Saddik AE, Kankanhalli MS. Multimodal Fusion for et al. A Field Strength Independent MR Radiomics Model to Predict
Multimedia Analysis: A Survey. Multimedia Syst (2010) 16(6):345–79. doi: Pathological Complete Response in Locally Advanced Rectal Cancer. Radiol
10.1007/s00530-010-0182-0 Med (2021) 126:421–9. doi: 10.1007/s11547-020-01266-z
Frontiers in Oncology | www.frontiersin.org 12 March 2022 | Volume 12 | Article 745258He et al. Radiomics in Hepatocellular Carcinoma Survival
28. Zhang Y, He K, Guo Y, Liu X, Yang Q, Zhang C, et al. Novel Multimodal 36. Kirienko M, Cozzi L, Antunovic L, Lozza L, Fogliata A, Voulaz E, et al.
Radiomics Model for Preoperative Prediction of Lymphovascular Invasion in Prediction of Disease-Free Survival by the PET/CT Radiomic Signature in
Rectal Cancer. Front Oncol (2020) 10:457. doi: 10.3389/fonc.2020.00457 Non-Small Cell Lung Cancer Patients Undergoing Surgery. Eur J Nucl Med
29. Lambin P, Leijenaar RTH, Deist TM, Peerlings J, de Jong EEC, van Timmeren Mol Imaging (2018) 45:207–17. doi: 10.1007/s00259-017-3837-7
J, et al. Radiomics: The Bridge Between Medical Imaging and Personalized 37. Park VY, Han K, Lee E, Kim EK, Moon HJ, Yoon JH, et al. Association
Medicine. Nat Rev Clin Oncol (2017) 14:749–62. doi: 10.1038/ Between Radiomics Signature and Disease-Free Survival in Conventional
nrclinonc.2017.141 Papillary Thyroid Carcinoma. Sci Rep (2019) 9:4501. doi: 10.1038/s41598-
30. Davnall F, Yip CS, Ljungqvist G, Selmi M, Ng F, Sanghera B, et al. Assessment 018-37748-4
of Tumor Heterogeneity: An Emerging Imaging Tool for Clinical Practice? 38. Zheng BH, Liu LZ, Zhang ZZ, Shi JY, Dong LQ, Tian LY, et al. Radiomics
Insights Imaging (2012) 3:573–89. doi: 10.1007/s13244-012-0196-6 Score: A Potential Prognostic Imaging Feature for Postoperative Survival of
31. Guo J, Seo Y, Ren S, Hong S, Lee D, Kim S, et al. Diagnostic Performance of Solitary HCC Patients. BMC Cancer (2018) 18:1148. doi: 10.1186/s12885-018-
Contrast-Enhanced Multidetector Computed Tomography and Gadoxetic 5024-z
Acid Disodium-Enhanced Magnetic Resonance Imaging in Detecting
Hepatocellular Carcinoma: Direct Comparison and a Meta-Analysis. Conflict of Interest: YG was employed by GE Healthcare.
Abdom Radiol (NY) (2016) 41:1960–72. doi: 10.1007/s00261-016-0807-7
32. Kim HY, Choi JY, Kim CW, Bae SH, Yoon SK, Lee YJ, et al. Gadolinium The remaining authors declare that the research was conducted in the absence of
Ethoxybenzyl Diethylenetriamine Pentaacetic Acid-Enhanced Magnetic any commercial or financial relationships that could be construed as a potential
Resonance Imaging Predicts the Histological Grade of Hepatocellular conflict of interest.
Carcinoma Only in Patients With Child-Pugh Class A Cirrhosis. Liver
Transpl (2012) 18:850–7. doi: 10.1002/lt.23426 Publisher’s Note: All claims expressed in this article are solely those of the authors
33. Huppertz A, Haraida S, Kraus A, Zech CJ, Scheidler J, Breuer J, et al. and do not necessarily represent those of their affiliated organizations, or those of
Enhancement of Focal Liver Lesions at Gadoxetic Acid-Enhanced MR the publisher, the editors and the reviewers. Any product that may be evaluated in
Imaging: Correlation With Histopathologic Findings and Spiral CT–Initial this article, or claim that may be made by its manufacturer, is not guaranteed or
Observations. Radiology (2005) 234:468–78. doi: 10.1148/radiol.2342040278 endorsed by the publisher.
34. Sumie S, Kuromatsu R, Okuda K, Ando E, Takata A, Fukushima N, et al.
Microvascular Invasion in Patients With Hepatocellular Carcinoma and Its Copyright © 2022 He, Hu, Zhu, Xu, Ge, Hao, Dong, Chen, Dong and Zhou. This is an
Predictable Clinicopathological Factors. Ann Surg Oncol (2008) 15:1375–82. open-access article distributed under the terms of the Creative Commons Attribution
doi: 10.1245/s10434-008-9846-9 License (CC BY). The use, distribution or reproduction in other forums is permitted,
35. Park H, Lim Y, Ko ES, Cho HH, Lee JE, Han BK, et al. Radiomics Signature on provided the original author(s) and the copyright owner(s) are credited and that the
Magnetic Resonance Imaging: Association With Disease-Free Survival in original publication in this journal is cited, in accordance with accepted academic
Patients With Invasive Breast Cancer. Clin Cancer Res (2018) 24:4705–14. practice. No use, distribution or reproduction is permitted which does not comply with
doi: 10.1158/1078-0432 these terms.
Frontiers in Oncology | www.frontiersin.org 13 March 2022 | Volume 12 | Article 745258You can also read