Modern livestock farming under tropical conditions using sensors in grazing systems
←
→
Page content transcription
If your browser does not render page correctly, please read the page content below
www.nature.com/scientificreports
OPEN Modern livestock farming
under tropical conditions using
sensors in grazing systems
Eliéder Prates Romanzini1*, Rafael Nakamura Watanabe2, Natália Vilas Boas Fonseca1,
Andressa Scholz Berça1, Thaís Ribeiro Brito1, Priscila Arrigucci Bernardes3,
Danísio Prado Munari2 & Ricardo Andrade Reis1
The aim of this study was to evaluate a commercial sensor—a three-axis accelerometer—to predict
animal behavior with a variety of conditions in tropical grazing systems. The sensor was positioned on
the underjaw of young bulls to detect the animals’ movements. A total of 22 animals were monitored
in a grazing system, during both seasons (wet and dry), with different quality and quantity forage
allowance. The machine learning (ML) methods used were random forest (RF), convolutional neural
net and linear discriminant analysis; the metrics used to determine the best method were accuracy,
Kappa coefficient, and a confusion matrix. After predicting animal behavior using the best ML
method, a forecast for animal performance was developed using a mechanistic model: multiple linear
regression to correlate intermediate average daily gain (iADG) observed versus iADG predicted. The
best ML method yielded accuracy of 0.821 and Kappa coefficient of 0.704, was RF. From the forecast
for animal performance, the Pearson correlation was 0.795 and the mean square error was 0.062.
Hence, the commercial Ovi-bovi sensor, which is a three-axis accelerometer, can act as a powerful tool
for predicting animal behavior in beef cattle production developed under a variety tropical grazing
condition.
The fourth industrial revolution within agriculture led, around the year 2010, to the concept of precision agricul-
ture or agriculture 4.01. This consisted of introduction of many technologies from the industrial sector that had
the aim of improving production and economic results. Within this movement, the last sector to start the fourth
revolution was livestock, through creation of the concept of the precision livestock f arm2. This recently gener-
ated concept has been incorporated into different studies aimed at improving sustainable production (animal
performance and welfare; and economic, environmental and social results). The main devices, technologies and
methods present in these investigations have been computers, sensors, cloud computing, machine learning (ML)
and artificial intelligence. Even with all these new perspectives, only 19% of published papers using ML relate to
livestock production3. Thus, a major gap within which to develop further research exists.
In this regard, some authors highlighted that understanding animals’ feeding behavior within grazing systems
could improve management and consequently increase the efficiency of animal production4. However, to imple-
ment these new technologies, various limitations remain unresolved: these are technological (e.g. internet access,
weak signal and absence of an ideal device), scientific (e.g. sensor position, transmission rate, forage management
and animal nutrition) and economic (e.g. cost per device and labor efficiency).
In this way, different approaches are being performed to increase prediction to grazing behavior, wherein
Barwick et al.5 measured sensitivity of grazing behavior attaching sensor on three location (ear, neck, and leg)
and achieve values equal to 92%. Other relevant proposal was joining devices, as accelerometers and GPS sensor,
which could allow improvement on behavior classifications, as observed by Riaboff et al.6, which reported 100%
of sensitivity on grazing behavior. Other study showed the promising usage of sensors reporting correlations
above 0.68 to different behaviors in beef cattle, using accelerometer and pedometer, under grazing system on
organically managed vineyard7. Although using only accelerometers, Rayas-Amor et al.8 validated this device
to grazing and ruminating behaviors on lactating dairy cows kept in a paddock during day and housed at night.
Furthermore, different transmission rate was evaluated by Alvarenga et al.4, which tested intervals equal to 3, 5
1
Department of Animal Science, São Paulo State University (Unesp), Via de Acesso Prof. Paulo Donato Castellane
s/n, Jaboticabal, SP 14884‑900, Brazil. 2Department of Engineering and Exact Sciences, São Paulo State University
(Unesp), Jaboticabal, SP 14884‑900, Brazil. 3Department of Animal Science and Rural Development, Federal
University of Santa Catarina (UFSC), Florianópolis, SC 88045‑108, Brazil. *email: elieder.romanzini@gmail.com
Scientific Reports | (2022) 12:2654 | https://doi.org/10.1038/s41598-022-06650-5 1
Vol.:(0123456789)
www.nature.com/scientificreports/
Animal groupb
Animal behaviour (% TOR) Nellore-dry Nellore-wet Crossbred-wet Overallc
Grazing 19.9 30.2 56.0 28.9
Ruminating 9.7 0.1 10.8 9.8
Lying-standinga 59.0 64.9 25.5 51.0
Drinking 1.5 1.2 1.3 1.4
Eating 7.1 1.7 3.0 6.0
Other activities 2.8 1.9 3.4 2.9
Table 1. Types of animal behavior (grazing, ruminating, lying-standing, drinking, eating and other activities)
as percentages of the total observation record (TOR), from visual observation in loco + video records during
both seasons (dry and wet). a Lying-standing: activities of lying down + standing up. bAnimal groups: Nellore-
dry: Nellore animals finished during dry season; Nellore-wet: Nellore animals reared during the wet season;
Crossbred-wet: crossbred animals reared during the wet season. cOverall: percentage of each type of animal
behavior, considering during both phases (rearing and finishing phases) and both seasons (wet and dry
seasons).
Animal behavior
Item Grazing Ruminating Lying-standinga Drinking Eating Otherb Accyc Kappad
Random forest 0.821 0.704
Sensitivity 0.822 0.675 0.937 0.228 0.411 0.417
Specificity 0.932 0.996 0.752 0.999 0.996 0.999
Precision 0.831 0.954 0.796 0.964 0.863 0.932
Convolutional neural net 0.626 0.336
Sensitivity 0.614 0.072 0.858 0.000 0.045 0.013
Specificity 0.829 0.995 0.501 1.000 0.997 0.999
Precision 0.593 0.623 0.643 NAe 0.474 0.283
Linear discriminant analysis 0.596 0.283
Sensitivity 0.598 0.000 0.829 0.000 0.017 *
Specificity 0.798 0.999 0.480 0.999 0.995 **
Precision 0.549 NA 0.623 NA 0.174 ***
Table 2. Results from prediction (sensitivity, specificity, precision, accuracy and Kappa coefficient) through
machine learning methods (random forest, convolutional neural net and linear discriminant analysis),
of the different types of animal behavior observed (grazing, ruminating, lying-standing, drinking, eating
and other activities) during both seasons (dry and wet). a Lying-standing: lying down + standing activities.
b
Other: Other activities. cAccy: accuracy. dKappa: Kappa coefficient. eNA: not available. *Sensitivity-other
activities = 8.881 × 10⁻⁴. **Sensitivity-other activities = 9.998 × 10⁻¹. ***Precision-other activities = 1.250 × 10⁻¹.
or 10 s of accelerometer transmission to classify sheep ingestive behavior. The authors found accuracy close to
0.79 considering 5 s interval and suggested as the best to predict the main five behaviors studied. Even though
previous studies have yielded interesting results, these were based studying only one breed or specific conditions,
and some of them concluded that further studies using sensors in grazing systems under different conditions are
necessary9.Thus, the aim of the present study was to evaluate a commercial sensor—a three-axis accelerometer—
to predict animal behavior with a variety of conditions in tropical grazing systems, using different animal genetic
groups monitored during both the wet and the dry season, at different beef cattle phases (rearing or finishing).
Results
The types of animal behavior accounted for different percentages of the total observation record (TOR) from
the visual observation in loco + video record. These were as follows: 28.9% grazing, 9.8% ruminating, 51.0%
lying-standing, 1.4% drinking, 6.0% eating and 2.9% other activities, overall, in the TOR. These values showed
that the animal behavior monitored during both phases (rearing and finishing phases) and both seasons (wet
and dry seasons) showed unbalanced distribution. The same unbalanced distribution of animal behavior could
be seen in each animal group and season (Table 1).
All the metrics obtained from animal behavior prediction, using different machine learning methods, are
demonstrated in Table 2. The best machine learning method was the random forest method, which yielded
accuracy of 0.821 and Kappa coefficient of 0.704. These metrics for the other ML methods were, respectively,
Accy = 0.626 and 0.596, and κ = 0.336 and 0.283, for CNN and LDA. The confusion matrix metrics for each type of
animal behavior showed that, in general, higher metrics were obtained through using the random forest method.
Scientific Reports | (2022) 12:2654 | https://doi.org/10.1038/s41598-022-06650-5 2
Vol:.(1234567890)www.nature.com/scientificreports/
Figure 1. Pattern of records from the X-axis, Y-axis and Z-axis for each type of animal behavior observed
(grazing, ruminating, lying-standinga, drinking, eating and other activities), from monitoring one animal in this
study. (aLying-standing: activities of lying down + standing up).
The sensitivity measurements from the random forest method were 0.822, 0.675, 0.937, 0.228, 0.411 and 0.417 for
the animal behaviors of grazing, ruminating, lying-standing, drinking, eating and other activities, respectively.
Considering only the animal behavior of grazing, the confusion matrix metrics of specificity and precision
were 0.932 and 0.831 from the random forest method, respectively; 0.829 and 0.593 from CNN, respectively;
and 0.798 and 0.549 from LDA, respectively. For the animal behavior of ruminating, these values were 0.996
and 0.954 from random forest; 0.995 and 0.623 from CNN; and 0.999 and not available (result obtained when
the machine learning method did not predict the animal behavior during the analysis) from LDN, respectively
for specificity and precision. For the other types of animal behavior (lying-standing, drinking, eating and other
activities) the metrics of specificity and precision from each machine learning method were as follows, respec-
tively: 0.752 and 0.796 from RF, 0.501 and 0.643 from CNN, and 0.480 and 0.623 from LDA; 0.999 and 0.964
from RF, 1.000 and not available from CNN, and 0.999 and not available from LDA; 0.996 and 0.863 from RF,
0.997 and 0.474 from CNN, and 0.995 and 0.174 from LDA; and 0.999 and 0.932 from RF, 0.999 and 0.283 from
CNN, and 9.998 × 10⁻¹ and 1.250 × 10⁻¹ from LDA.
The imbalance in animal behavior seen in the total observation record (as mentioned above) caused different
patterns recorded from each axis (X, Y and Z) for each type of animal behavior (grazing, ruminating, lying-
standing, drinking, eating and other activities) from each animal during each observation day (Fig. 1). From
these graphs, it was possible to define the times of the day when each type of animal behavior occurred. For
example, eating was concentrated at three times (10:00, 12:00 and 16:00 h). Furthermore, the resting position
or standing without locomotion reduce the acceleration (ɡ) from all axis (X, Y and Z), in comparison with the
other types of animal behavior.
The Pearson correlation from forecasting animal performance between the observed iADG vs the predicted
iADG was 0.795 and the MSE was 0.062. The summary iADG measurements (maximum, minimum and mean)
were respectively 1.552, 0.103 and 1.063 kg for the observed iADG; and 1.602, 0.410 and 1.096 kg for the pre-
dicted iADG. More specific results were obtained from each genetic group, with Pearson correlation and MSE
of 0.855 and 0.053 for the Nellore groups and 0.637 and 0.084 for the crossbred group, respectively.
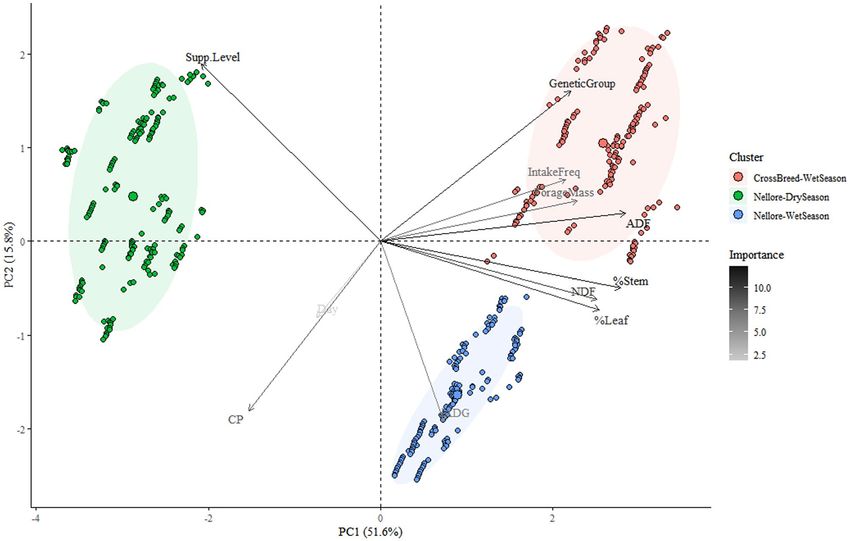
The total data variability in the principal component analysis (Fig. 2) was 67.4%. This was divided into the first
principal component (PC1 = 51.6%) and the second (PC2 = 15.8%). The PCA results clearly defined the presence
of three clusters, which validated the initial three different animal groups monitored in this study. Figure 2 shows
the importance of each variable that was used as an input to the PCA: the lowest importance was observed for
the variable of the day and the highest for the supplement level.
Scientific Reports | (2022) 12:2654 | https://doi.org/10.1038/s41598-022-06650-5 3
Vol.:(0123456789)www.nature.com/scientificreports/
Figure 2. Principal component analysis on the final responses according to their importance for forecasting
animal performance and food intake frequency, using a Random Forest method. iADG, intermediate average
daily gain; NDF, neutral detergent fiber; ADF, acid detergent fiber; CP, crude protein; PC1, principal component
one; PC2, principal component two.
Discussion
The variety of the initial dataset should be highlighted, considering that data collection occurred under dif-
ferent conditions within grazing systems: in the wet and dry seasons, respectively at the animal development
phases of rearing and finishing. Thus, this differed from the conditions under which previous studies had been
conducted4,7,10–12. In those studies, a traditional approach of evaluation of only one specific time, either in a
grazing system or not, had been used.
This variety of dataset was an aim for the present study, considering that Brazil has a herd of about 214 million
head13 that are mainly kept in grazing systems throughout the production chain. In this regard, the frequency
of food intake (grazing + eating) predicted from the random forest method was a mean time of 20.35 min h−1
(8.14 h day−1) spent on this activity. Considering each phase separately, the results were 15.19 min h−1
(6.08 h day−1) and 20.35 min h−1 (8.14 h day−1) for the finishing (dry season) and rearing (wet season) phases,
respectively.
Recognizing these types of animal behavior is important, given that animals’ performance is directly influ-
enced, in addition to other factors, by their frequency of food intake. Performance can thus be determined
with regard to nutritional and non-nutritional factors14. Schoenbaum et al.15 and Benvenutti et al.16 evaluated
cattle behavior using other devices in grazing systems. They described differences in the time spent on grazing
according to the different conditions, due mainly to forage quality and quantity. The present study also seen
this difference, which can be justified due to lower forage mass (5020 kg/ha) available during the dry season,
with lower leaf percentage (14.5%), compared to wet season, that presented higher both forage mass (7900 kg/
ha) and leaf percentage (30.7%). The knowledge of this variation according to season, lead to adjust the animal
management, providing adequate diet supplement level, mainly during dry season. This supplementation aims
promotes substitutive effect on forage intake17, which replace the main food source, i.e., the animal decreases
the forage intake due to higher supplement consumption, which result in lower time spent on grazing, once the
chemostatic mechanisms of satiety is achieve instead of physical fill in the r umen18. In the other way, during the
wet season, the forage quality and quantity allows absence of supplementation (using only mineral mixture) or
low levels of supplementation, what lead the animals spent more time grazing, once the main food source is the
forage. In this situation, the grazing time will be determined mainly by the physical fulfill of the r umen18. These
conditions generate in our study, values of 19.9% of grazing behavior on dry season against 30.2% for Nellore
and 56% for crossbred on wet season. The metrics from the machine learning method showed that random for-
est had accuracy of 0.821 for predicting of the studied animal behaviors. This needs to be highlighted because
it is determinant for ascertaining the previous time spent. For grazing and eating, respectively, the sensitivity,
Scientific Reports | (2022) 12:2654 | https://doi.org/10.1038/s41598-022-06650-5 4
Vol:.(1234567890)www.nature.com/scientificreports/
specificity and precision were 0.822, 0.932 and 0.831; and 0.411, 0.996 and 0.863. If the sensitivity relating to
eating behavior is excluded, all the other metrics were above 0.800. Alvarenga et al.4 studying accelerometer to
classify sheep behavior in only one pasture type reported values above 0.843 for these metrics to grazing and the
authors suggested that the model considering transmission interval of each 5 s promote an accurately predicted
grazing behavior. Similar value of precision for feeding behavior (0.88) was observed using Original Braunvieh
cattle during 15 days of a unique s eason7. Pereira et al.19 studying accelerometers to predict grazing behavior
of dairy cows reported precision above 0.88 to feeding. Even though the present study used different breed and
different pasture conditions in the same model, the results achieved values for grazing behavior close to observed
on literature, as well as the general kappa (0.704) can be considered substantial by Landis and Koch20 classifica-
tion, therefore the results can be promising to tropical conditions.
Tedeschi21 reported that accuracy and precision are two crucial metrics for evaluating a model, considering
the observed versus predicted values. This latter author also stated that accuracy constitutes the ability of the
model to predict the right values, while precision is the ability of the model to predict similar values consistently.
Thus, considering that the concepts and metrics from the random forest method were the best ones in the present
study, good prediction was obtained. Moreover, the bias from visual observation in loco + video records, per-
formed by different individuals might, even after training, could be a factor that can lead to obtain lower metrics8.
Also, in relation to the metrics from the best machine learning method used for prediction, the lowest sen-
sitivity (0.228) was measured for the animal behavior of drinking. This was probably due to the lower number
of occurrences of this type of behavior that were registered through visual observation in loco + video records
(1.439% of the total raw data). Some authors reported that large datasets had great importance in that they
eliminated bias, noise and data i mbalance22,23. According to the latter a uthors23, a large dataset with large vari-
ability, covering as many foreseeable scenarios as possible, should be used for training and testing of machine
learning methods. In the present study, changes to natural animal behavior in grazing systems between the two
times evaluated were avoided. Thus, the imbalance among all the types of animal behavior evaluated (grazing,
ruminating, lying-standing, drinking, eating and other activities) was natural, which can be explained by the
fact that the behaviors follow the circadian pattern.
Although the imbalanced behaviors were observed during both season, there were difference on type of
behaviors with highest and lowest percentages. The behavior with higher percentage on dry season was lying-
standing and with low percentages were drinking and other activities. While on wet season, the percentage of
behaviors were different according to animal groups (Nellore or crossbreed), wherein in general, grazing highlight
with high percentage and eating with low. The classifiers algorithms tend to easily identify the majority class
(behavior with high percentage) and fail to predict the minority class samples (behavior with low percentage)
with adequate a ccuracy24. In fact, using our dataset with other purposes, and training the random forest with
data from one season to predict on data of the other season, resulted on very low predictive ability. However,
the ease of predict the majority class could be observed, wherein training with dry season data to predict on wet
season, higher predictive ability for lying-standing behavior (sensitivity 48.5% higher) compared for grazing was
measured. The opposite was observed when using to train the dataset from wet season to predict the behaviors
on dry season, with the same quantity of data. In this case, higher predictive ability for grazing (sensitivity 2.3%
higher) was noted when compared to lying-standing behavior. The behavior with high percentage on training
data was less difficult to predict. In both cases, the less frequent behaviors were harmed, with low predict ability.
In this way, join the data from different conditions in unique dataset to train the algorithm, allows improve the
accuracies in general, as showed in this study.
Animal behaviors were then predicted using the random forest machine learning, which was called “hybridi-
zation” by Ellis et al.22. This was because the responses from the machine learning method are used as the input to
a mechanistic model, i.e. multiple linear regression, from which in this case forecasting of animal performance,
measured by the intermediate average daily gain (iADG) is obtained. According to M oretti25, even when animals
undergo a fasting period, a range of body weight increase from 4 to 12% may occur. Therefore, in the present
study, the animals were weighed without having undergone a previous fasting period, and this was also done in
another research. Even using the iADG and with low number of animals to forecast animal performance, which
is not recommended, this study tried to suggest different approach that predicted behaviors by accelerometers
can be used. The Pearson correlation obtained through comparison of the observed iADG versus the predicted
iADG was 0.795, which was promising. According to H opkins26, who described a scale of magnitudes for statisti-
cal effects, the present value would be classified as very large. Separate forecasts of animal performance for the
Nellore and crossbred animals using the same scale showed that the value for the Nellore animals was classified
as very large, for both seasons (wet and dry) and both developmental phases (rearing and finishing). The value
for the crossbred animals was classified as large.
The frequency of food intake is one of the many factors that can influence average daily gain. Since the MLR
to predict iADG considered nutritional value of forage, supplement level and day, the animals in the same
level of these factors were in the same phase of life and similar physiologic condition. Therefore, the individual
behavior of frequency of food intake that each animal developed, both within and between the genetic groups,
can explain the differences observed for Pearson correlation on studied breeds. These potentials that exist both
between genetic groups and between weather conditions can cause changes to frequency of food intake among
animals27. Also in this regard, evaluating Holstein Friesian cows that were kept in barns and in a grazing system,
research reported that there was a major individual effect on the time spent on grazing and ruminating28. A final
validation was observed from principal component analysis, consisting of an unsupervised learning method that
was performed using all the final results from the hybridization process. This resulted in clustering comprising
three clusters, which were precisely the same three animal groups that were initially monitored (Nellore—dry
season; Nellore—wet season; and crossbred animals—wet season). This result showed that through using only
Scientific Reports | (2022) 12:2654 | https://doi.org/10.1038/s41598-022-06650-5 5
Vol.:(0123456789)www.nature.com/scientificreports/
the predicted values from the machine learning method (random forest) and the mechanistic model (MLR), and
the feed nutritional value, the real condition was proven.
The traditional method of predicting dry matter intake presents various difficulties, especially among
ruminants29. Although the approach of the present study was not to obtain dry matter intake, the observing the
results of the present study showed that the frequency of food intake predictions can be performed easily. Here,
sensors comprising three-axis accelerometers produced with real-time records that were input to hybridization
using a machine learning method (random forest) plus a mechanistic model (MLR). This resulted in a large
amount of information and knowledge that can be used by farmers to improve their decision-making regarding
the beef cattle production chain, developed under tropical grazing conditions.
Hence, the precision livestock farm has become a reality boosted through Agriculture 4.0, using technologies
like sensors, big data and machine learning (artificial intelligence). The commercial Ovi-bovi sensor, which is
a three-axis accelerometer, can act as a powerful tool for predicting animal behavior on variety of conditions
in tropical grazing systems. The use of this prediction seems promising for forecasting animal performance,
although more studies are recommended, aiming to provide information for farmers and researchers that enables
higher production with greater efficiency under tropical rangeland.
Methods
All the procedures used followed the Ethical Principles for Animal Experimentation stated by the National
Council for Animal Experiment Control and were approved by the Ethics Committee for Use of Animals (CEUA)
of São Paulo State University (Unesp) (under protocol #001081/2019). Furthermore, this study followed all the
applicable procedure in accordance with the Animal Research: Reporting of In Vivo Experiments (ARRIVE)
guidelines30.
Experimental area and data collection. The field phase of this experiment was developed during both
the dry and the wet season, under tropical conditions, at the Forage Crops and Grasslands section of São Paulo
State University “Júlio de Mesquita Filho” (Unesp), in São Paulo, Brazil. The typical climate of this region is sub-
tropical humid, with dry winters and wet summers. Pastures were sown with Urochloa brizantha (Hochst.) Stapf,
commonly known as palisade grass or “Marandu” grass. The total pasture area of Forage Crops and Grasslands
section comprised 20 hectares (ha), where only nine paddocks of different areas were used in this study: one
paddock of 0.50 ha; five paddocks of 0.65 ha and three paddocks of 0.70 ha.
Three different animal groups were used to obtain all the sensor records: two groups of Nellore breed and one
crossbred group (½ Nellore + ½ Angus). One Nellore group was finished during the dry season by feeding with a
high level of supplementation: 2.0% BW (ingredients on Supplementary material—Table), composed by 17.4%
crude protein (CP), 13.8% neutral detergent fiber (NDF), 5.7% acid detergent fiber (ADF) and 15.9% gross energy
(GE). The other groups were reared during the wet season: the Nellore group was fed without supplementation
(using only a mineral mixture); and the crossbred group was fed with a supplement at the level of 0.3% BW
(ingredients on Supplementary Table S1), formulated using two different energy sources (corn and citrus pulp),
wherein the supplement with corn was composed by 10.6% CP, 11.4% NDF, 5.3% indigestible NDF and 85%
total digestive nutrients (TDN), while the supplement with citrus pulp was composed by 8.3% CP, 30.2% NDF,
7.5% indigestible NDF and 77% TDN. All the management practices used at both times (rearing and finishing
phases) followed moderate intensification criteria with continuous grazing, as described by Cardoso et al.31.
Data were gathered at two times: September and October 2019 (dry season); and January to March 2020
(wet season). A total of 22 animals with average age around 15 months were monitored by means of sensors:
ten Nellore animals (343 ± 27 kg) during the dry season, handled using 3.0 animal unit per hectare (AU/ha);
and five Nellore (310 ± 38 kg), handled using 5.9 AU/ha, and seven crossbred animals (324 ± 37 kg), handled
using 4.6 AU/ha, during the wet season. For all the animals, there was an adaptation period of a minimum of
seven days before the experiment was started, to accustom them to wearing a halter with a sensor attached.
The animals monitored in the experiment during 78 days on the wet season were in the rearing phase, while
those that were monitored during 19 days on the dry season were in the finishing phase. During the dry season,
the ambient mean temperature, maximum mean temperature, and minimum mean temperature were 26.1 °C,
34.0 °C and 18.5 °C, respectively, and the rainfall was 157 mm distributed over 12 days, producing an average of
forage mass (FM) equal to 5020 kg/ha with 1.6 leaf to stem ratio, 16.5% CP, 51.5% NDF and 24.9% ADF. During
the wet season, these temperatures were 24.9 °C, 30.5 °C and 19.4 °C, respectively, and the rainfall was 627 mm
distributed over 44 days, which produced on average 7900 kg/ha of FM with 1.0 leaf to stem ratio, 15.6% CP,
61.3% NDF and 30.2% ADF.
Sensors and animal behavior. The sensors used in this study were three-axis accelerometers using a micro-
electromechanical system (MEMS) (model LIS2DE12; ST Microelectronics), supplied in the form of a commer-
cial device from the Ovi-bovi company. The device weighed 80 g, with dimensions of 105 mm × 60 mm × 22 mm,
and was attached to a halter and positioned on the underjaw of the young bulls to detect their movements,
similar to what was described by Watanabe et al.32. The sensors were used to record movements along the three
axes (X [horizontal movements − side to side], Y [longitudinal movements − front to back] and Z [vertical move-
ments − up and down]) throughout the day and night (24 h).
Each record was made in real time over a period of 6 s (approximately 0.167 Hz), which was defined consider-
ing study purpose and battery usage following manufacturer. These records were collected using a wireless system
(band of 433 MHz) and stored in the company server (Ovi-bovi). The raw data were then accessed and stored
for use in the present study, after conversion from their decimal format to ɡ units (ɡ = 9.81 m s−2).
Scientific Reports | (2022) 12:2654 | https://doi.org/10.1038/s41598-022-06650-5 6
Vol:.(1234567890)www.nature.com/scientificreports/
Animal behavior Characterization
Animals searching for food while walking short distances with their head down, without picking food up with their
Grazinga mouth; standing still with their head down while apprehending food with their mouth; and chewing either with their
head down or their head up, while stationary
Ruminating Animals chewing and swallowing a ruminal bolus
Lying-standingb Animals lying down in any resting position and animals standing up on all four legs, without locomotion
Drinking Animals putting their mouth in a water drinker and swallowing
Eating Animals located in the feeding supplement zone, ingesting dietary supplement
Other activities Animals doing activities other than those described above
Table 3. Classification for registering different types of animal behaviour. a Supplementary Video S2. bLying-
standing: activities of lying down and standing up (Alvarenga et al.4, Poulopoulou et al.7).
Variable Equation
SMAa |Xi | + |Yi | + |Zi |
SVMb
Xi2 + Yi2 + Zi2
Movement variation |Xi+1 − Xi | + |Yi+1 − Yi | + |Zi+1 − Zi |
Energy
2
2
Xi + Yi2 + Zi2
Entropy (1 + (Xi + Yi + Zi ))2 × ln 1 + (Xi + Yi + Zi )2
Pitch (degrees) tan−1 −Xi Yi2 + Zi2 × 180/π
Roll (degrees) atan2(Yi , Zi ) × 180/π
Inclination (degrees) tan−1 Xi2 + Yi2 Zi × 180/π
Table 4. Calculation of variables from the sensor axis records. a SMA, signal magnitude area; bSVM, signal
vector magnitude (Alvarenga et al.4).
Information on real animal behavior was obtained from two sources: direct visual observations in loco33
during 2 days on dry season and 4 days during wet season totalizing 72 h and recordings using a video camera
(Xtrax model Xtrax Smart2) during 3 days on wet season totalizing 8 h. For both of these sources, records were
made every 10 min34. A total of 80 h of observations were made over a 12-h period per day (06:00 to 18:00 h) in
both seasons (dry and wet), as described by Barbero et al.35. A total of six types of animal behavior were observed:
grazing, ruminating, lying down + standing up (lying-standing), drinking, eating (ingesting dietary supplement)
and other activity (Table 3). In general, one training person was responsible for observing a maximum of three
animals kept in different paddocks, inside the experimental area described previously.
Machine learning methods. The initial dataset used in each machine learning procedure was the same.
It was composed of variables from the sensor, the animal’s identification, time data and calculated variables. The
sensor variables comprised the axis records (X, Y and Z); the animal identification variables were the SensorID
and genetic group and the time data variables were the day, month, hour, minute and second. The calculated
variables (signal magnitude area (SMA), signal vector magnitude (SVM), movement variation, energy, entropy,
pitch, roll and inclination) were obtained through the methods described by Alvarenga et al.4, using the axis
records from the sensor (Table 4).
After calculation of all these variables, a quality control process was performed to improve the dataset infor-
mation that would be used to evaluate all the machine learning methods. The quality control basically considered
a maximum interval between successive raw data records. Given that the sensors were configured to record
information relating to successive six-second periods, this control considered an interval of 60 s as a maximum.
When the successive raw data records were higher than 60 s, a new sequence was started for successive raw data
records, for all the variables previously mentioned.
For all the machine learning methods evaluated, the dataset was divided into two subsets (training and
validation). This process was developed to avoid overfitting. From the total dataset, 70% was considered to be a
training dataset and 30% was used to validate the ML method that had previously been trained using the training
set. In this way, the ML methods evaluated in the present study were random forest (RF), convolutional neural
net (CNN) and linear discriminant analysis (LDA). The predictive ability of each machine learning method was
measured using a confusion matrix (sensitivity, specificity and precision [Eqs. 1–3]), accuracy (Accy [Eq. 4])
and Kappa coefficient, obtained through using the “caret” package from R Core Team36.
Sensitivity = True Positive/(True Positive + False Negative) (1)
Scientific Reports | (2022) 12:2654 | https://doi.org/10.1038/s41598-022-06650-5 7
Vol.:(0123456789)www.nature.com/scientificreports/
Specificity = True Negative/(True Negative + False Positive) (2)
Precision = True Positive/(True Positive + False Positive) (3)
(True Positive + True Negative)
Accy = (4)
(True Positive + True Negative + False Positive + False Negative)
where True Positive was the number of instances in which the animal behavior of interest was correctly classified
after validation; False Negative was the number of instances in which the animal behavior of interest was observed
visually but was classified incorrectly as some other animal behavior; False Positive was the number of instances
in which the animal behavior of interest was incorrectly classified but not observed; and True Negative was the
number of instances in which the animal behavior of interest was correctly classified as not being observed.
Kappa coefficients (κ) compare the observed accuracy with the expected accuracy (random chance).
Landis and K och20 presented a classification system for kappa values, in which the correlation was defined
as poor (κ < 0.000), slight (0.000 < κ < 0.200), fair (0.201 < κ < 0.400), moderate (0.401 < κ < 0.600), substantial
(0.601 < κ < 0.800) or almost perfect (0.801 < κ < 1.000).
Random forest. The random forest method was performed in the R Software36 using different packages
within the software, like “randomForest”, “dplyr” and “e1071”. All the variables previously mentioned were used
in this analysis on machine learning. The model characteristics (mtry, nodesize and maxnodes) were kept as
defaults from “randomForest” package, but the ntree characteristic was defined as 500. A tuning process was
developed but no differences were obtained. Therefore, it was decided to use the default values.
Convolutional neural net. The convolutional neural net method with one dimension was performed in
the R S oftware36 using the “keras” and “Tensorflow” packages. This was done in the form “Keras + Tensorflow”.
The model architecture used in this evaluation had three layers with different neuron numbers (24, 12 and 6;
respectively for each layer). The activation function at the first two layers was relu, whereas at the last layer, soft-
max was used as the activation function. Other important information about the model structure included the
number of epochs, validation_split and batch_size, which were 500, 0.2 and 128, respectively. Lastly, the optimizer
used in this model was adam.
Linear discriminant analysis. The linear discriminant analysis, like other machine learning methods, was
performed in the R S oftware36 using a package called “MASS”. For this machine learning method, the entire
analysis was performed using a default from the package, to predict the different types of animal behavior evalu-
ated in this research.
Forecasting animal performance. An approach of animal behaviors information obtained by acceler-
ometers different of health and welfare application could be the prediction of animal performance, which can
assistant management in farm. Therefore, the present study evaluated a simple forecasting animal performance
using this information as an idea to be developed. After the best machine learning method for predicting animal
behavior has been defined, a new prediction was developed with the aim of obtaining the intermediate average
daily gain (iADG) from each animal. For this forecasting, data from all the 22 animals that had been monitored
with sensors were used. The iADG was calculated using the weight measured at the start and at the end of each
experimental period (which was defined each 28 days following other research that was developed in conjunc-
tion with the present study), when the animals were weighed without fasting, as commonly recommended to
obtain the final ADG.
The animal performance forecasting was developed using multiple linear regression (MLR)37. In addition
to intake frequency, which was previously obtained through machine learning predictions for each animal, the
following other variables were used at this time: genetic group, day, supplement level and some information
about forage, including crude protein (CP), neutral detergent fiber (NDF), acid detergent fiber (ADF), forage
mass and percentages of leaf (%Leaf) and stem (%Stem). All of this information about forage was obtained
through other research that was developed in conjunction with the present study, following methods described
by Koscheck et al.38.
In the same way as in the evaluation of machine learning methods, the dataset for this phase was divided
between training and validation datasets, using the same percentages previously mentioned for each dataset.
The Pearson correlation (r) and mean square error (MSE) were used to measure the predictive ability of MLR
to forecast animal performance. This correlation took into account the observed iADG (real value measured in
the field) vs the predicted iADG (value obtained from the MLR model). The MSE criterion used the values of the
predictive variables associated with future observations and with the magnitude of the estimated v ariance39. The
same evaluations were also made taking the genetic groups into account, with the aim of observing the forecasts
for animal performance in each of these groups. All of these evaluations were developed using the R Software36.
Multivariable analysis. Principal component analysis (PCA) was performed using all the variables present
in the final dataset used for forecasting animal performance. This dataset was composed of intake frequency,
iADG, supplement level, genetic group, forage mass, CP, NDF, ADF and %Leaf and %Stem. The PCA was per-
formed using the “factoextra” package of the R Software36. From these settings, factor analyses were obtained
Scientific Reports | (2022) 12:2654 | https://doi.org/10.1038/s41598-022-06650-5 8
Vol:.(1234567890)www.nature.com/scientificreports/
using PCA, which were calculated using a correlation matrix of the variables40,41. Through this, the total data
variability from the dataset was measured and, consequently, the presence or absence of clusters was defined.
Data availability
The datasets generated during and/or analyzed during the current study are available upon request to the corre-
sponding author. The files contain since animal behavior until sensor records, as described in “Methods” section.
The datasets are in extensions: *.xls, *.xlsx, *.RData.
Received: 5 July 2021; Accepted: 1 February 2022
References
1. Mazzetto, F., Gallo, R. & Sacco, P. Reflections and methodological proposals to treat the concept of “information precision” in
smart agriculture practices. Sensors 20, e-2847. https://doi.org/10.3390/s20102847 (2020).
2. Neethirajan, S. The role of sensors, big data and machine learning in modern animal farming. Sens. Bio-Sens. Res. 29, e-100367.
https://doi.org/10.1016/j.sbsr.2020.100367 (2020).
3. Liakos, K., Busato, P., Moshou, D., Pearson, S. & Bochtis, D. Machine learning in agriculture: a review. Sensors 18, e-2674. https://
doi.org/10.3390/s18082674 (2018).
4. Alvarenga, F. A. P. et al. Using a three-axis accelerometer to identify and classify sheep behavior at pasture. Appl. Anim. Behav.
181, 91–99. https://doi.org/10.1016/j.applanim.2016.05.026 (2016).
5. Barwick, J., Lamb, D. W., Dobos, R., Welch, M. & Trotter, M. Categorising sheep activity using a tri-axial accelerometer. Comput.
Electron. Agric. 145, 289–297. https://doi.org/10.1016/j.compag.2018.01.007 (2018).
6. Riaboff, L. et al. Development of a methodological framework for a robust prediction of the main behaviours of dairy cows using
a combination of machine learning algorithms on accelerometer data. Comput. Electron. Agric. 169, 105179. https://doi.org/10.
1016/j.compag.2019.105179 (2020).
7. Poulopoulou, I., Lambertz, C. & Gauly, M. Are automated sensors a reliable tool to estimate behavioural activities in grazing beef
cattle?. Appl. Anim. Behav. 216, 1–5. https://doi.org/10.1016/j.applanim.2019.04.009 (2019).
8. Rayas-Amor, A. A. et al. Triaxial accelerometers for recording grazing and ruminating time in dairy cows: an alternative to visual
observations. J. Vet. Behav. 20, 102–108. https://doi.org/10.1016/j.jveb.2017.04.003 (2017).
9. Greenwood, P. L. et al. Use of sensor-determined behaviours to develop algorithms for pasture intake by individual grazing cattle.
Crop Pasture Sci. 68, 1091–1099. https://doi.org/10.1071/CP16383 (2017).
10. Vázquez-Diosdado, J. A. et al. Classification of behaviour in housed dairy cows using an accelerometer-based activity monitoring
system. Anim. Biotelemetry 3, e-15. https://doi.org/10.1186/s40317-015-0045-8 (2015).
11. Benaissa, S. et al. Classification of ingestive-related cow behaviours using RumiWatch halter and neck-mounted accelerometers.
Appl. Anim. Behav. 211, 9–16. https://doi.org/10.1016/j.applanim.2018.12.003 (2019).
12. Benaissa, S. et al. On the use of on-cow accelerometers for the classification of behaviours in dairy barns. Res. Vet. Sci. 125, 425–433.
https://doi.org/10.1016/j.r vsc.2017.10.005 (2019).
13. ABIEC. Associação Brasileira das Indústrias Exportadoras de Carne. Perfil da Pecuária no Brasil—Beef Report 2020. http://abiec.
com.br/publicacoes/beef-report-2020/ (2020). Accessed 22 Oct 2020.
14. Poppi, D. P., Hugues, J. P. & L’Huillier, P. J. Intake of pasture by grazing ruminants. In Livestock Feeding on Pasture (ed. Nichol, A.
M.) 55–63 (Society of Animal Production, 1987).
15. Schoenbaum, I., Kigel, J., Ungar, E. D., Dolev, A. & Henkin, Z. Spatial and temporal activity of cattle grazing in Mediterranean oak
woodland. Appl. Anim. Behav. 187, 45–53. https://doi.org/10.1016/j.applanim.2016.11.015 (2017).
16. Benvenutti, M. A., Pavetti, D. R., Poppi, D. P., Gordon, I. J. & Cangiano, C. A. Defoliation patterns and their implications for the
management of vegetative tropical pastures to control intake and diet quality by cattle. Grass Forage Sci. 71, 424–436. https://doi.
org/10.1111/gfs.12186 (2016).
17. Moore, J. E. Forage Crops. In Crop Quality, Storage, and Utilization (ed. Hoveland, C. S.) (Crop Science Society of America, 1980).
18. Mertens, D. R. Regulation of forage intake. In Forage Quality, Evaluation and Utilization (eds Fahey Junior, G. C. et al.) 450–493
(American Society of Agronomy, Crop Science of America, Soil Science of America, 1994).
19. Pereira, G. M. et al. Validation of an ear tag-based accelerometer system for detecting grazing behavior of dairy cows. J. Dairy Sci.
103, 3529–3544. https://doi.org/10.3168/jds.2019-17269 (2020).
20. Landis, J. R. & Koch, G. G. The measurement of observer agreement for categorical data. Biometrics 33, 159–174 (1977).
21. Tedeschi, L. O. Assessment of the adequacy of mathematical models. Agric. Syst. 89, 225–247. https://doi.org/10.1016/j.agsy.2005.
11.004 (2006).
22. Ellis, J. L. et al. Review: Synergy between mechanistic modelling and data-driven models for modern animal production systems
in the era of big data. Animal 14, s223–s237. https://doi.org/10.1017/S1751731120000312 (2020).
23. Kamilaris, A. & Prenafeta-Boldu, F. X. Deep learning in agriculture: a survey. Comput. Electron. Agric. 147, 70–90. https://doi.org/
10.1016/j.compag.2018.02.016 (2018).
24. Zheng, Z., Cai, Y. & Li, Y. Oversampling method for imbalanced classification. Comput. Inform. 34, 1017–1037 (2015).
25. Moretti, M. H. Entendendo o que estou produzindo. O que vendemos? Boi ou carcaça? in Entendendo o conceito – Boi 777 (eds.
Resende, F. D., Siqueira, G. R. & Oliveira, I. M.) 173–182 (Gráfica Multipress LTDA, 2018).
26. Hopkins, W. G. A scale of magnitudes for effect statistics. in A New View of Statistics (eds. Hopkins, W. G.) http://www.sportsci.
org/resource/stats/effectmag.html (2002). Accessed 31 Aug 2020.
27. Sollenberger, L. E., Coleman, S. W. & Vendramini, J. M. B. As interações entre plantas e herbívoros em pastagens. in Forragicultura
– Ciência, Tecnologia e Gestão de Recursos Forrageiros (eds. R. A. Reis, T. F. Bernardes, & G. R. Siqueira) 69–80 (Maria de Lourdes
Brandel, 2013).
28. Ambriz-Vilchis, V., Jessop, N. S., Fawcett, R. H., Shaw, D. J. & Macrae, A. I. Comparison of rumination activity measured using
rumination collars against direct visual observations and analysis of video recordings of dairy cows in commercial farm environ-
ments. J. Dairy Sci. 98, 1750–1758. https://doi.org/10.3168/jds.2014-8565 (2015).
29. Halachmi, I., Edan, Y., Moallem, U. & Maltz, E. Predicting feed intake of the individual dairy cow. J. Dairy Sci. 87, 2254–2267.
https://doi.org/10.3168/jds.S0022-0302(04)70046-6 (2004).
30. Kilkenny, C. et al. Improving bioscience research reporting: the ARRIVE guidelines for reporting animal research. PLoS Biol. 8,
e1000412. https://doi.org/10.1371/journal.pbio.1000412 (2010).
31. Cardoso, A. S. et al. Intensification: a key strategy to achieve great animal and environmental beef cattle production sustainability
in Brachiaria grasslands. Sustainability 12, e-6656. https://doi.org/10.3390/su12166656 (2020).
32. Watanabe, N., Sakanoue, S., Kawamura, K. & Kozakai, T. Development of an automatic classification system for eating, ruminating
and resting behavior of cattle using an accelerometer. Grassl. Sci. 54, 231–237. https://doi.org/10.1111/j.1744-697X.2008.00126.x
(2008).
Scientific Reports | (2022) 12:2654 | https://doi.org/10.1038/s41598-022-06650-5 9
Vol.:(0123456789)www.nature.com/scientificreports/
33. Hughes, G. P. & Reid, D. Studies on the behaviour of cattle and sheep in relation to the utilization of grass. J. Agric. Sci. 41, 350–366.
https://doi.org/10.1017/S0021859600049534 (1951).
34. Martín, P. & Bateson, P. Measuring Behaviour: An Introductory Guide 3rd edn. (Cambridge University Press, 2007).
35. Barbero, R. P. et al. Supplementation level increasing dry matter intake of beef cattle grazing low herbage height. J. Appl. Anim.
Res. 48, 28–33. https://doi.org/10.1080/09712119.2020.1715985 (2020).
36. R Core Team. R: A language and environment for statistical computing. Viena: R Foundation for Statistical Computing. http://
www.Rproject.org/ (2020). Accessed 04 Oct 2020.
37. Rencher, A. C. & Schaalje, G. B. Linear Models in Statistics 2nd edn. (Wiley, 2008).
38. Koscheck, J. F. W. et al. How do animal performance and methane emissions vary with forage management intensification and
supplementation?. Anim. Prod. Sci. 60, 1201–1209. https://doi.org/10.1071/AN18712 (2020).
39. Allen, D. M. Mean square error of prediction as a criterion for selecting variables. Technometrics 13, 469–475. https://doi.org/10.
1080/00401706.1971.10488811 (1971).
40. Seal, H. L. Multivariate Statistical Analysis for Biologists (Mathuen Young Books, 1964).
41. Jeffers, J. N. R. An Introduction to System Analysis: With Ecological Applications (Edit Arnold Publication, 1978).
Acknowledgements
The authors thank the members of UnespFor (Unesp Jaboticabal-SP Forage Team) and EAGMA (Unesp Jabot-
icabal-SP) for their contributions during the field trial setup. I acknowledge with thanks the National Council
for Technological and Scientific Development, for the scholarship for myself, in the form of a postdoctoral
grant (CNPq; grant number 150985/2019-3); and the São Paulo Research Foundation (FAPESP, grant numbers
2015/16631-5 and 2018/20753-7), for funding this research.
Author contributions
E.P.R., R.N.W., P.A.B. and D.P.M. contributed with computational analysis and concept this project. D.P.M. and
R.A.R. contributed with financial support from different research funding. E.P.R., N.V.B.F., A.S.B., T.R.B. and
R.N.W. contributed with field trial setup. E.P.R., R.N.W., P.A.B., D.P.M.; and R.A.R. contributed with results
interpretation, draft, and wrote the manuscript. All authors read and approve the final version of the manuscript.
Funding
This study was funded by grants from CNPq (150985/2019-3) and FAPESP (2015/16631-5 and 2018/20753-7).
Competing interests
The authors declare no competing interests.
Additional information
Supplementary Information The online version contains supplementary material available at https://doi.org/
10.1038/s41598-022-06650-5.
Correspondence and requests for materials should be addressed to E.P.R.
Reprints and permissions information is available at www.nature.com/reprints.
Publisher’s note Springer Nature remains neutral with regard to jurisdictional claims in published maps and
institutional affiliations.
Open Access This article is licensed under a Creative Commons Attribution 4.0 International
License, which permits use, sharing, adaptation, distribution and reproduction in any medium or
format, as long as you give appropriate credit to the original author(s) and the source, provide a link to the
Creative Commons licence, and indicate if changes were made. The images or other third party material in this
article are included in the article’s Creative Commons licence, unless indicated otherwise in a credit line to the
material. If material is not included in the article’s Creative Commons licence and your intended use is not
permitted by statutory regulation or exceeds the permitted use, you will need to obtain permission directly from
the copyright holder. To view a copy of this licence, visit http://creativecommons.org/licenses/by/4.0/.
© The Author(s) 2022
Scientific Reports | (2022) 12:2654 | https://doi.org/10.1038/s41598-022-06650-5 10
Vol:.(1234567890)You can also read