A Survey of e-Biodiversity: Concepts, Practices, and Challenges
←
→
Page content transcription
If your browser does not render page correctly, please read the page content below
A Survey of e-Biodiversity: Concepts, Practices, and
                                                                               Challenges
                                                        Luiz M. R. Gadelha Jr.1∗    Pedro C. de Siracusa1     Artur Ziviani1
                                                                       2                        2
                                                  Eduardo Couto Dalcin       Helen Michelle Affe      Marinez Ferreira de Siqueira2
arXiv:1810.00224v1 [q-bio.PE] 29 Sep 2018

                                                                                 2
                                                  Luís Alexandre Estevão da Silva      Douglas A. Augusto3     Eduardo Krempser3
                                                                     Marcia Chame3         Raquel Lopes Costa4
                                                                   Pedro Milet Meirelles and Fabiano Thompson6
                                                                                        5

                                                                            1
                                                                                National Laboratory for Scientific Computing, Petrópolis, Brazil
                                                                                    2
                                                                                      Rio de Janeiro Botanical Garden, Rio de Janeiro, Brazil
                                                                                        3
                                                                                          Oswaldo Cruz Foundation, Rio de Janeiro, Brazil
                                                                                       4
                                                                                         National Institute of Cancer, Rio de Janeiro, Brazil
                                                                                           5
                                                                                             Federal University of Bahia, Salvador, Brazil
                                                                                 6
                                                                                   Federal University of Rio de Janeiro, Rio de Janeiro, Brazil

                                                                                                           Abstract
                                                         The unprecedented size of the human population, along with its associated economic activities, have an
                                                    ever increasing impact on global environments. Across the world, countries are concerned about the growing
                                                    resource consumption and the capacity of ecosystems to provide them. To effectively conserve biodiversity,
                                                    it is essential to make indicators and knowledge openly available to decision-makers in ways that they can
                                                    effectively use them. The development and deployment of mechanisms to produce these indicators depend
                                                    on having access to trustworthy data from field surveys and automated sensors, biological collections, molec-
                                                    ular data, and historic academic literature. The transformation of this raw data into synthesized information
                                                    that is fit for use requires going through many refinement steps. The methodologies and techniques used to
                                                    manage and analyze this data comprise an area often called biodiversity informatics (or e-Biodiversity). Bio-
                                                    diversity data follows a life cycle consisting of planning, collection, certification, description, preservation,
                                                    discovery, integration, and analysis. Researchers, whether producers or consumers of biodiversity data, will
                                                    likely perform activities related to at least one of these steps. This article explores each stage of the life cycle
                                                    of biodiversity data, discussing its methodologies, tools, and challenges.

                                            1      Introduction
                                            Humanity is increasingly influencing global environments [195]. In many countries, it has raised govern-
                                            mental concern about the unbalance between resource consumption by these activities and the capacity of
                                            ecosystems to provide resources. This unbalance has resulted, for instance, in loss of forest cover in many
                                            places, extinction of species, and decreased availability of fresh water. Humans rely on ecosystem services
                                            in various activities. These services, such as food and water, are a result of processes that occur within
                                            these ecosystems. Various studies show that there is a strong relationship between human activities, global
                                            changes, biodiversity, ecosystem processes, and ecosystem services. Chapin et al. [58] observe that biodiver-
                                            sity variables, such as the number of species present, the number of individuals of each species, and which
                                            species are present, along with the types of interactions (e.g. trophic, competitive, symbiotic) that are taking
                                            place between these species, determine the species traits that affect ecosystem processes. These traits can
                                                ∗ E-mail   address: lgadelha@lncc.br

                                                                                                              1
be defined as characteristics or attributes of species that are expressed by genes or affected by the environ-
ment. They also observe that global changes, often triggered by humans, such as invasive species, increased
atmospheric carbon dioxide, and land-use change can significantly alter these biodiversity variables and,
consequently, the expression of species traits. This, in turn, affects ecosystem processes and their resulting
services, which can have negative impacts on human development. Changes in these ecosystem services that
are due to changes in biodiversity can sometimes be non-linear and stochastic, which can pose a significant
risk to humans. Similar conclusions have been reached in other surveys on the relationship between biodi-
versity, ecosystem functioning, and ecosystem services [53, 143]. Cardinale et al. [53] observe that after a
species become extinct, the resulting changes to ecological processes strongly depend on which traits were
eliminated. Hooper et al. [143] observe that biodiversity loss is as significant to ecosystem change as the
direct effects of global changes, such as elevated carbon dioxide in the atmosphere and ozone depletion.
This, in turn, affects critical ecosystem services for the local population, such as food production, air quality,
and fresh water.

                                                          Water
                                                                               ...                Pest control

                                                          Food                                    Recreation

                                    Human Activities                     Ecosystem Services

                                    Global Changes                      Ecosystem Processes

                  Increased CO2                        Species evenness                       Species richness
                   in atmosphere

                                                       Species interactions               Species composition
                  Land-use change

                       ...                                     ...                                 ...

           Figure 1: Relationship between global changes and biodiversity (modified from [58]).

    A major effort to address the problem was started in 1992 during the Earth Summit in Rio de Janeiro
with the signature of the Convention on Biological Diversity (CBD) [56], a legally-binding international
treaty. Its main objectives are the conservation of biodiversity, including ecosystems, species, and genetic
resources, and their sustainable and fair use. Countries are required to elaborate and execute a strategy for
biodiversity conservation, known as a National Biodiversity Strategy and Action Plan (NBSAP), and to put in
place mechanisms to monitor and assess the implementation of this strategy. They should periodically report
their progress on implementing their NBSAPs. Brazil, for instance, has advanced considerably in the cre-
ation of protected areas but recent expansion of agribusiness, mining, and hydroelectric power projects have
threatened these advances [94]. The Strategic Plan for Biodiversity 2011-2020 defines actions to be taken by
countries to achieve a set of twenty targets by 2020, known as the Aichi Biodiversity Targets. It should be
observed that the United Nations General Assembly declared 2011-2020 the United Nations Decade on Biodi-
versity. In 2012, Intergovernmental Platform on Biodiversity and Ecosystem Services (IPBES) was created to
allow for closer cooperation between scientists and policy makers on assessing the status of biodiversity and

                                                          2
ecosystem services and their relationship.
    To meet targets on biodiversity conservation, Balmford et al. [19] observe that it is essential to make
indicators and knowledge openly available to decision-makers in ways that they can effectively use them.
The Group on Earth Observations Biodiversity Observation Network (GEO BON) proposed a set of twenty-two
Essential Biodiversity Variables (EBVs) [211, 221] that should allow for monitoring and evaluating biodiversity
change. The development and deployment of mechanisms to produce these indicators depend on having
access to trustworthy data from field surveys and automated sensors, biological collections, molecular data,
and historic academic literature. Peterson [215], however, shows that there are information gaps across
thematic and geographical areas, suggesting that there should be funding and training for institutions and
personnel working on biodiversity analysis to allow for evaluating EBVs globally. The transformation of raw
data into synthesized data that is fit for use requires going through many refinement steps. One should
assess its quality [59] by evaluating its taxonomic, geographical, and temporal accuracy. In many cases, the
geographic coverage of the data is limited requiring, for instance, the use of species’ distribution models [218]
to estimate the likelihood of a particular species to occur in some geographic region. The methodologies and
techniques used to manage and analyze this data comprise an area often called biodiversity informatics (or
e-Biodiversity) [34, 248, 117, 124, 138, 156]. Guralnick and Hill [117], for instance, propose the concept
of a global biodiversity map that would record global patterns of biodiversity and how they change over
time, derived various data sources such as remote sensing, biodiversity literature, biological collections, and
DNA sequence databases. On top of such map, various analyses, such as species richness and distributions,
can be periodically updated using most recent data. Hardisty et al. [124] recently gathered requirements
for biodiversity informatics systems. They include, for instance, an aggregator for taxonomic names that
integrates the distinct existing checklists; the use of persistent identifiers to reference datasets, scientific
workflows, and scientists; use of linked data and ontologies to enable integrating data on different aspects of
biodiversity; advancing data quality and fitness-for-use evaluation methodologies.
    In this survey, we give an overview of this research area covering its main concepts, practices, and some
of the existing challenges. According to the approach proposed in [183], biodiversity data follows a life cycle
consisting of the following stages: planning, collection, certification, description, preservation, discovery, in-
tegration, and analysis. It is worth noting that after the analysis activity, new biodiversity data management
cycles may be triggered as a result. In this survey, we group these steps in two main stages: data management
and analysis and synthesis. Such steps are illustrated in Figure 2. Researchers, whether producers or con-
sumers of biodiversity data will likely perform activities related to at least one of these steps. The remainder
of this article addresses each stage of the life cycle of biodiversity data, describing their methodologies, tools,
recommendations, and challenges.
    In Table 1, we provide an overview of various tools and databases surveyed along with which steps of the
e-Biodiversity life cycle they approach. In Table 2, we describe computational techniques used in each step
of the e-Biodiversity life cycle that will be explored in this work.
    Throughout this work, we use definitions from the International Code of Nomenclature for algae, fungi
and plants (ICN) [176]. This document outlines a set of rules and guidelines for scientifically naming and
grouping plants, fungi, and algae, consisting of a universally adopted reference by the botanical scientific
community. Nomenclature best-practices for other groups of organisms are governed by other (though simi-
lar) documents.
    Within the domain of biology, taxonomy is, in a general sense, the science of classification of organisms.
Organisms are classified according to their shared characteristics and grouped at distinct levels of specificity
(or taxonomic ranks) using a hierarchical system, in which groups that are more specific are nested within
broader ones. A taxonomic rank refers to the level of the taxonomic hierarchy at which a group of organisms
is defined. The most relevant ranks adopted in botany (in descending hierarchical order) are Kingdom,
Phylum (or Division), Class, Order, Family, Genus, Species. The taxonomic resolution of a biological sample is
the rank of the most specific taxonomic determination that has been assigned to it. For instance, if a sample
has been determined up to the level of species, this rank is also its taxonomic resolution. As taxa relate to
each other in a tree-like hierarchical structure (with each child taxon having exactly one parent, while a
parent taxon can have one or more children), taxonomic identities of a specimen at ranks higher than its
resolution can be directly determined. Although this term is not included in the ICN document, we use this

                                                        3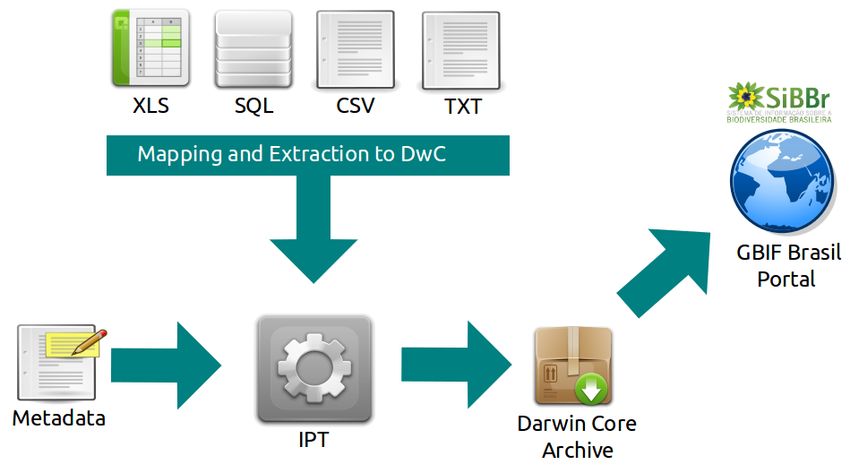
Table 1: A selection of e-Biodiversity databases and tools classified according to target life-cycle step: data
planning and collection (DC), data quality and fitness-for-use (DQ), data description (DD), data preservation
and publication (DP), data discovery and integration (DI), and computational modeling and data analysis
(CM).

                     Tool or database name       Reference   DC   DQ   DD   DP   DI   CM
                     DMPTool                     [261]       X
                     Morpho                      [134]       X    X    X    X
                     Metacat                     [30]        X    X    X    X    X
                     Catalogue of Life           [231]       X    X    X    X    X
                     BHL                         [120]       X    X    X    X    X
                     eBird                       [263]       X    X    X    X    X
                     eMammal                     [129]       X    X    X    X    X
                     Brazilian Flora 2020        [98]        X    X    X    X    X
                     BRAHMS                      [95]        X    X    X    X    X
                     Jabot                       [242]       X    X    X    X    X
                     MorphoBank                  [201]       X    X    X    X    X
                     BaMBa                       [178]       X    X    X    X    X
                     Atlas of Living Australia   [26]        X    X    X    X    X    X
                     speciesLink                 [50]        X    X    X    X    X    X
                     GenBank                     [27]        X    X    X    X    X    X
                     MG-RAST                     [181]       X    X    X    X    X    X
                     BOLD                        [222]       X    X    X    X    X    X
                     iPlant                      [110]       X    X    X    X    X    X
                     VoSeq                       [208]       X    X    X    X    X    X
                     SISS-Geo                    [57]        X    X    X    X    X    X
                     BioGeomancer                [118]            X
                     Taxamatch                   [224]            X
                     Geospatial Data Quality     [200]            X
                     TNRS                        [42]             X
                     Kurator                     [190]            X
                     BioVel                      [125]            X              X    X
                     EU-Brazil OpenBio           [11]             X              X    X
                     Model-R                     [232]            X              X    X
                     GGBN                        [84]             X    X         X
                     BioCollections              [239]            X    X         X
                     GBIF                        [86]             X    X    X    X
                     DataONE                     [182]            X    X    X    X
                     OBIS                        [113]            X    X    X    X
                     SiBBr                       [22]             X    X    X    X
                     IPT                         [229]                 X    X
                     Scratchpads                 [247]                      X    X    X
                     WholeTale                   [44]                            X    X
                     Maxent                      [218]                                X
                     ConsNet                     [66]                                 X
                     OpenModeller                [252]                                X
                     SPAdes                      [20]                                 X
                     SAHM                        [189]                                X
                     HipMer                      [107]                                X
                     SUPER-FOCUS                 [241]                                X

                                                         4
Figure 2: Biodiversity Life Cycle.
definition throughout this text. A taxon is a taxonomic group of organisms at the level of any rank, which
are considered by professional taxonomists to form a taxonomic unit. Species is one of the taxonomic ranks
in which organisms can be classified. It is regarded to be a basic unit of taxonomic classification, although
organisms can be further classified in lower-hierarchy taxonomic ranks (i.e., infraspecific ranks). Differently
from other ranks, the name of a species is composed using a binomial nomenclature system, composed of
the name of the genus followed by a specific epithet, e.g. Caryocar brasiliense, Myrcia guianensis, or Solanum
lycocarpum.
When botanists sample organisms in the field, they either collect part of the organism (e.g. a branch
of a tree), the entire organism, or multiple individuals of the same type. Any of these collected biological
materials is an evidence of the existence of a particular organism at some place and time and should be
properly deposited in a biological collection for being preserved as a reference. A specimen is defined as one
such evidence and refers to a punctual observation of a single kind of organism. Although a specimen could
be classified by a taxonomist as being a representative of a given species, this is not a requirement for it to be
included in scientific collections. Although taxonomists classify specimens in a best effort manner (the most
taxonomically precise as possible), sometimes only higher ranks can be determined. The highest taxonomic
rank at which the specimen could be identified is known as its taxonomic resolution. After properly deposited
in a biological collection, each record receives a taxonomic identification that assigns the individual to a
taxon.
Physical specimens stored in biological collections (also referred to as vouchers) are often associated with
complementary information, either annotated by the responsible collectors during the collecting act; or an-
5Table 2: Computational techniques used in the e-Biodiversity life cycle: string processing (SP), metadata
management (MD), conceptual modeling (CM), semantic web (SW), deep learning (DL), machine learning
(ML), statistics (ST), geographical information systems (GS), graph theory (GT), parallel and distributed
computing (PD), web services (WS).
e-Biodiversity life cycle step SP MD CM SW DL ML ST GS GT
Data Planning and Collection X X
Data Quality X X X X
Data Description X
Data Publication X
Data Discovery and Integration X
Ecological Niche Modeling X X X X
Biodiversity Networks X
Biodiversity Genomics X X X X
Wildlife Health Analysis X X X X
notated at later stages, after the specimen is deposited in the collection [59]. Information from the collection
event include the date, time, and the geographic location where the specimen was collected; the names of
the collectors who were involved in the collection event; and eventual field notes describing contextual re-
marks, such as weather conditions, habitat features, or the sampling method used. Another crucial piece of
information is the taxonomic identity of the specimen, which can be determined by the collectors themselves
or by professional taxonomists once the biological material is incorporated to the collection (although some
materials eventually remain unidentified).
The taxonomic identity of a specimen includes not only the taxon name assigned to the sample, but also
its nomenclatural status and authorship, the name of the person who has provided the identification, and in
some cases, information regarding the certainty of identification. As the taxonomic identity of a specimen
can be re-evaluated by specialists several times after the first determination (though it requires that the
investigator has access to the physical specimen), a history of determinations for specimens is usually stored
in a collection. Vouchered specimens, together with their associated data, is what scientifically testifies a
punctual observation of a species by a collector, at some location and at some point in time, and is thus
referred to as a species occurrence.
e-Biodiversity, or mainly known as “Biodiversity Informatics”, relates to the use of information technology
(IT) to support the needs of understanding biodiversity, by organizing knowledge about individual biolog-
ical organisms and the ecological systems they form. Over time, biodiversity informatics will deliver an
increasingly interconnected digital resource supporting scientific research of the natural world [138]. The
application of IT to support biodiversity research starts during the 1960s, tackling mainly two different as-
pects: handling scientific collections in museums and botanic gardens, and providing a fundamental tool for
the development of the Numerical Taxonomy [212, 290, 243, 246, 250, 171, 251, 254, 230, 74, 234]. In
the 1970’s the use of computer to produce identification keys was explored [122], along with the expansion
of their use in the management of herbarium records [31, 276, 280]. In the same decade, we also have the
initiative of the Flora of North America Program to “create a computer data bank of taxonomic information
about the vascular plants of North America north of Mexico.” [154]. The decade of the 1980’s is considered
the “golden era” of the biodiversity informatics, characterized by a significant intellectual and bibliographic
productivity and the sharing of ideas in scientific events. As result, iconic publications come to light, such as
[7, 1].
In 1985, the foundations of a key organization in the development of the biodiversity informatics were
launched: The Taxonomic Database Working Group (TDWG). The first meeting of TDWG was held at the
Conservatoire et Jardin Botaniques, in Geneva, from 28th to 30th September 1985. In the first meetings, it
became clear the need for elements of standardization for taxonomic databases and means for data exchange
[266, 36]. In the same decade, we have witnessed the emergence of the first standards for data transfer
[147, 281, 36, 70] and the establishment of the first institutional databases and information systems, such as
6“TROPICOS, run by the Missouri Botanical Garden; ILDIS, an international system covering legumes; BONAP,
the Biota of North America Program; and CITES, Cactaceae list run at the Royal Botanic Gardens Kew. For
microorganisms the impetus seems to have come from the culture collections and information industry; both
BIOSIS and DSM (Deutsche Sammlung von Microorganismen und Zellkulturen) have established master lists
for bacteria and others are available for yeasts and certain fungi” [35].
At the end of the 1980s and beginning of the 1990s, the efforts for modeling taxonomic databases un-
der the nomenclature rules and the dynamic of the classification became the concern of some researchers
[24, 204, 8, 9, 137]. It is important to notice that it was during this period that small computers became
more popular and affordable, added to the availability of database software and high-level programming lan-
guages, which made possible the creation of experimental databases dedicated to floristic and monographic
data, as also morphological and chemical data, among others [7]. In September 1990, an interdisciplinary
workshop, organized by University of California and funded by NSF, united different professionals to discuss
the benefits of modern computer techniques - expert workstation for systematics, identification, phylogenetic
trees, databases, and geographical information systems – for systematic biology [97]. In October 1990, a
symposium called “Designs for a Global Plant Species Database”, held in Delphi, Greece, focused in dis-
cussing different approaches for “creating and operating a global plant species information system – a data
system that would provide international access to data accumulated on all of the world’s plants.” [35].
In 1992, the CBD, in its article 7, item D, says: “Maintain and organize, by any mechanism data, derived
from identification and monitoring activities pursuant to subparagraphs (a), (b) and (c) above.” In the same
convention, the article 17 was dedicated to the “Exchange of Information”, evocating the parties to facilitate
the exchange of information of “technical, scientific and socio-economic research, as well as information on
training and surveying programmes, specialized knowledge, indigenous and traditional knowledge as such
and in combination with the technologies referred to in Article 16, paragraph 1. It shall also, where feasi-
ble, include repatriation of information” [56]. This convention becomes the cornerstone of the Biodiversity
Informatics area, coining its name as the result of the affiliation between five agencies, forming the “Cana-
dian Biodiversity Informatics Consortium”, to implement the CBD in Canada [32]. In 1999, a new milestone
was set with the findings of the final report of the OECD Megascience Forum - Working Group on Biological
Informatics, which understood that “An international mechanism is needed to make biodiversity data and
information accessible worldwide”, and “recommends that the governments of OECD countries establish and
support a distributed system of interlinked and interoperable modules (databases, software and networking
tools, search engines, analytical algorithms, etc.) that together will form a Global Biodiversity Information
Facility (GBIF)” [32]. In September 2000 “Bioinformatics for Biodiversity” reached notoriety becoming cover
of a special issue of the Science Magazine, consolidating itself as an area of research [262]. In 2004, the
Global Biodiversity Information Facility (GBIF), an Internet-accessible interoperable network of biodiversity
databases and information technology tools - went online with a prototype data portal1 for simultaneously
accessing data from the world’s natural history collections, herbaria, culture collections, and observational
databases [86]. In July 2012, around 100 experts from a wide variety of disciplines gathered in Copenhagen
to the Global Biodiversity Informatics Conference (GBIC). The conference sets out a framework - The Global
Biodiversity Informatics Outlook, launched in October 2013, to harness the immense power of information
technology and an open data culture to gather unprecedented evidence about biodiversity and to inform
better decisions [138].
The remaining of this article is organized as follows. In section 2, we describe the main steps of managing
biodiversity data, including the tasks involved in planning and collecting biodiversity data (subsection 2.1),
data quality and fitness-for-use issues in biodiversity (subsection 2.2), the main metadata standards and tools
for biodiversity (subsection 2.3), the standards, tools, and systems that support publishing and preserving
biodiversity data (subsection 2.4), and techniques used to integrate biodiversity data from different sources
and for discovering it (subsection 2.5). In section 3, we discuss existing tools for analysis and synthesis of
biodiversity data, including computational models and areas of application. Finally, in section 4, we conclude
the survey by presenting some of the current challenges of managing and analyzing biodiversity data.
1 http://www.gbif.org
72 Data Management
From planning and collecting biodiversity data to making it fit-for-use there are many steps that need to
be followed, including data planning and collection, data quality and fitness-for-use, data description, data
preservation and publication, and data discovery and integration. These steps comprise a biodiversity data
management life-cycle, Figure 2 (top-right), that we present in this section.
2.1 Data Planning and Collection
The various steps of the biodiversity life cycle usually comprise a Data Management Plan (DMP) [183] of
biodiversity research activities. Some research funding agencies in countries like the United States require
the submission of a DMP in submissions to calls for research proposals. Many funding agencies require
that proposals should include a data management plan. A DMP is usually comprised of: which data will be
collected; which formats or standards will be used for this data; which metadata will be provided and in
which standard or format; what are the policies for data usage and sharing; how data will be stored and
how it will be preserved in the long-term; and how data management will be funded. The DMP Tool2 , for
instance, is an online tool that supports designing and implementing a data management plan.
Biodiversity is concerned with the variety of living organisms, which can be measured in many different
ways and scales, from a record of an organism observed in a geographical location at a particular date (a
species occurrence) [288] to the relative abundance of species in a water sample collected at a long-term
ecological research site [184]. Omics also present many opportunities for exploring biodiversity. Molecular
data from environmental samples [286, 228], for instance, can be analyzed in metagenomics studies to
identify functional traits and the taxonomic classification of organisms present. Biodiversity data can be
collected in various ways: biosensor networks, field expeditions, observations made by citizen scientists,
among others. In the collection process, it is important to use unique identifiers for project, sampling event,
sampling area, and protocol used [259]. These identifiers will later allow the data collected to be stored in
biodiversity databases consistently. Whenever possible, the terms should follow a controlled vocabulary or
ontology, such as the Biodiversity Collections Ontology (BCO) [279]. Next, we list common sources of data
that are used to describe and analyze biodiversity:
• Species Occurrences. Species occurrences are one of the most frequently available types of data
concerning biodiversity. The main attributes of a species occurrence are given by: a taxon, which
is defined as a group of one or more populations of an organism or organisms that form a unit; a
location; and a date of occurrence. Species occurrence records originate from different sources. In
order to facilitate the management and improve the accessibility of such information, most institutions
currently maintain it organized in digital spreadsheets or in relational database systems, while also
keeping references to the physical specimens they refer to. Some institutions are even deploying efforts
towards digitizing the physical specimens. Hardisty et al. [124] observe that only about 10% of natural
history collections are digitized and that tools are required to accelerate the process. In addition to
specimens from biological collections, human observations are another source of species occurrences
records. These observations take place, for instance, during field expeditions or even through citizen
science initiatives (eBird [263], iNaturalist3 ). In some cases, species are maintained in the culture of
living organisms, as is the case of various collections of fungi and other organisms.
• Species Checklists. Surveys are often performed within a geographic region, such as a continent [272],
a country, or a national park, to determine which species are present in them. These surveys usually
result in a list of taxon names called a species checklist. They might also be restricted to a particular
kingdom or biome. Forzza et al. [98], for instance, describe how the Brazilian Flora List published in
2010 was assembled, which involved aggregating information about species vouchers from herbarium
2 https://dmptool.org/
3 http://www.inaturalist.org
8information systems and having taxonomists to review it. The Catalogue of Life4 aggregates more than
100 species checklists and contains information of about 1.6 million species.
• Sample-based and Observational Data. Sample-based data is collected during events, which may
be one-time or periodical, typically involves environmental data and has a wide range and diversity
of measurements. They may involve, for instance, abiotic measurements and population surveys in
different temporal and spatial scales in transects, grids and plots [172]. A typical context in which they
are collected are the Long-Term Ecological Research (LTER) projects [184] projects. Because of the
heterogeneity of ecological data [225], there is not a controlled vocabulary that is widely used. Some
initiatives in this direction include ontologies such as ENVO, OBOE, and BCO [279]. The most common
tools for publishing ecological data rely on metadata to describe tabular datasets that comprise them.
Such metadata allows general information, such as dataset owner identification, geographic, temporal,
and taxonomic coverages, to be recorded, facilitating their interpretation by users. Metadata also allows
textually describing the meaning of each column of a tabular dataset. Later in this article, the Ecological
Metadata Language [93], a metadata standard for ecological datasets, will be described.
• Molecular Data.
The analysis of DNA, RNA and proteins have various applications to the study of biodiversity. The ge-
nomic sequences obtained directly from environmental samples containing communities of microorgan-
isms, i.e. metagenomes [228], for instance, provide important information to analyze their taxonomic
and functional characteristics. Biological sequences can support taxonomists as well [265] in identi-
fying species. Taxonomists can also use small genomic or gene regions to assess biological diversity
accross all domains of life. The Barcode of Life [222, 258] project, for example, analyzes and standard-
izes small regions of genes to help in identifying species. Some systems, such as VoSeq [208], allow for
connecting vouchers present in biological collections to DNA sequences present in genomic databases.
Guralnick and Hill [117] observe that diversity can be more precisely measured, when compared to
simply counting the number of species, by how species are phylogenetically related. As examples, they
assess conservation priority of North American birds using their phylogenetic distinctness and extinc-
tion risk and analyze the dispersal of the influenza A virus also using phylogenetic analysis.
• Academic Literature. A vast amount of information about the biodiversity is available in the academic
literature. Field expeditions syntheses are often available only in scientific papers. Data related to sam-
pling, collection, and their analysis have often not been propagated to biodiversity databases. Some
initiatives, such as the Biodiversity Heritage Library (BHL) [120], aim to use technologies, such as op-
tical character recognition, to extract this information from scientific articles and make them available
in public databases.
• Images and Videos. Field expeditions to conduct sampling often involve the production of images
and videos that support the analysis of the studied sites. In the following sections, we describe
Audubon Core5 , a controlled vocabulary for describing multimedia resources associated with sampling
and species occurrence data.
• Remote Sensing. According to Turner et al. [271], most remote-sensing instruments do not have
enough resolution to gather information about organisms but there were advances that enabled some
aspects of biodiversity to be observed, such as differentiating species assemblages and tree species
[67]. They also argue that, when instrument resolution is insufficient for direct observation, indirect
methods can be applied to estimate species distributions and richness. Pettorelli et al. [217] observe
that many EBVs could be derived from satellite remote sensing, which can provide global-scale regular
monitoring. Some of these potential EBVs include, for instance, vegetation height and leaf area index.
It is also observed that raw satellite data could be processed by scientific workflows, including tasks
such as statistical analysis and classification algorithms, to generate EBVs.
4 http://www.catalogueoflife.org
5 https://terms.tdwg.org/wiki/Audubon_Core
92.2 Data Quality and Fitness-for-Use
Although biodiversity scientists have undoubtedly benefited from open access to massive volumes of species
occurrence data from many biological collections, there are some caveats that must be accounted for, before
using data for modeling. Data is not always adequate for investigating every aspect of natural systems,
using inadequate data for studying specific aspects of biological diversity can lead to erroneous or misleading
results [59], and investigators must be aware of the inherent limitations of their data before formulating
their questions. The availability of detailed information is still very scarce for most known organisms. This
scenario, referred to as the Wallacean Shortfall [169], is even more critical in megadiverse countries, which
still remain largely unexplored for many regions and taxonomic groups [248]. The lack of sufficient data for
threatened species is even more concerning, as designing effective programs for their conservation require
knowledge on their geographic distribution and ecological requirements. This shortage of data, combined
with the non-systematic sampling and insufficient quality limits the use of data from biological collections
for many intended applications, many of which require an intensive amount of data to be available [115].
Failing to account for the inherent limitations of such data while posing and investigating their hypotheses,
researchers may obtain erroneous or misleading results, eventually impacting the success of management
policies that rely on such information [59].
A definition for data quality based on its fitness for the intended use was first proposed in the context
of geographical information systems [65], and became widely adopted by the biodiversity informatics com-
munity. According to this definition, quality is not an absolute attribute of a dataset but is rather given by
its potential to provide users with valuable information, in specific contexts. Assessing quality attributes of
data is a fundamental step for any applications that might use it, and requires that users previously delimit
the purpose, scope, and requirements of their investigation. Data is considered to be of high quality if it is
suitable for supporting a given investigation. Depending on the application, users might need to improve the
fitness of the data they have in hand, which is part of the data quality management process. Loss of qual-
ity in biodiversity data can occur during multiple stages of its life cycle [59], including the moment of the
recording event, its preparation before it is incorporated in the collection, its documentation, digitalization,
and storage. Soberón and Peterson [248] list common issues regarding biodiversity data quality. Specimens
of biological collections, from which a considerable amount of species occurrence data is extracted, may have
incorrect or outdated taxonomic identifications. Biological taxonomy is constantly changing to accommodate
new knowledge about species. It is also possible that there are georeferencing errors due to annotation error
or instrument inaccuracy. In old records, due to the unavailability of mechanisms for accurate assessment of
location, it is common to find only textual descriptions about where a specimen was collected.
One important aspect that often limits the usability of primary data from biological collections concerns
the way in which it is gathered in the field. In general, most species occurrence data composing biological
collections derive from exploratory field expeditions, in which organisms are recorded in a non-systematic
observational fashion by different collectors, using different methods and at distinct circumstances (though
records resulting from experimental studies are eventually incorporated in museums as well). As a result,
the distribution of the sampling effort in such datasets is uneven and rarely quantified, leading to sampling
biases. Building models without accounting for biases in data has been observed to strongly impact their per-
formance, leading to spurious results which can be misinterpreted and, ultimately, lead to wrong decisions.
For instance, assessing patterns of species richness from species occurrence datasets has been shown to be
particularly challenging due to geographical bias in data [144, 223], as higher diversities tend to be observed
at more accessible sites due to higher sampling effort. As defined by [64], biases are uniform shifts in mea-
sured values, resulting from systematic errors that are introduced by some measurement system. They are
expressed as unrealistic tendencies in data, and can usually be mitigated with the adoption of random sam-
pling designs. Sampling bias in biodiversity data can be classified into several distinct categories, depending
on the aspect of data under investigation [76].
Not all taxa are quantitatively represented in biological collections in the same proportions as they occur
in natural systems leading to taxonomic bias. Collection sites are not randomly selected in geographic space,
nor they are all sampled to the same extent. As features of the landscape make some areas more accessible for
collection activities than others [135], geographic bias arises as a consequence of non-uniform collecting effort
10in geographic space. Some regions that are more accessible being thoroughly sampled (such as areas near
urban centers, roadsides, and margins of rivers); while others that are more inaccessible, such as rainforests,
being only poorly or not sampled at all. Geographic bias is also observed at broader scales. A compilation of
the representativity of plants in GBIF by [180] has shown that among the most representative countries and
regions are the United States (mainly the west coast), Central America, countries in Europe (including the
Nordic countries), Australia, Japan, and New Zealand. The patterns of the recording activities of collectors
are not uniform over time. Instead, collectors often show preferences towards performing field work in
periods when they can get more productive, have more financial resources, or can find more organisms of
their interests, leading to temporal bias.
One of the objectives of CBD is to establish a global knowledge network on taxonomy [124]. Taxonomic
concepts [28] are often incorrectly modeled in biodiversity databases. Berendsohn [29] developed a concep-
tual database model for the International Organisation for Plant Information covering the different aspects
and concepts that are present in taxonomy. Several tools can be used to reduce or eliminate species misiden-
tification. For instance, official species catalogs are available online for taxon querying, such as the Catalog
of Life, the World Register of Marine Species6 , and the Brazilian Flora Species List [98]. These can be used to
support taxonomic data quality assessment of occurrence records. Most of these catalogs are also accessible
via application programming interfaces (APIs) available via the web, allowing the automation of this type of
assessment with scripts or applications.
Dalcin [75] investigates data quality in taxonomic databases, proposing quality metrics and techniques
for error prevention, detection, and correction. He explores which dimensions are present when evaluating
taxonomic data quality. Accuracy would measure how correct and reliable the data is. Believability is defined
as how true and credible data is. Completeness measures to what extent attributes or data are missing.
Consistency is defined as the absence of contradictions in the data. Flexibility is the capacity of representation
of data to change in order to accommodate new requirements. Relevance is given by how applicable and
helpful data is to a particular task. Timeliness how up-to-date the data is. Some experiments are conducted
on detecting spelling errors in scientific names, which may be caused by insertions, deletions, substitutions,
transpositions, or combination of the previous. Two types of algorithms are applied, phonetic algorithms, such
as Soundex [141], are based on pronunciation similarity. String similarity algorithms, such as Levenshtein
distance [160], were also evaluated. Levenshtein algorithm showed a high incidence of false alarms. Phonetic
algorithms had lower execution time than string-similarity ones. More recently, Rees [224] observes that
taxonomic names can contain errors due to misspelling which can lead to failure in retrieving data. He
proposes Taxamatch, a method for approximate matching of taxonomic names. It uses a modified version
of the Damerau-Levenshtein Distance [278] algorithm for genus and species name matching and a phonetic
algorithm for authority matching. Experiments showed that the method is able to identify close to 100% of
errors in taxon scientific names. [124] observes that there are studies about biodiversity that do not require
naming organisms. For instance, metagenomic studies concentrate on analyzing samples to classify them
according to functional traits identified through sequence alignment with genomic databases. For collections
that have digital images of their specimens available, a promising approach is to use deep learning techniques
[236] to automate species identification [39].
Regarding georeferencing problems, Guralnick [117] mentions the importance of determining the geo-
referencing uncertainty of occurrence records and its impact on the scale at which studies can be performed.
Tools like BioGeomancer [118] and Geolocate7 try to infer what the geographic coordinates of an occurrence
of species from a textual location description. Otegui and Guralnick [200] propose a web API that performs
simple consistency checks in occurrence records, such as coordinates with zero value, disagreeing coordinates
and country identification, and inverted coordinates.
Veiga et al. [274] propose a framework for biodiversity data quality assessment and management that
allows for users to define their data quality requirements and when a particular dataset is fit-for-use in a
standardized manner. Data quality assessment is given by the evaluation of fitness for use of a dataset for some
application. Data quality management is defined as the process of improving the fitness-for-use of a dataset.
6 http://www.marinespecies.org/
7 http://www.museum.tulane.edu/geolocate/
11The framework is given by three main components: DQ Needs, DQ Solutions, DQ Report. DQ Needs supports
the definition of the intended use for a dataset, the respective data quality dimensions, acceptable criteria
for data quality measurements in these dimensions; and activities to improve data quality. DQ Solutions
describe mechanisms that support meeting the requirements defined in the DQ Needs component, such as
tools that implement techniques to improve data quality measurements in some dimension. The DQ Report
component describes the dataset that is being assessed and managed by the framework and assertions on
this dataset describing measurements or amendments applied to it as specified in the other components. The
authors envision a Fitness for Use Backbone that would implement these components and where participants
could share their data quality requirements and tools. More recently, Morris et al. [190] have extended
Kurator [81], a library of data curation scientific workflows, to report data quality in terms of the data
quality framework proposed by Veiga et al. [274].
2.3 Data Description
In the description step, metadata is produced to describe biodiversity data. This metadata is essential for
users to interpret datasets they download. In this section, we describe the standards, practices, and recom-
mendations for documenting and describing biodiversity data.
2.3.1 Ecological Metadata Language
The Ecological Metadata Language (EML) [93] is a metadata standard originally developed for the descrip-
tion of ecological data. It is also used currently to describe datasets about species observations. The standard
has several profiles with their respective fields that can be used to define the attributes of a dataset. A sci-
entific description profile contains fields such as the creator, geographic coverage (geographicCoverage), tem-
poral coverage (temporalCoverage), taxonomic coverage (taxonomicCoverage), and sampling protocol (sam-
pling) used. This profile is used to define attributes of the dataset as a whole.
The data representation profile, through the dataTable entity, allows for describing the attributes of a
tabular dataset. One can define the data types of such attributes, such as dates and numerical values, as well
as their constraints, such as minimum and maximum values. Used together, the scientific description and
the data representation profiles can provide good quality documentation for a dataset, supporting users to
interpret it in a meaningful way. EML metadata is expressed with the XML language, illustrated in Listing 1.
Normally, biodiversity databases provide tools for editing and producing metadata in the EML standard
in a more user-friendly way through a graphical interface. The data repository DataONE [182], for example,
allows users to provide metadata through a graphical tool called Morpho [134]. The same repository has
also a web interface called Metacat [30], which allows for loading tabular ecological data in free format doc-
umented with the EML standard. The EML standard is also used to describe datasets on species occurrences
and sampling events, as will be described in the following section.
2.4 Data Preservation and Publication
In the preservation stage, biodiversity datasets are published in some database, such as DataONE and GBIF,
where they will be available to the scientific community. These databases adopt practices of curation and
management of the data aiming its preservation and availability in the long term. There are several possible
procedures for publication, in this section standards and procedures for loading a set of data to a biodiversity
database will be described. The publication workflow of the main current repositories will also be described.
For better management of biological collections [235], several systems for this purpose have been de-
veloped in the last decades. Among the common features in this category of software are the management
of specimens, control of determination history, taxonomy, images associated with specimens, bibliographic
references, curatorial management activities, user management, reports tracking the evolution of collections,
printing labels in varied sizes and data quality. These systems also have specific controls for the different
types of scientific collections, such as exsicates, bromeliads, DNA, photo library, fruits, fungi, woods, orchids,
seeds, in vitro, living, zoological, conservation, and related materials. Among the main ones are the BRAHMS
12Baseline assessment of mesophotic reefs of West South Atlantic seamounts based on
water quality, microbial diversity, benthic cover and fish biomass data
Fabiano
Thompson
Federal University of Rio de Janeiro
Assistant Professor
\protect\vrule width0pt\protect\href{http://www.microbiologia.biologia.ufrj.brits terms for resource description such as type, modified and license, and complementing them with specific
biodiversity terms, such as catalogNumber and scientificName.
The DwC vocabulary terms are organized as follows. The classes indicate the categories or entities defined
in the standard. Examples of classes are: Event, Location and Taxon. Each class has a set of properties, which
are its attributes. For example, the Location class has attributes such as country and decimalLatitude. Finally,
values can be assigned to properties, such as “Chile”, −33.61 for the country and decimalLatitude properties,
respectively. It is worth noting that it is recommended that, whenever possible, the values come from some
controlled vocabulary, in the case of textual values, or some formatting standard, in case of numerical or
temporal values. For example, species names from some recognized list of species, such as the Catalog of
Life. Table 3 illustrates the representation of species occurrence data with DwC. These records come from a
dataset published through the Brazilian Marine Biodiversity Database (BaMBa) [178] in GBIF12 .
Table 3: Species occurrences represented with DwC.
id eventDate decimalLatitude decimalLongitude scientificName
6 2002-08-01 -20.805828 -37.761231 Alectis ciliaris (Bloch, 1787)
118 2002-08-01 -22.382222 -37.587500 Balistes vetula (Linnaeus, 1758)
141 2002-08-01 -19.848744 -38.134635 Caranx crysos (Mitchill, 1815)
507 2002-08-01 -20.525417 -29.310350 Thunnus obesus (Lowe, 1839)
Normally, a set of data in the DwC format is accompanied by metadata, which is defined in the EML (Eco-
logical Metadata Language) standard [93]. In EML, fields such as the title, authors, geographic and temporal
coverage of the dataset are found, which help users interpret datasets formatted in the DwC standard.
Like relational databases, datasets that follow the DwC format can contain multiple tables that are related
through properties that are common to all of them. Such an organization allows, for example, sample data to
be expressed also in this standard. Tables 2 and 3 illustrate this type of data organization to represent species
sampling. Table 2 contains the sampling events, four in total. The eventId column contains an identifier for
each event. The other columns describe the event date, latitude, and longitude, respectively. Table 3 contains
counts of organisms for each event. The eventId column, describes which event in Table 1 the counts refer to.
For example, the first two rows in the table refer to the event that has identifier 1, which is associated with a
sampling performed on March 18, 2009.
Table 4: Sampling events represented with DwC.
eventId eventDate decimalLatitude decimalLongitude
1 2009-03-18 -20.51 -38.07
2 2009-03-18 -20.57 -34.80
3 2011-02-11 -20.50 -25.35
4 2011-02-11 -20.47 -24.80
Biodiversity datasets formatted with DwC can be published in global-scale biodiversity databases such
as the GBIF [85]. GBIF acts as a central registry and aggregator for datasets published by its national and
organizational nodes using the Integrated Publishing Toolkit (IPT) [229]. The publishing workflow includes
the following steps: (i) mapping the internal representation of biodiversity data to DwC and extracting it;
(ii) adding EML metadata describing the biodiversity data; (iii) packaging both EML metadata and DwC-
formatted data to a Darwin Core Archive (DwC-A); (iv) GBIF and national biodiversity aggregators, such as
the Brazilian Biodiversity Information System (SiBBr) [105, 22], harvest DwC-A and ingest them into their
databases. This process is illustrated in Figure 3.
12 http://www.gbif.org/dataset/1edcfe6d-da55-4d59-b30e-468cd21f8b0b
14Table 5: Species occurrences related to the events in Table 4.
eventId organismQuantity scientificName
1 2 Alectis ciliaris (Bloch, 1787)
1 5 Balistes vetula (Linnaeus, 1758)
2 1 Thunnus obesus (Lowe, 1839)
... ... ...
Figure 3: Data publication using IPT.
Many research groups have tabular data about biodiversity stored in various formats and do not have the
resources to format them according to DwC. Different approaches in ecology, coupled with distinct research
traditions, both in their subdisciplines and in related fields, lead to the production of highly heterogeneous
data. Such data can be, among others, counts of individuals, measures of environmental variables or repre-
sentations of ecological processes. The terminologies used also vary according to the research line, as well as
how to structure the data digitally [150]. The EML metadata standard was also adopted for describing the
ecological datasets. The datasets themselves, due to the heterogeneity, are published in the original format,
through spreadsheets or textual files with values separated by commas. In these cases, Metacat [30] can
support data publication and preservation. It is responsible for receiving, storing and disseminating datasets
of, for example, Long-Term Ecological Research (LTER) [184]. The Brazilian Marine Biodiversity Database
(BaMBa) [178], for instance, was developed to store large datasets from integrated holistic studies, including
physico-chemical, microbiological, benthic and fish parameters. BaMBa is linked to SiBBr and has instances
of both IPT and Metacat, making it possible to publish data using the workflows previously described.
The publication of data, and its consequent preservation, is a contribution to the scientific community as
a whole. The data can be reused by other scientists who can explore them from other points of view. For the
publisher of the data, benefits can also be observed. A recent study [220] shows that articles that provide the
data used in their analyses in public repositories tend to have a larger number of citations. Data publication
and preservation can also be helpful when biological collections are lost due to disasters. In September 2,
2018, there was a catastrophic fire in the Brazilian National Museum, destroying the vast majority of approx-
imately 20 million items in its collections comprising areas such as archeology, anthropology, zoology, and
botany. Many destroyed items belonged to biological collections, including one on invertebrates. Through
data publication on GBIF13 , the museum was able to preserve information about many specimens, 269,660
records were available in September 20, 2018, many of these containing images.
13 https://www.gbif.org/publisher/4205110f-3f0f-40d8-bd0f-2fa71bc827b5
152.4.2 Other Standards
Access to Biological Collection Data (ABCD) provides a common definition for content data from living col-
lections, natural history collections, and observation datasets. It also offers a detailed treatment of provider
rights and copyright statements. In many cases, it defines elements for both highly atomized and less struc-
tured data to encourage potential providers to take part in information networks even if their collection
databases are less atomized or not normalized [116]. Currently, ABCD is used to publish data, for instance,
in GBIF. Multi-media resources can provide reliable evidence for the occurrence of a taxon in a particular
place and time, and there is a growing recognition that a biodiversity-related multimedia object could be
used as a “primary biodiversity record” if the metadata associated with the object is available and has high
quality. Therefore, Audubon Core [191] standard came to fill the gap of a standard related to multimedia
resources, as digital or physical artifacts that normally comprise more than text. These include photographs,
artwork, drawings, sound, video, animations, and presentation materials, as well as interactive online media
such as species identification tools. The Audubon Core is a set of vocabularies designed to represent metadata
for biodiversity multimedia resources and collections. These vocabularies aim to represent information that
will help to determine whether a particular resource or collection will be fit for some particular biodiversity
science application before acquiring the media. Among others, the vocabularies address such concerns as the
management of the media and collections, descriptions of their content, their taxonomic, geographic, and
temporal coverage, and the appropriate ways to retrieve, attribute and reproduce them [191]. Plinian Core
[227, 203] is a set of vocabulary terms that can be used to describe all kind of properties related to taxa and
in its actual version, Plinian Core incorporates a number of elements already defined within standards in use,
such as EML and DwC.
2.5 Data Discovery and Integration
The search for data to perform biodiversity analysis and synthesis research is still a challenging task. The
most recent developments have occurred with the emergence of databases that aggregate datasets at global
and national scales such as GBIF [85], DataONE [182], SiBBr [105] and BaMBa [178]. The use of metadata
and data publishing standards allows institutions to map the internal representations of this information to
a format that is clearly specified and can be consumed and processed automatically by machines. Biodiver-
sity information aggregation databases allow datasets to be geographically, taxonomically, and temporally
searched. Languages and data analysis environments, such as R and Python, already have packages and
libraries that are integrated with the repositories and aggregators of biodiversity data. rgbif14 , for example,
is a package for R that allows searching and retrieving records directly from GBIF, with pygbif15 being its
analog for Python.
Often scientists need to combine data from different sources into integrative research. For example,
physico-chemical data can be combined with metagenomic data to try to establish correlations that explain
some ecosystem processes and implications such effectiveness of marine protected areas [45], contribution
of sea-mounts [177]. The activity of combining data from different sources is called data integration and
is one of the most active areas of research on scientific data management [5, 186]. Existing biodiversity
databases have advanced by establishing standards for metadata, such as EML [93], and for data such as
DwC. However, these are limited to defining controlled vocabularies, consisting of standardized terms in
each of the themes. A more sophisticated approach, involving not only the definition of terms but also the
relationships between them and rules of inference, which are called ontologies, is the subject of the Semantic
Web research area. Some initiatives in this direction in the area of biodiversity and ecology include ontologies
such as the Environment Ontology (ENVO) and the Biodiversity Collections Ontology (BCO) [279]. Ontologies
allow cross-referencing of different domains (Linked Data) and semantic queries, providing a data integration
tool considerably more powerful than the current ones.
14 https://cran.r-project.org/web/packages/rgbif/
15 https://recology.info/2015/11/pygbif/
16You can also read