A Unified Multi-Task Learning Framework of Real-Time Drone Supervision for Crowd Counting
←
→
Page content transcription
If your browser does not render page correctly, please read the page content below
A Unified Multi-Task Learning Framework of Real-Time Drone
                                                              Supervision for Crowd Counting
                                                                                          Siqi Gu and Zhichao Lian*
                                                                                 School of Computer Science and Engineering
                                                                                 Nanjing University of Science and Technology
                                                                                                Nanjing, China

                                           Abstract— In this paper, a novel Unified Multi-Task Learning     scene. The classic scale-aware CNN-based models handle the
arXiv:2202.03843v1 [cs.CV] 8 Feb 2022

                                        Framework of Real-Time Drone Supervision for Crowd Count-           scale variation problem by taking advantage of multi-column
                                        ing (MFCC) is proposed, which utilizes an image fusion network      or multi-resolution architectures, like [1]. Another set of ap-
                                        architecture to fuse images from the visible and thermal
                                        infrared image, and a crowd counting network architecture           proaches concerned local and global contextual information
                                        to estimate the density map. The purpose of our framework is        which is extracted from CNN-based frameworks to receive
                                        to fuse two modalities, including visible and thermal infrared      lower estimation errors including [2], [3] and [4]. Recently,
                                        images captured by drones in real-time, that exploit the comple-    Wang et al.[5] used Optimal Transport (OT) to measure
                                        mentary information to accurately count the dense population        the similarity between the normalized predicted density map
                                        and then automatically guide the flight of the drone to supervise
                                        the dense crowd. To this end, we propose the unified multi-task     and the normalized ground truth density map to decrease
                                        learning framework for crowd counting for the first time and        generalization error. Wan and Chen[6] concerned more about
                                        re-design the unified training loss functions to align the image    the annotation noise in crowd counting to get adaptive results
                                        fusion network and crowd counting network. We also design           on annotation noise. Zhou et al. [21] proposed a simple
                                        the Assisted Learning Module (ALM) to fuse the density map          but effective locality-based learning paradigm to produce
                                        feature to the image fusion encoder process for learning the
                                        counting features. To improve the accuracy, we propose the          generalizable features by alleviating sample bias.
                                        Extensive Context Extraction Module (ECEM) that is based on            Furthermore, images and videos captured by drones have
                                        a dense connection architecture to encode multi-receptive-fields    different camera perspectives and low resolution compared
                                        contextual information and apply the Multi-domain Attention         with traditional data sets which would make the task of
                                        Block (MAB) for concerning the head region in the drone view.       crowd counting and detection more difficult. Researchers
                                        Finally, we apply the prediction map to automatically guide the
                                        drones to supervise the dense crowd. The experimental results       have proposed several improved methods to solve the scale
                                        on DroneRGBT data set show that, compared with the existing         changes during the feature extracted and density map pre-
                                        methods, ours has comparable results on objective evaluations       diction process [7][8][9][10]. In addition, other researchers
                                        and an easier training process.                                     [11][12][13] have put forward frameworks to not only detect
                                                                                                            and count crowds but also to easily track and monitor big
                                                             I. INTRODUCTION                                crowds by using drones.
                                            Recently, drones have emerged in a wide range of applica-          However, conventional crowd counting data sets contain
                                        tions, such as visual surveillance, rescue and entertainment.       only visible images, which always has drawbacks of illumi-
                                        Although fixed cameras are widely used to monitor and               nation changes and poor imaging conditions in the nighttime
                                        detect crowd density in crowded indoor places, such as              or shadows. But the thermal infrared data can perfectly
                                        shopping malls and subway stations, the images captured             complement that and allow the effectiveness of crowd count-
                                        by fixed cameras often have the phenomenon of large hu-             ing methods both day and night. Recently, Peng et al. has
                                        man crowds cover each other or disruptive backgrounds. In           proposed a drone-based RGB-Thermal crowd counting data
                                        outdoor places, crowd analysis methods used from drone              set DroneRGBT[23], which also proposed a multi-modal
                                        view could be more convenient, accurate and flexible to             crowd counting network (MMCCN) to utilize the multi-
                                        grasp the crowd movement and crowd density situation.               modal inputs for crowd counting. But it required the complex
                                        Thus, automated crowd analysis from drones has been an              aligner model and huge computation cost because it had
                                        increasingly hot topic in computer vision and attracted much        to train multiple branches which increased the difficulty of
                                        attention.                                                          training.
                                            To begin with, due to strong occlusions, distortions of            Intuitively, we suppose that building the framework which
                                        perspective, scale variations and different human mass, iden-       connect the image fusion network and crowd counting net-
                                        tification and counting of people in the dense crowd are            work in stages will obtain great results. Nevertheless, we
                                        more challenging. Diverse CNN-based approaches have been            find that it is difficult to achieve prediction map with high
                                        proposed to address the crowd counting in the complex               quality because the original loss functions used in fusion
                                                                                                            network do not contain the counting features.Therefore, in
                                          *This work was not supported by any organization                  this work we propose the unified learning framework to
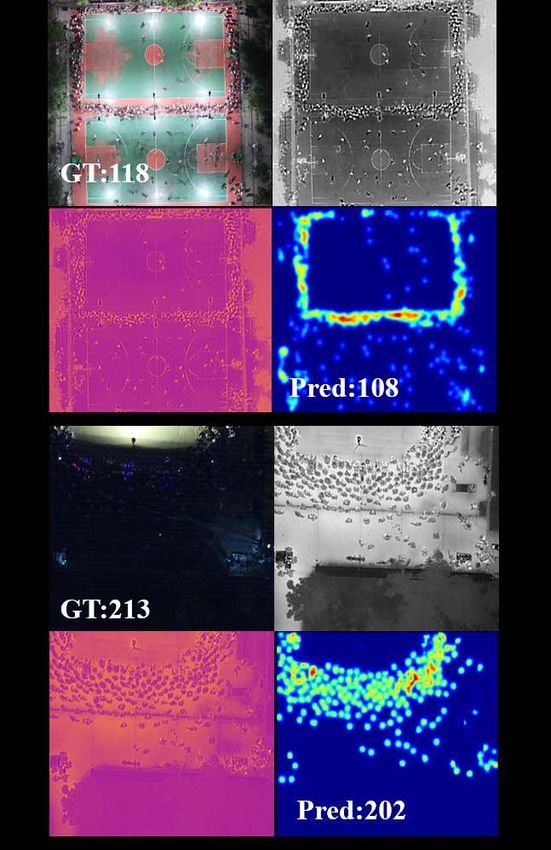
A. The Architecture of MFCC

                                                                         1) CRFN-Nest: As shown in Fig.3, regardless of light
                                                                      conditions, we prefer the detailed information from thermal
                                                                      infrared images and background information from visible im-
                                                                      ages to better estimate the crowd counting. Inspired by RFN-
                                                                      Nest[14], we improve the image fusion model by adding the
                                                                      Assisted Learning Module (ALM) to better reconstruction
                                                                      counting features. The pair of images are separately fed in
                                                                      two encoder modules to extract multi-scale features and then
Fig. 1. The flow chart of the end-to-end Multi-Task Fusion Counting   send to the same RFN-Fusion module to fuse the multi-
Framework (MFCC)                                                      modal features, and finally be reconstructed by the same
                                                                      reconstruction decoder module. As shown in Fig.2, Iir and
                                                                      Ivi indicate the source images (infrared image and visible
estimate the density map, which can easily reuse the existing         image). If denotes the output of CRFN-Nest, which is the
fusion model like [14][15][16] and align it with the crowd            fused image. The architecture of the encoder in CRFN-Nest
counting network using unified loss functions. Thus we add            is constituted by four RFN networks in the RFN Fusion
the Assisted Learning Module (ALM) to fuse the density                module and these RFN networks share the same architecture
map information during the fusion encoding process and re-            but with different weights, we set it following RFN-Nest.
design the decomposed loss function to develop the counting           The framework of CRFN-Nest is shown in the grey box in
residual fusion network architecture (CRFN-Nest) based on             Fig.2.
RFN-Nest[14].                                                            However, the loss function set in RFN-Nest could not
   What’s more, to increase the accuracy, we also propose             orientate the fusion image towards the crowd counting task.
the multi-receptive-fields crowd counting machine to extract          Therefore, we design the Assisted Learning Module (ALM)
multi-scale context with robust high-level feature represen-          to further align the density map features to the encoder
tation from fusion images. Specifically, we propose the Ex-           backward process. Considering the fusion task and counting
tensive Context Extraction Module (ECEM) to build connec-             task are both based on the regression model, we transform the
tions between the dilated layers with different dilated rates.        regression loss to classification one by applying the assisted
Also, to screen the crowd counting features we introduce the          learning method because it brings sharper linear loss and
Multi-domain Attention Block (MAB) to encode the spatial              supplementary characteristic information to force the fusion
and channel dependencies in the whole feature map, which              model to make trade-offs in the direction required by the
uses long-range dependency to reduce the error estimation             counting task. This module will not be used during the
for background and redundancy under the counting scene.               validation process.
Finally, we apply the prediction map generated by MFCC to                2) ECEM: The previous scale-aware methods are not ro-
automatically guide drones to supervise high dense crowds             bust enough to deal with large variations in scales and spatial
via designing a real-time dense area supervising method. The          at the same time, especially from drones. Furthermore, non-
flow chart of our proposal is shown in Fig.1.                         uniform density in a single image or data set is prone to
                                                                      mislead the existing models because of the similar class-
                   II. P ROPOSED M ETHOD                              specific responses. Thus we design the Extensive Context
                                                                      Extraction Module (ECEM) to extract the feature from the
   This chapter introduces the details of the proposed unified        fusion image. We use ResNet [17] and dilatation module
multi-task learning framework for Crowd Counting. Different           as the front-end of our method inspired by CSRNet [4]
from the previous crowd counting methods, we fuse the                 and Spatial-/Channel-wise Attention Regression Networks
visible images and thermal infrared images on the feature-            for Crowd Counting (SCAR) [3]. It enlarges the respec-
level to make it keep the complementary information from              tive field of the extracted feature map and outputs a 64-
the multi-modal inputs. Then we send the fusion image into            D channel with 1/8 size feature maps. Different from the
the crowd counting network to estimate the prediction map.            method proposed in [18], we remove a global max-pooling
Also, for building the end-to-end unified learning framework          layer, a 1×1 convolution, and a bilinear interpolation on
we re-design the loss function during the training process. We        the sampling layer to better build the background modeling
propose the MFCC not only utilize the multi-modal inputs              in the counting task and increase the generalization ability
to increase the accuracy of the counting prediction map but           to fit the large-range scale changes. We change the hyper-
also propose a flexible framework to apply different image            parameters to keep the size of the channel unchanged. To
fusion and crowd counting strategies. The pipeline of the             be specific, as shown in Fig.4, after obtaining the feature
Multi-Task Fusion Counting Network is shown in Fig.2. In              map (i.e., F1 ) from preceding layers we feed it into our
this section, we describe the flow chart of whole network and         ECEM. The size of the backbone’s output is C ×H ×W . We
then present the details of each submodules: ALM, ECEM,               utilize five dilated convolutional layers with different rates,
and MAB.                                                              e.g., rate = 3, 6, 12, 18, 24. In addition, dense connections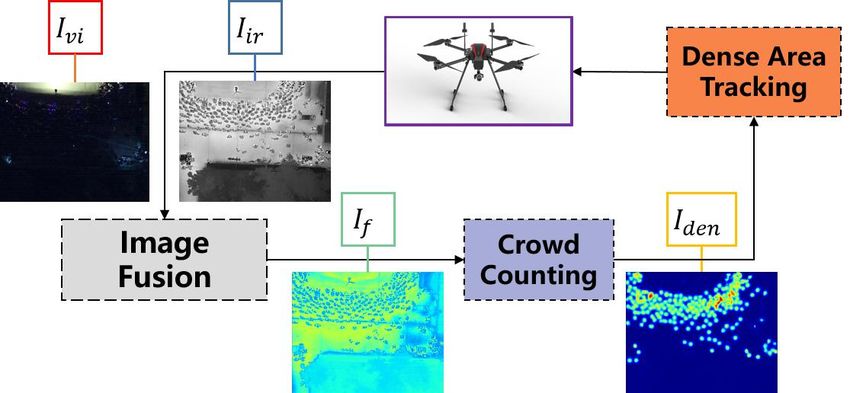
Fig. 2. The pipeline of Multi-Task Fusion Counting Network. ’3×3’ represents the normal convolutional operation. ’3×3-d-R’ represents the convolutional
operation with kernel size of 3×3, dilation rate of 2. The ’R’ means that the ReLU layer is added to this convolutional layer

                                                                             Fig. 4. The detailed architectures of the Extensive Context Extraction
                                                                             Module (ECEM) in EBM-Net. ’DR’ represents the dilated rate of the current
                                                                             dilated convolution.

    Fig. 3.   Image pairs and ground truth from DrondRGBT data set

                                                                             the foreground’s textures are very similar to those of some
are employed to our ECEM, where the results of each                          background regions (trees, roads, and so on). Therefore, we
dilated layer are integrated with the former ones and then                   aim to embed the spatial-wise and channel-wise attention
are feed to the later ones. DenseNet [19] designs the dense                  models to reduce these problems which we named Multi-
connection to handle the problems of vanishing gradients                     domain Attention Block (MAB).
and strengthens features propagation when the CNN model
                                                                                The detailed architectures of the MAB are shown in Fig.5.
is quite deep. Concatenation operation is applied to fuse
                                                                             The spatial-wise attention model is described in the blue
features and integrate the information. As a result, these
                                                                             box and the channel-wise attention model is described in the
separated convolutional layers can harvest multiple feature
                                                                             yellow box. The output of ECEM with the size of C ×H ×W
maps in various-scale and large-range receptive fields. A
                                                                             is fed into several 1 × 1 convolutional layers. Then by the
semantically informative and globally distributed feature map
                                                                             reshape or transpose operations, the spatial or the channel
(i.e., F2 ) is generated after our ECEM and the size of it is the
                                                                             information is kept respectively.
same as input, which means we keep the global information
without deepening the channel of the feature map.                               In the spatial domain, we adaptive several operations to
   3) MAB: Since the feature map generated by ECEM                           pay more attention to the relations between subregions which
is full of rich receptive field information and contextual                   are more relevant. Consequently, the feature map keeps more
information, not all of them are useful to facilitate the perfor-            clear semantics and contextual dependencies within regions.
mance of crowd counting. Inspired by Non-local block[20],                    In the channel domain, we regard each channel map of the
we want to weigh the sum of the original local features                      high-level features as a class-specific response, and different
map to learn this density change in spatial. Specifically, the               semantic responses are related to each other. The channel-
class-specific response includes two types: foreground (head                 wise attention module significantly prompts the regression
region) from infrared features and background (other regions)                result and reduces the error prediction for backgrounds.
from visible features. The large-range dependencies on spa-                  Following the generic non-local operation in deep neural
tial dimension features tend to mislead the model because                    networks, the attention mechanism can be defined as: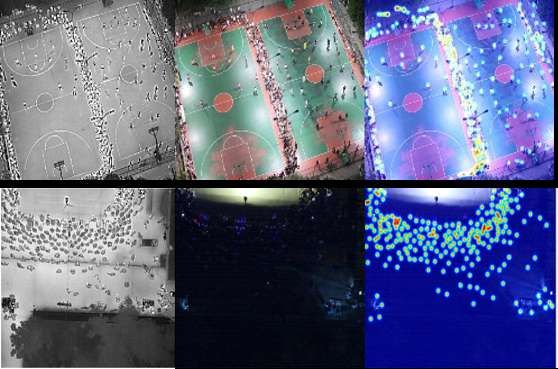
1 X
                 yi =        f (xi , xj )g(xj )               (1)
                        C(x)
                                  ∀j
   Here i is the index of an output position whose response
is to be computed and j is the index that enumerates all
possible positions. x represents features and y is the output
signal of the same size as x. Function f computes the affinity
relationship between i and all j. Function g computes a
representation of the input signal at the position j. The
response is normalized by a factor C(x).
   Several versions of f and g can be used. Here we consider
g in the form of a linear embedding and utilize two kinds of
f:
                        g (xj ) = Wg xj                    (2)
                                                   T
                                                                    Fig. 5.   The detailed architectures of the Multi-domain Attention Block
                        f (xi , xj ) = exi s           xj
                                                              (3)   (MAB).
                                               T
                    f (xi , xj ) = eθ(xi )         φ(xj )
                                                              (4)
                 θ(xi ) = Wθ xi , φ(xj ) = Wφ xj              (5)
   Here Wg , Wθ , Wφ is implemented as 1 × 1 convolution in
space. Eq.(3) and Eq.(4) represent Gaussian and Embedded
                         1
Gaussian respectively. C(x) f (xi , xj ) becomes the softmax
computation along the dimension j. We implement Eq.(4)
In the spatial attention module and Eq.(3) in the channel
attention module.
   The main operations are the same in the two domains’
attention module. As shown in Fig.5, given the F2 ∈
RC×H×W , we generate new feature maps S1 , S2 , C1 , and
C2 , where {S1 , C1 } ∈ RC×HW and {S2 , C2 } ∈ RHW ×C .
Then we perform matrix multiplication and generate the
spatial attention map S3 ∈ RHW ×HW , the channel attention          Fig. 6. The framework of ALM. ’3×3 - (64, 8)’ represents the convo-
map C3 ∈ RC×C respectively. The process can be formu-               lutional operation with kernel size of 3×3, 64 input channels, 8 output
                                                                    channels.
lated as follows:

                            exp S1i · S2j                           B. Two-stage Training Strategy
                   S3ji = HW                                (6)
                              exp S1i · S2j
                          P
                                                                       Note that the ability of the image fusion strategy in our
                          i=1                                       framework to reconstruct the fusion image is absolutely

                            exp C1i · C2j                           crucial for the unified training process at the beginning,
                   C3ji = C                                 (7)   accordingly, we develop a two-stage training strategy to make
                          P
                              exp C1i · C2j                         sure that each part of our network could show outstanding
                                i=1                                 performance.
   Where  S3ji  and      C3ji
                           denotes the i-th spatial/channel’s          Firstly, we pre-train the CRFN-Nest to extract and re-
influence on j-th spatial/channel. For the final sum or multi-      construct the multi-modal features. As stated previously, we
plication, we scale the output by a learnable factor and define     develop the ALM to guide the fusion model to embody the
the output of spatial/channel as below.                             counting density map features. By using the feature map
                                                                    Ft generated by CONV1 in Fig.2 and the dot ground truth
                                 HW
                                 X                                Igt , ALM calculates the classification loss between density
                 Sf inal = η               S3ji · S4i ·M js   (8)   map ground truth k and feature map u following Eq.10 and
                                 i=1                                Eq.11. N means the number of images and c means one of
                         XC                                       the two kinds of modalities (visible or infrared). To generate
              Cf inal = µ     C3ji · C4i + Fcj                (9)   the density map ground truth D(x), we follow CSRNet by
                                i=1                                 blurring each head annotation using a Gaussian kernel (which
   F3 , the output of our MAB, is generated by integrating          is normalized to 1). The geometry-adaptive kernel is defined
the two types of feature maps and the 1×1 convolution. The          as Eq.12. Also, S(x) represents the neural network which is
output is as the same size of F2 .                                  shown in the left part of Fig.6.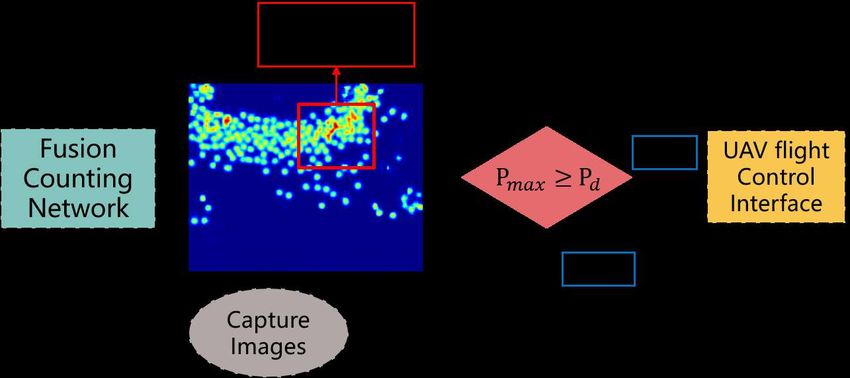
N
                       1 X
   Los sAt = −               ki log (ui ) + (1 − ki ) log (1 − ui )
                       N i=1
                                                                  (10)

             k = D (Igt ) , u = S (Ft ) , t ∈ {ir, vi}            (11)

                                                                                 Fig. 7.   The pipeline of dense area supervising method.
                              C
                              X
                   D(x) =            δ (x − xi ) ∗ Gσ (x)         (12)
                               i=1

   As the infrared image contains more salient target features
than the visible image, the loss function Lossf eature is
designed to constrain the fused deep features to preserve
the salient structures. We set Lossf eature following RFN-
Nest[14], In Eq.13, M is the number of the multi-scale deep
features, which is set to 4, w1 is a trade-off parameter vector
for balancing the loss magnitudes. It assumes four values 1,             Fig. 8. The distribution of different light levels and density levels in
10, 100, 1000. wvi and wir control the relative influence of             DroneRGBT data set.
the visible and infrared features in the fused feature map
Φmf . Finally, we set the Lossf defined as Eq.14.
                                                                         drone will move directly above the selected bk by using GPS
                       M
                       X                                          2      information of the drone and relative location Information to
  Loss   feature   =         w1 (m) Φm         m         m
                                     f − (wvi Φvi + wir Φir )     F      calculate the transformation matrix and then complete the
                       j=1                                               supervising task, referring [22]. The flow chart is shown in
                                                                  (13)   Fig.7.

          Lossf = LossAir + LossAvi + Loss              feature   (14)
                                                                                             Pmax = Max (Count (bk ))                       (16)
   Lastly, we use the pre-trained image fusion model to
further train the MFCC to complete the unified training
process. During the training phase, the counting loss function                                    III. E XPERIMENT
Losscounting is standard Mean Squared Error (MSE). The                      In our experiments, all images are kept the original size
total loss function is defined as Eq.15. And the λ and µ                 512×640, and the ground truth of density maps is generated
are the weights of counting loss and image fusion loss,                  under the same size. We set the learning rate at 10−5 and
respectively.                                                            reduces to 0.995 times every epoch. The batch size of each
              Lossf = λ ∗ Losscounting +µ ∗ Lossf                 (15)   dataset is 4 on each GPU. We obtain the best result at about
                                                                         200 epochs. In the MAB, we set the input channel number C
C. The Dense Area Supervising Method                                     as 64, which is the channel number of the output of ECEM.
   In addition to design the end-to-end Multi-Task Fusion                All experiment training and evaluation are performed on
Counting Network, we also want the prediction map can                    NVIDIA GTX 3090 GPU using the PyTorch framework[24].
guide the flight direction of the drone in order to add the abil-        The backbone of our framework is ResNet-50 and λ, µ in
ity of real-time supervising the high dense crowds to drones.            Eq.?? are set by 10 and 1. We add several Drop-out layers
Firstly, we set the dense warning criteria Pd to measure                 to overcome the over fitting problem.
the densest crowd in the prediction image depending on the
                                                                         A. Data set and Evaluation methods
phenomena. Then we use the window selection algorithm to
get several candidate boxes bk and calculate the total number              In order to assess the performance of the proposed frame-
of people in bk following Eq.16 to get the maximum value                 work, since the multi-modal crowd counting data set is rare,
Pmax . The function Count(x) means the total number of                   we validate our proposal on DroneRGBT[23] data set. The
people included in bk . Secondly, we compare Pmax and Pd                 detailed information of the data set is shown in Table.II,
to decide whether the most dense crowd exceeds the dense                 in which ‘Min’, ’Max’, and ‘Ave’ denote the minimum,
warning criteria and whether to send the alert message to the            maximum, and the average number of people contained in
UAV flight control interface to supervise the highest density            each image in DroneRGBT. We also show the distribution
area. The alert message contains the crowd intensity and                 of different illumination levels and density levels in Fig.8.
dense area direction according to the selected bk . Finally, the         We evaluate the performance by using Mean Absolute Error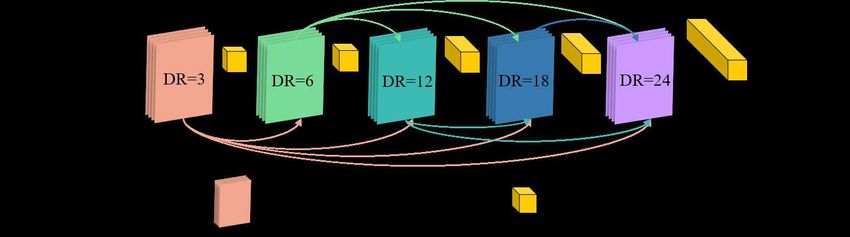
TABLE I
                                    T HE ABLATION EXPERIMENT BASED ON D RONE RGBT DATA SET

            Method         Overall       Low density      Medium   density    High density       Dark and dust           Light
          Evaluation    MAE RMSE        MAE    RMSE       MAE      RMSE      MAE     RMSE        MAE    RMSE        MAE     RMSE
            ALM         9.48    15.16   5.08    7.20      14.17     17.63    27.00   34.84       8.08    13.51      10.83    16.59
         ECEM+MAB       8.28    12.76   4.61    6.66      14.67     18.79    16.72   21.79       8.42    13.81      8.15     11.67
           MFCC         7.96    12.50   4.44    6.72      14.09     18.68    16.01   20.32       7.68    13.56      8.30     11.51

(MAE) and Root Mean Square Error (RMSE), which are
matrixed as follow:
                                        v
               N                        u    N
           1  X                         u1 X               2
 M AE =           |yi − ŷi | , RM SE = t       |yi − ŷi |
           N i=1                          N i=1
                                                           (17)

   where N is the number of images in the testing set, yi
is the ground truth of people number and yˆi refers to the
estimated count value for the i-th test image.

                          TABLE II
     T HE DETAILED INFORMATION OF D RONE RGBT DATA SET.

   Data set & Resolution & Thermal & View & Max & Min & Ave
   DroneRGBT & 512×640 & contain & drone & 403 & 1 & 48.8

B. Compared with baselines
   Firstly, compared with the performance of the state-of-
art models on RGB mode, our framework has nearly 3.0
percentage improvements on MAE and 4.3 percentage im-
provements on MSE which proves the effectiveness of our              Fig. 9. The visualization of estimating the result of DroneRGBT data set.
framework. Secondly, we also get improvements compared               Pictures with number 1 represent visible image, pictures with number 2
with the results of the models on thermal infrared mode.             represent thermal infrared image, pictures with number 3 represent fusion
                                                                     image, pictures with number 4 represent prediction map. ’GT’ represents
Thirdly, the performance of MMCCN proposed along with                the ground truth population and ’Pred’ represents the estimation population.
DroneRGBT data set has a slight advantage over ours be-
cause it utilizes CycleGan[30] to generate extra fake multi-
modal images to improve the accuracy of the prediction den-          C. Ablation Experiment
sity map which consumes more computation compared with
                                                                        To analyze the importance of each component of our
ours. Thus, according to the experiments compared with the
                                                                     proposed MFCC, we additionally construct the ablation
different baselines, our framework proves its effectiveness
                                                                     experiment to prove the effectiveness of each component. In
and competitiveness.
                                                                     addition to the show the performance of the total test set on
                                                                     objective evaluations, we also compared them under different
                          TABLE III                                  density levels and light conditions which is consistent with
C OMPARISON OF OUR APPROACH WITH OTHER PROPOSED BASELINE ON          Fig.8. All components are trained on the training set and
                    D RONE RGBT DATA SET                             tested on the testing set. From Table.I, our MFCC achieves
                                                                     better results regardless of the density and light condition.
                  Method                 RGB Input
                                     MAE      RMSE                      To intuitively show the performance of our method,
           ACSCP(CVPR2018)[25]       18.87     28.83                 Fig.9 illustrates the 2 groups of visualization results on the
           CSRNet(CVPR2018)[4]       13.06     19.06                 DroneRGBT data set. We can clearly find that the prediction
          CANNET(CVPR2019)[26]       10.87     17.58
            BL(CVPR2019)[29]          10.9     16.80
                                                                     counting numbers of our framework approaches to the label
                                       Thermal Input                 counting numbers.
         SANET(ECCV 2018)[27]        12.13     17.52
         DA-NET(Access 2018)[28]      9.41     14.10                                           IV. C ONCLUSION
          SCAR(NeuCom 2019)[3]        8.21     13.12
                                     Multi-modal Input                 In this paper, we propose a Unified Multi-Task Learning
        DroneRGBT(ACCV2020)[23]       7.27     11.45                 Framework of Real-Time Drone Supervision for Crowd
              MFCC(Ours)              7.96     12.50                 Counting (MFCC) to estimate the density map and crowd
counting result, and then utilize the prediction map for [21] Zhou J T, Zhang L, Jiawei D, et al. Locality-Aware Crowd Counting[J].
drones flight to supervise the dense crowd. We propose this IEEE Transactions on Pattern Analysis and Machine Intelligence,
2021.
framework for the first time to prove the effectiveness of [22] Skoda J, Barták R. Camera-based localization and stabilization of a
our method through different experiments settings. We will flying drone[C]//The Twenty-Eighth International Flairs Conference.
enhance our framework to achieve better results in the feature 2015
[23] Peng, T., Li, Q., & Zhu, P. (2021). RGB-T Crowd Counting from
and design more efficient models. Drone: A Benchmark and MMCCN Network. Lecture Notes in
Computer Science (Including Subseries Lecture Notes in Artificial
R EFERENCES Intelligence and Lecture Notes in Bioinformatics), 12627 LNCS,
497–513
[1] Zhang Y, Zhou D, Chen S, et al. Single-image crowd counting via
[24] Paskze A, Chintala S. Tensors and Dynamic neural networks in Python
multi-column convolutional neural network[C]//Proceedings of the
with strong GPU acceleration[J]. 2017
IEEE conference on computer vision and pattern recognition. 2016:
[25] Shen Z, Xu Y, Ni B, et al. Crowd counting via adversarial cross-
589-597
scale consistency pursuit[C]//Proceedings of the IEEE conference on
[2] Sheng B, Shen C, Lin G, et al. Crowd counting via weighted VLAD computer vision and pattern recognition. 2018: 5245-5254
on a dense attribute feature map[J]. IEEE Transactions on Circuits and [26] Liu W, Salzmann M, Fua P. Context-aware crowd count-
Systems for Video Technology, 2016, 28(8): 1788-1797 ing[C]//Proceedings of the IEEE/CVF Conference on Computer Vision
[3] Gao, J., Wang, Q., & Yuan, Y. (2019). SCAR: Spatial-/channel-wise and Pattern Recognition. 2019: 5099-5108
attention regression networks for crowd counting. Neurocomputing, [27] Z. Shen, Y. Xu, B. Ni, M. Wang, J. Hu and X. Yang, ”Crowd Counting
363, 1–8 via Adversarial Cross-Scale Consistency Pursuit,” 2018 IEEE/CVF
[4] Li Y, Zhang X, Chen D. Csrnet: Dilated convolutional neural networks Conference on Computer Vision and Pattern Recognition, 2018, pp.
for understanding the highly congested scenes[C]//Proceedings of the 5245-5254
IEEE conference on computer vision and pattern recognition. 2018: [28] Zou Z, Su X, Qu X, et al. Da-net: Learning the fine-grained density
1091-1100 distribution with deformation aggregation network[J]. IEEE Access,
[5] Wang, B., Liu, H., Samaras, D., & Hoai, M. (2020). Distribution 2018, 6: 60745-60756
Matching for Crowd Counting. NeurIPS, 1–13 [29] Ma Z, Wei X, Hong X, et al. Bayesian loss for crowd count estimation
[6] Wan J, Chan A. Modeling noisy annotations for crowd counting[J]. with point supervision[C]//Proceedings of the IEEE/CVF International
Advances in Neural Information Processing Systems, 2020, 33. Conference on Computer Vision. 2019: 6142-6151
[7] Elharrouss O, Almaadeed N, Abualsaud K, et al. Drone-SCNet: Scaled [30] Zhu J Y, Park T, Isola P, et al. Unpaired image-to-image translation
Cascade Network for Crowd Counting on Drone Images[J]. IEEE using cycle-consistent adversarial networks[C]//Proceedings of the
Transactions on Aerospace and Electronic Systems, 2021 IEEE international conference on computer vision. 2017: 2223-2232
[8] Liu, W., Lis, K., Salzmann, M., & Fua, P. (2019). Geometric and
Physical Constraints for Drone-Based Head Plane Crowd Density
Estimation. IEEE International Conference on Intelligent Robots and
Systems, 244–249
[9] Küchhold M, Simon M, Eiselein V, et al. Scale-adaptive real-time
crowd detection and counting for drone images[C]//2018 25th IEEE
International Conference on Image Processing (ICIP). IEEE, 2018:
943-947
[10] Bakour, I., Bouchali, H. N., Allali, S., & Lacheheb, H. (2021). Soft-
CSRNet: Real-time Dilated Convolutional Neural Networks for Crowd
Counting with Drones. 2020 2nd International Workshop on Human-
Centric Smart Environments for Health and Well-Being, IHSH 2020,
28–33
[11] Sirmacek B, Reinartz P. Automatic crowd analysis from airborne
images[C]//Proceedings of 5th International Conference on Recent
Advances in Space Technologies-RAST2011. IEEE, 2011: 116-120
[12] Gonzalez-Trejo J, Mercado-Ravell D. Dense Crowds Detection and
Surveillance with Drones using Density Maps[C]//2020 International
Conference on Unmanned Aircraft Systems (ICUAS). IEEE, 2020:
1460-1467
[13] Tzelepi M, Tefas A. Human crowd detection for drone flight safety
using convolutional neural networks[C]//2017 25th European Signal
Processing Conference (EUSIPCO). IEEE, 2017: 743-747
[14] Li H, Wu X J, Kittler J. RFN-Nest: An end-to-end residual fusion
network for infrared and visible images[J]. Information Fusion, 2021,
73: 72-86
[15] Li H, Wu X J, Durrani T. NestFuse: An infrared and visible image
fusion architecture based on nest connection and spatial/channel
attention models[J]. IEEE Transactions on Instrumentation and Mea-
surement, 2020, 69(12): 9645-9656
[16] Zhao Z, Xu S, Zhang C, et al. DIDFuse: Deep image decomposition for
infrared and visible image fusion[J]. arXiv preprint arXiv:2003.09210,
2020.
[17] He K, Zhang X, Ren S, et al. Deep residual learning for image
recognition[C]//Proceedings of the IEEE conference on computer
vision and pattern recognition. 2016: 770-778
[18] Cao, J., Chen, Q., Guo, J., & Shi, R. (2020). Attention-guided context
feature pyramid network for object detection. ArXiv, 1–12
[19] Huang G, Liu Z, Van Der Maaten L, et al. Densely connected
convolutional networks[C]//Proceedings of the IEEE conference on
computer vision and pattern recognition. 2017: 4700-4708
[20] Wang X, Girshick R, Gupta A, et al. Non-local neural net-
works[C]//Proceedings of the IEEE conference on computer vision
and pattern recognition. 2018: 7794-7803You can also read