DDU-Nets: Distributed Dense Model for 3D MRI Brain Tumor Segmentation
←
→
Page content transcription
If your browser does not render page correctly, please read the page content below
DDU-Nets: Distributed Dense Model for 3D
                                                  MRI Brain Tumor Segmentation

                                                         Hanxiao Zhang1,2 , Jingxiong Li3 , Mali Shen2 , Yaqi Wang4 ,
                                                                       and Guang-Zhong Yang1,2
                                              1
                                                      The Institute of Medical Robotics, Shanghai Jiao Tong University, China
arXiv:2003.01337v1 [eess.IV] 3 Mar 2020

                                                  2
                                                       The Hamlyn Centre for Robotic Surgery, Imperial College London, UK
                                                                        hanxiao.zhang18@imperial.ac.uk
                                                            3
                                                                Queen Mary University of London, London E1 4NS, UK
                                                              4
                                                                 Hangzhou Dianzi University, Hangzhou 310018, China

                                                  Abstract. Segmentation of brain tumors and their subregions remains
                                                  a challenging task due to their weak features and deformable shapes. In
                                                  this paper, three patterns (cross-skip, skip-1 and skip-2) of distributed
                                                  dense connections (DDCs) are proposed to enhance feature reuse and
                                                  propagation of CNNs by constructing tunnels between key layers of the
                                                  network. For better detecting and segmenting brain tumors from multi-
                                                  modal 3D MR images, CNN-based models embedded with DDCs (DDU-
                                                  Nets) are trained efficiently from pixel to pixel with a limited number
                                                  of parameters. Postprocessing is then applied to refine the segmentation
                                                  results by reducing the false-positive samples. The proposed method is
                                                  evaluated on the BraTS 2019 dataset with results demonstrating the
                                                  effectiveness of the DDU-Nets while requiring less computational cost.

                                                  Keywords: Brain Tumor, Multi-modal MRI, 3D CNNs, Segmentation

                                          1   Introduction
                                          Gliomas are a kind of brain tumor developed from glial cells. It is one of the
                                          most threatening brain tumors as more than 40 percent of all tumors befall are
                                          malignant [12]. As a result, it is necessary to develop an accurate segmentation
                                          model for quantitative assessment of brain tumors, assisting early diagnosis and
                                          treatment planning. However, because of the diverse characteristics of tumor
                                          cells, reliable tumor segmentation remains a challenging task.
                                              Focusing on the evaluation of state-of-the-art brain tumor segmentation meth-
                                          ods, the annual Brain Tumor Segmentation Challenge (BraTS) provides datasets
                                          of brain magnetic resonance imaging (MRI) scans collected from multiple insti-
                                          tutions [1][2][3][4][13]. The datasets include annotated MRI scans of low grade
                                          gliomas (LGG) and high grade glioblastomas (GMM/HGG), acquired under
                                          standard clinical conditions with different equipment and protocols. For each
                                          case, four 3D MRI modalities are provided consisting of a native T1-weighted
                                          (T1), a post-contrast T1-weighted scan (T1Gd), a native T2-weighted scan (T2)
                                          and a T2 Fluid Attenuated Inversion Recovery (T2-FLAIR) scan. Each tumor
2 Hanxiao Zhang et al.
is divided into 3 subregions for evaluation, which are enhancing tumor (ET),
tumor core (TC) and whole tumor (WT), referred as complete tumor region
extent [4]. All labels are evaluated manually by professional raters and approved
by internationally recognized expert neuroradiologists.
Recently, convolutional neural networks (CNNs) with encoder-decoder struc-
ture have demonstrated their ability in segmenting biomedical images [5][6][11][16],
where the encoder down-samples and extracts features from the input data while
the decoder rebuilds segmentation of the targets. As a result, methods based on
CNNs are popular for brain tumor segmentation. In 2018, Myronenko [14], who
won the 1st prize in BraTS18, proposed their ResNet based 3D encoder-decoder
model and achieved the highest accuracy and robustness among others. Isensee
et al. [9] also shown that well-trained U-Net without much modification could
achieve competitive segmentation accuracy.
Current challenges of CNN-based methods include false predictions caused
by weak features of tumors, gradient vanishing and overfitting problems when
training on deep CNNs, slow training speed due to a large amount of training
data, and low accuracy caused by false-positive predictions. To deal with these
problems, we propose in this paper several patterns of distributed dense connec-
tions (DDCs), which reuse features in different strategies. CNN-based models
with DDCs are designed to automatically segment brain tumor targets. In ad-
dition, postprocessing is applied to reduce the false-positives for more accurate
delineation.
2 Methods
2.1 Distributed Dense Connections (DDCs)
Although deeper CNNs could reach a better performance than that of shallow
ones, the problem of gradient vanishing can have a negative impact on network
capacity and efficiency. It has been shown that this can be alleviated by shortcut
connections between contextual layers [7][8][10][15].
The concept of residual learning network is used by ResNet [7] to address the
degradation problem, which uses shortcut connections to skip one or more lay-
ers by summation, providing implicit deep supervision. DenseNet [8] proposes
dense blocks with more shortcut connections, combining the feature maps of
all the preceding layers as the input of the subsequent layer using a more effi-
cient concatenation strategy. In practice, DenseNet provides better performance
but consumes more GPU memory as the number of input channels grows dra-
matically towards deeper layers. The structure of DenseNet only allows dense
connections being operated within each dense block and no shortcut connections
are operated between dense blocks. It shows that GPU memory consumption can
be reduced at the expense of training time by introducing an implementation
strategy of shared memory allocations for storing feature maps [15]. Different
from this memory-saving strategy, we aim to improve our network efficiency,
while performing a better accuracy with much fewer dense connections.DDU-Nets: Distributed Dense Model for 3D MRI Brain Tumor Segmentation 3
We note that the gradient is unlikely to vanish very quickly in a few layers,
so there is no need to relearn redundant features right after the preceding layers.
The feature reuse can also be strengthened when the early feature maps are
recalled by a reasonable skip distance.
Consequently, we propose a novel densely connected unit called distributed
dense connections (DDCs), which only transmit features between critical inter-
mediate layers without settled blocks. This approach reduces the total number
of dense connections and extends the radiation scope of early features to the
deeper layers, thus reducing the number of parameters and enhancing the global
integration of information flow. The identity function of a neural network using
distributed dense connections can be expressed as:
xn = Fn ([xni , xnii , · · · , xni···ii ]) (1)
where Fn (·) is non-linear transformation after each layer, n represents the nth
layer. The output of the nth layer is represented as xn . [xni , xnii , · · · , xni···ii ]
refers to the concatenation of the feature maps produced by the chosen layers
ni , nii , · · · , ni···ii .
Fig. 1. Three architectures of distributed dense connections. The boxes with the same
color denote hidden layers with the same size, known as the size-block. White boxes
with colored borders mean concatenation operation for chosen layers. (a) stands for
cross-skip, which reuses feature maps from the last layer of each size-block; (b) rep-
resents skip-1, which reuses the last 2 layers of preceding size-block; (c) represents
skip-2, which reuses the last layer of preceding size-block and the first layer of the
current block.4 Hanxiao Zhang et al.
To match different sizes of feature maps, we consider three solutions: (a)
Downsample the upper layer by performing 2 × 2 convolutions with the stride of
2; (b) 3 × 3 dilated convolutions with dilation 2 may increase the receptive field
of feature maps when performing downsampling by the stride of 2; (c) Pooling
is a simple way to halve the size of feature maps, which generates no additional
parameter. In the network that is not deep enough, we recommend (average)
pooling to extract different implicit features from former layers before passing
to the back layers which may contain max pooling features.
Three patterns of distributed dense connections are designed in Figure 1,
varying in terms of choosing key layers and the methods for transmitting feature
maps. In (a), DDC (cross-skip), each concatenation input consists of features
from the final layer of all size-blocks. Due to the global transmission of chosen
features, each size-block could reuse features from all the preceding blocks. For
(b), each concatenation input includes features only chosen from the last two
layers of preceding size-block where the information flow does not spread globally.
We name this pattern as ’skip-1’. (c) reuses the features from 2 size-blocks. Each
concatenation input consists of features chosen from the first layer of present
size-block and the last layer of the preceding size block.
2.2 DDU-Net Architectures
Inspired by the encoder-decoder architecture, which is widely used for biomed-
ical image segmentation, We modified U-Net [16] respectively by adding the
above three patterns of distributed dense connections between each neighboring
resolution stages in the encoder path. These proposed networks are named as
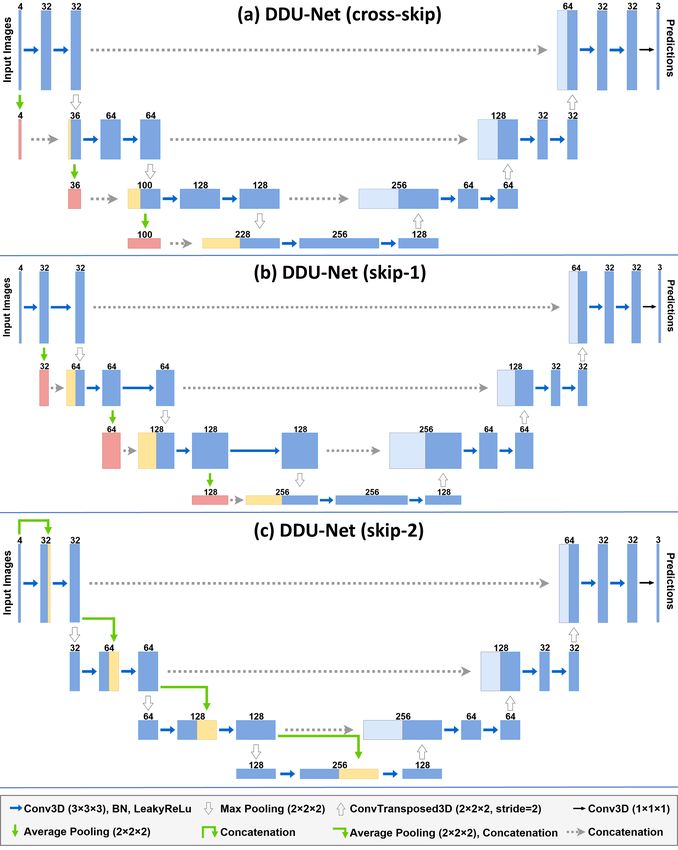
DDU-Nets (distributed dense U-Nets), as shown in Figure 2.
The networks in Figure 2 inherit the encoder-decoder architecture with 4
resolution stages (levels) operating with different sizes and channels of layers.
Every stage in the encoder path consists of two convolutional layers with 3 ×
3 × 3 kernels applied by 1 stride and 1 padding, each followed by a LeakyReLU
(alpha = 0.2) and a 3D batch normalization. Max pooling with the stride of 2
is applied at each end of the encoder stage to downsize the feature maps. In the
decoder path, each stage has an up-sampling operation and two convolutions
each followed by a LeakyReLU and a batch normalization. In order to achieve
the pixel-to-pixel localization, the feature maps at each end of the encoder stage
are concatenated to the beginning of the corresponding decoder stage, which
provides the high-resolution features to the decoder path. At the final layer, a
1 × 1 × 1 convolution is used to produce the output with the required numbers
of classes and the same image size as the input data.
At the encoder side of the network, we apply distributed dense connection
to bridge over features between stages. For cross-skip pattern shown in Figure
2 (a), the first layer of the upper stage in the encoder path is down-sampled
by average pooling before concatenation, aiming to match the size of the first
layer of the lower stage, which is also the output of the upper stage after max
pooling. The input of each stage has direct access to all the previous repre-
sentative feature maps on a global scale, thus enhancing the feature reuse andDDU-Nets: Distributed Dense Model for 3D MRI Brain Tumor Segmentation 5 Fig. 2. DDU-Nets with different patterns of DDCs. (a), (b) and (c) represent DDU-Nets with cross-skip, skip-1 and skip-2 respectively. All the feature maps and translations are based on 3D volumes. Copied feature maps and concatenated feature maps can be distinguished by different colors of boxes. Operations are represented by arrows. propagation with less redundant connections. Similarly, the DDU-Nets of skip-1 (b) and skip-2 (c) in Figure 2 follow the patterns of their own distributed dense connections mentioned in Section 2.1. With the application of distributed dense connections, we empirically halve the feature channels of each stage comparing to the traditional U-Net [16]. Experiments (see Table 1) show that the proposed network architectures can effectively improve the performance of brain tumor segmentation tasks.
6       Hanxiao Zhang et al.

2.3   Loss Function

Our loss function includes two parts: the average of Dice loss and L2 regulariza-
tion which are shown in equation (2) and (3):

                                      X
                            LDice =       (1 − DICE)                            (2)
                                      class

                        L = LDice(mean) + 0.01LL2(total)                        (3)

    To accurately represent the loss of inference, the Dice coefficient is used to
represent the loss function, which is a frequently used measurement for pixel-wise
segmentation tasks. One of the main challenges of brain tumor segmentation is
the imbalance of each subregion. We try to reduce the impact by calculating the
average value of three Dice loss functions for three output channels (predictions
for each subregion), instead of calculating the Dice loss for the entire predictions
directly. For the regularization part, L2 loss displays on the entire predictions
and is assigned a hyper-parameter weight to prevent overfitting.

2.4   Training Configuration

BraTS 2019 dataset contains non-standardized 3D images with the size of 250 ×
250 × 155. Since the data is from different institutes, the value could vary due to
different MRI machines or configurations. To ease these impacts and reduce the
initial bias caused by the variations of cases, z-score standardization transform
is applied to each of the four image modalities before concatenating them into
an input with four channels. Then we reassigned four different labels (label 0,
label 1, label 2, label 4) of ground truth into three combined subregions (see
Figure 3), representing enhancing tumor (label 4), tumor core (label 1 + label
4) and whole tumor (label 1 + label 2 + label 4), respectively, to optimize the
segmentation accuracy for each region independently in the model. Therefore,
the final layer of the network has three channels for the three subregions and we
use sigmoid instead of softmax to output the segmentation predictions.
    The network is implemented in Pytorch and trained using Adam optimizer
with the learning rate of 3e-4. We run our operations parallelly on two GPUs
(GeForce GTX 1080 Ti: 11G; TITAN Xp: 12G). In order to fit the capability of
our network within GPU memory limits, we cropped all the data into a size of
192 × 192 × 128, and then extracted three smaller overlapping volumes (192 ×
192 × 64) by the stride of 32 in the third dimension. Partitioning images with
overlapping area served as a type of data augmentation that ensures the seamless
cohesion of separated small volumes, preventing information loss due to cropping.
The batch size is 4 and trained the network for 100 epochs (335 cases for each
epoch), taking 16 hours in total.
DDU-Nets: Distributed Dense Model for 3D MRI Brain Tumor Segmentation 7
2.5 Postprocessing
In some of the low grade gliomas (LGG) cases, there is no existence of enhancing
tumor while the model may infer as existing, causing large error in Dice coeffi-
cient. Thus, if the number of voxels classified as the segmented enhancing tumor
(ET) is less than 300 in a single case, those voxels are regarded as false-positive
for ET (label 4) and replaced with the label of necrotic and non-enhancing tumor
parts (label 1). Some independent small volumes disconnected with the largest
tumor area are removed by connected component processing. If the voxel number
of each small component is less than 30 percent of the total number of predicted
class, those components were re-labeled as background.
3 Results
The proposed models are trained on the BraTS 2019 training dataset (335 cases)
and initially evaluated on the validation dataset (125 cases). All the predicted
results after reconstruction and post-processing are uploaded for the generaliz-
ability assessments by CBICA’s Image Processing Portal (IPP). Example seg-
mentation results are shown in Figure 3.
Fig. 3. Visualization results of two examples using DDU-Net (cross-skip) with corre-
sponding FLAIR slices, T1ce slices and ground truth on BraTS 2019 Training dataset.
Yellow: enhancing tumor (label 4); Red: necrotic and non-enhancing tumor core (label
1); Green: peritumoral edema (label 2).
The performance of proposed models is evaluated and compared with base-
lines (U-Net and DU-net) by Dice score, Sensitivity, Specificity and Hausdorff
distance (95%) for all subregions. Four metric average results of three subregions
on the BraTS 2019 validation dataset are presented in Table 1.
To illustrate the effectiveness of postprocessing method, experiments on U-
Net have been conducted. The results are shown in Table 1 (the 1st and the 2nd
row). Comparing their performance on metrics, the effectiveness of the method8 Hanxiao Zhang et al.
Table 1. Models evaluated (mean value) on BraTS 2019 validation dataset. ET, WT
and TC denote enhancing tumor, whole tumor and tumor core, respectively. P, cs,
s1, s2 stand for postprocessing, cross-skip, skip-1, skip-2. DU-Net (dense U-Net) is an
integrated model of the traditional dense connection and U-Net.
Dice score Sensitivity Specificity 95 Hausdorff
Models ET WT TC ET WT TC ET WT TC ET WT TC
U-Net 0.744 0.893 0.765 0.740 0.883 0.763 0.997 0.995 0.997 4.712 6.279 8.146
U-Net+P 0.776 0.894 0.768 0.795 0.883 0.770 0.998 0.995 0.997 3.470 4.968 7.882
DU-Net+P 0.767 0.887 0.773 0.758 0.883 0.763 0.998 0.995 0.997 3.843 5.908 7.989
DDU-Net(cs)+P 0.780 0.898 0.793 0.791 0.903 0.808 0.998 0.994 0.996 3.376 4.874 8.013
DDU-Net(s1)+P 0.765 0.898 0.793 0.787 0.905 0.820 0.998 0.994 0.996 4.058 5.225 8.127
DDU-Net(s2)+P 0.784 0.897 0.794 0.804 0.888 0.791 0.998 0.995 0.997 4.099 4.950 7.399
is evident, especially for enhancing tumor. To explore the effects of DDCs, de-
tailed experiments have been operated on each DDU-Net. Compared with U-Net
baseline and dense U-net (DU-Net) using dense connection to bridge over fea-
tures, the results show that the performance of the DDU-Nets surpasses that of
baselines on Dice score and sensitivity in most of the subregions. Although DU-
Net possesses the highest feature reuse rate, the redundant architecture makes it
difficult to achieve better performance than that of the DDU-Nets, which reuse
fewer features but achieve great improvement. For each model, Specificity has
no obvious difference.
Within the DDU-Net models, different architectures dictate the relative per-
formance that each metric of subregions displays. Cross-skip excels at edge char-
acterization due to the global feature reuse of the localization information pro-
vided by original images. Skip-1 has the advantage in terms of Sensitivity at
the expense of low Dice score in enhancing tumor. Skip-2 achieves a good re-
sult in Dice score, with a low feature reuse rate because of the specific design of
DDU-Net (skip-2) that preserving neighborhood information in an adequate skip
distance (2 stages). Overall, DDU-Nets with cross-skip pattern can be considered
to acquire the best comprehensive performance with an easy model deployment.
Table 2. Performances (mean value) of DDU-Net (cross-skip) with different architec-
tures on BraTS 2019 validation dataset.
Dice Sensitivity Specificity 95 Hausdorff
Method ET WT TC ET WT TC ET WT TC ET WT TC
Stage 5 0.782 0.896 0.784 0.812 0.905 0.799 0.998 0.994 0.996 4.392 5.616 8.023
Ch 64 0.772 0.873 0.786 0.780 0.935 0.817 0.998 0.988 0.995 4.699 7.984 8.260
Vol 128 0.674 0.862 0.640 0.661 0.872 0.617 0.999 0.993 0.997 6.370 6.379 10.846
Final 0.780 0.898 0.793 0.791 0.903 0.808 0.998 0.994 0.996 3.376 4.874 8.013
Apart from the approaches mentioned above, other potential architectures
and postprocessing methods also deployed during our experiments. As Table
2 shown, we attempted to allocate DDU-Net (cross-skip) with more stages (5DDU-Nets: Distributed Dense Model for 3D MRI Brain Tumor Segmentation 9
stages) and feature channels (start with 64 channels in the first stage), but all led
to worse results in general, which proves that the distributed dense connections
can contribute better performance as well as decreasing in network depth and
width. We tried to input with the larger volumes (192×192×128) without further
cropping, but it didn’t show better results as well. We also denied the opening
operation solution used to denoise for the postprocessing which is replaced by
connected component processing. Compared with those alternatives, the final
proposed architecture achieved the best performance by balancing among the
size of input data, the capability of network and the GPU memory consumption.
Table 3. Performance of DDU-Net (cross-skip) with postprocessing on BraTS 2019
testing dataset.
Dice 95 Hausdorff
ET WT TC ET WT TC
Mean 0.804 0.876 0.821 3.41 7.054 6.774
StdDev 0.193 0.117 0.237 7.44 11.600 13.238
Median 0.846 0.917 0.908 1.732 3.535 3.000
25quantile 0.774 0.854 0.836 1.414 2.236 1.946
75quantile 0.916 0.943 0.948 2.639 5.916 5.745
Table 3 presents mean value, standard deviation, median, 25 and 75 quantiles
of two metrics on BraTS 2019 testing dataset (166 cases). Due to limited one
submission chance, we only evaluated DDU-Net (cross-skip) on testing dataset.
The results demonstrate that the performance of this model is highly compet-
itive, with mean Dice scores of 0.804, 0.876, and 0.821 for enhancing tumor,
whole tumor and tumor core, respectively.
4 Conclusion
In conclusion, this paper has shown a new network structure for brain tumor
segmentation. Three distributed dense connections (DDCs) have been proposed
for generic CNNs to inherit features efficiently. DDU-Nets are built to verify
the effectiveness of DDCs. Postprocessing is deployed to eliminate false-positive
pixels. The results show that the DDU-Nets can segment 3D MR images effec-
tively by allocating DDCs to key layers, among which DDU-Net with cross-skip
pattern achieved the competitive performance.
References
1. Bakas, S., Akbari, H., Sotiras, A., Bilello, M., Rozycki, M., Kirby, J., Freymann,
J., Farahani, K., Davatzikos, C.: Segmentation labels and radiomic features for the
pre-operative scans of the tcga-gbm collection. the cancer imaging archive (2017)
(2017)10 Hanxiao Zhang et al.
2. Bakas, S., Akbari, H., Sotiras, A., Bilello, M., Rozycki, M., Kirby, J., Freymann,
J., Farahani, K., Davatzikos, C.: Segmentation labels and radiomic features for the
pre-operative scans of the tcga-lgg collection. The Cancer Imaging Archive 286
(2017)
3. Bakas, S., et al.: Advancing the cancer genome atlas glioma mri collections with
expert segmentation labels and radiomic features. In: Scientific data (2017)
4. Bakas, S., et al.: Identifying the best machine learning algorithms for brain tumor
segmentation, progression assessment, and overall survival prediction in the brats
challenge. arXiv preprint arXiv:1811.02629 (2018)
5. Cao, H., Bernard, S., Heutte, L., Sabourin, R.: Improve the performance of trans-
fer learning without fine-tuning using dissimilarity-based multi-view learning for
breast cancer histology images. In: International Conference Image Analysis and
Recognition. pp. 779–787. Springer (2018)
6. Dong, H., Yang, G., Liu, F., Mo, Y., Guo, Y.: Automatic brain tumor detection and
segmentation using u-net based fully convolutional networks. In: annual conference
on medical image understanding and analysis. pp. 506–517. Springer (2017)
7. He, K., Zhang, X., Ren, S., Sun, J.: Deep residual learning for image recognition. In:
Proceedings of the IEEE conference on computer vision and pattern recognition.
pp. 770–778 (2016)
8. Huang, G., Liu, Z., Van Der Maaten, L., Weinberger, K.Q.: Densely connected
convolutional networks. In: Proceedings of the IEEE conference on computer vision
and pattern recognition. pp. 4700–4708 (2017)
9. Isensee, F., Kickingereder, P., Wick, W., Bendszus, M., Maier-Hein, K.H.: No new-
net. In: International MICCAI Brainlesion Workshop. pp. 234–244. Springer (2018)
10. Larsson, G., Maire, M., Shakhnarovich, G.: Fractalnet: Ultra-deep neural networks
without residuals. arXiv preprint arXiv:1605.07648 (2016)
11. Li, X., Chen, H., Qi, X., Dou, Q., Fu, C.W., Heng, P.A.: H-denseunet: hybrid
densely connected unet for liver and tumor segmentation from ct volumes. IEEE
transactions on medical imaging 37(12), 2663–2674 (2018)
12. Mamelak, A.N., Jacoby, D.B.: Targeted delivery of antitumoral therapy to glioma
and other malignancies with synthetic chlorotoxin (tm-601). Expert opinion on
drug delivery 4(2), 175–186 (2007)
13. Menze, B.H., Jakab, A., Bauer, S., Kalpathy-Cramer, J., Farahani, K., Kirby, J.,
Burren, Y., Porz, N., Slotboom, J., Wiest, R., et al.: The multimodal brain tumor
image segmentation benchmark (brats). IEEE transactions on medical imaging
34(10), 1993–2024 (2014)
14. Myronenko, A.: 3d mri brain tumor segmentation using autoencoder regularization.
In: International MICCAI Brainlesion Workshop. pp. 311–320. Springer (2018)
15. Pleiss, G., Chen, D., Huang, G., Li, T., van der Maaten, L., Weinberger, K.Q.:
Memory-efficient implementation of densenets. arXiv preprint arXiv:1707.06990
(2017)
16. Ronneberger, O., Fischer, P., Brox, T.: U-net: Convolutional networks for biomedi-
cal image segmentation. In: International Conference on Medical image computing
and computer-assisted intervention. pp. 234–241. Springer (2015)You can also read


