Influence of Spatial Distribution on the Regeneration of Piptadeniastrum africanum and Ocotea usambaernsis in Kalikuku, Lubero, North Kivu ...
←
→
Page content transcription
If your browser does not render page correctly, please read the page content below
Open Journal of Ecology, 2021, 11, 527-539
                                                                                                  https://www.scirp.org/journal/oje
                                                                                                             ISSN Online: 2162-1993
                                                                                                               ISSN Print: 2162-1985

Influence of Spatial Distribution on the
Regeneration of Piptadeniastrum africanum
and Ocotea usambaernsis in Kalikuku, Lubero,
North Kivu, Democratic Republic of Congo

Lutumba Suika Achille1, Kebin Zhang1*, Kambale Muhesi Eloge2,
Christian Jonathan Anona Kouassi1, Mbangilwa Mukombe Michel3
1
  College of Soil and Water Conservation, and Desertification Combating, Beijing Forestry University, Beijing, China
2
  Institut Supérieur d’Etudes Agronomiques, Vétérinaires et Forestières de Butembo, Butembo, Democratic Republic of Congo
3
  Key Laboratory of Sustainable Forest Ecosystem Management, Ministry of Education, School of Forestry, Northeast Forestry
University, Harbin, China

How to cite this paper: Achille, L.S., Zhang,     Abstract
K.B., Eloge, K.M., Kouassi, C.J.A. and Mi-
chel, M.M. (2021) Influence of Spatial Dis-       The aim of our study is to highlight the spatial structure of the trees and to
tribution on the Regeneration of Piptade-         determine its influence on the natural regeneration of the Kalikuku dense
niastrum africanum and Ocotea usambaern-
                                                  forest, with a view of its optimal conservation and enhancement. Data collec-
sis in Kalikuku, Lubero, North Kivu, Dem-
ocratic Republic of Congo. Open Journal           tion was done by measuring diameter at breast height along 10 plots of 0.5 ha
of Ecology, 11, 527-539.                          in size. In analyzing these data, the Dajoz test was used to determine the ho-
https://doi.org/10.4236/oje.2021.117034           rizontal spatial distribution pattern of the two most abundant tree species in
Received: June 18, 2021
                                                  the forest (Piptadeniastrum africanum and Ocotea usambarensis). The χ2 test
Accepted: July 17, 2021                           was used to compare the frequency distribution of diameter classes for the
Published: July 20, 2021                          two species tested. To estimate the difference between the number of seedl-
                                                  ings in aggregate versus non-aggregate areas, the Wilcoxon signed-rank test
Copyright © 2021 by author(s) and
Scientific Research Publishing Inc.               was used. In addition, the equability index was used to test the preponderance
This work is licensed under the Creative          of proportions between diameter classes. Finally, the natural regeneration in-
Commons Attribution International                 dex was evaluated.
License (CC BY 4.0).
http://creativecommons.org/licenses/by/4.0/
                Open Access
                                                  Keywords
                                                  Spatial Distribution, Natural Regeneration, Seedlings, Diameter Class

                                                1. Introduction
                                                In a forest, the spatial structure of the trees depends on their density and hori-

DOI: 10.4236/oje.2021.117034          Jul. 20, 2021                 527                                     Open Journal of Ecology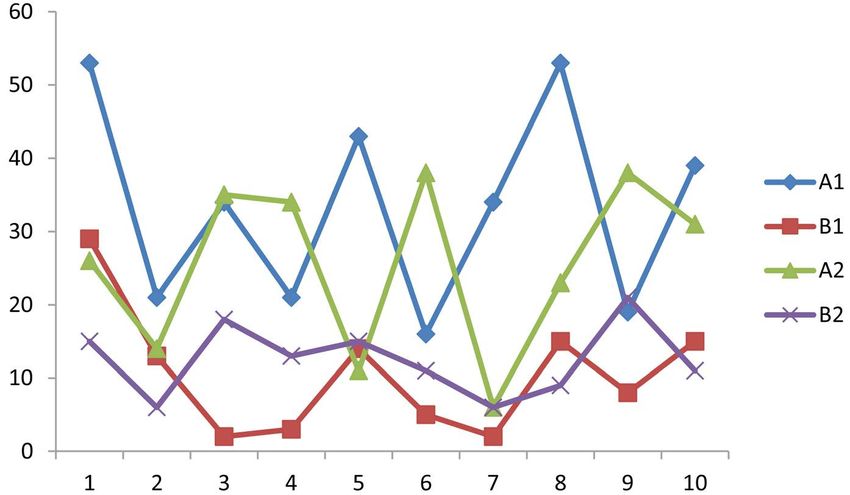
L. S. Achille et al.

                               zontal distribution, which can be random, aggregated or uniform [1] [2]. Natu-
                               ral regeneration is achieved by vegetative propagation through offshoots from
                               existing stumps and by germination of seeds from mature trees [3].
                                  [4] shows that spatial structure and natural regeneration of trees are intimate-
                               ly linked and play an important role in forest dynamics. In addition, human
                               disturbances affect the spatial structure and natural regeneration of trees.
                                  Regeneration is therefore the basis of the dynamic and demographic balance
                               of plant populations, ensuring the renewal of individuals and the sustainability
                               of species [5].
                                  These are the uncontrolled removal of forest resources, extensive agriculture
                               and forest fires that [6] and [7] consider being the most harmful given the fre-
                               quency and extent that they affect in a short period of period.
                                  The present study focuses on the dense forest of Kalikuku Reserve, which has
                               enjoyed “protected area” (Nature Reserve) status since 1952 [8].
                                  As this forest is surrounded by the villages of Vwandanze, Kimbulu and the
                               agglomeration of Lubero, the local populations cannot help but illegally harvest
                               the various forest resources they need. Its conservation is thus compromised. In
                               development and sustainable management of natural forest ecosystems and the
                               Kalikuku dense forest in particular, this study is therefore necessary.
                                  The central hypothesis to be tested in this research is that the spatial distribu-
                               tion pattern of the trees influences the natural regeneration of Kalikuku dense
                               forest.
                                  The aim of this study is multiple. The main purpose is to determine the den-
                               sity of trees in the Kalikuku dense forest, to analyze their horizontal spatial dis-
                               tribution, to show the effect of the spatial pattern found on the number of seedl-
                               ings and to evaluate the state of natural regeneration of the main tree species, in
                               this case the first two most abundant tree species in this forest.

                               2. Methods
                               2.1. Study Site
                               Geographically, the Kalikuku Forest Reserve is located 7 km from the chief town
                               of Lubero Territory, Baswagha Chiefdom, Lubero Territory, North Kivu Prov-
                               ince in the Democratic Republic of Congo. It extends to the West on the Bu-
                               tembo - Goma road, in the Luongo Grouping with an updated surface area of 89
                               ha, Diversity Components: Richness = 4 Evenness = 0.21 (Figure 1 [9] [10]
                               [11]).
                                 Like Lubero and its surroundings, this reserve is between 29˚30' Longitude
                               East, 00˚30' Latitude South, with an altitude varying between 1830 m and 2000
                               m, thus forming part of the highlands of Lubero territory [12].
                                 The dense forest of Kalikuku enjoys a tropical climate of Af type [13]. It cov-
                               ers an area of approximately 89 ha spread over a hilly terrain whose highest peak
                               reaches 2000 m. The soils of the Beni-Lubero region are derived from the be-
                               drock that is mostly clayey. It appears from this work that the soils of the highlands

DOI: 10.4236/oje.2021.117034                        528                                      Open Journal of Ecology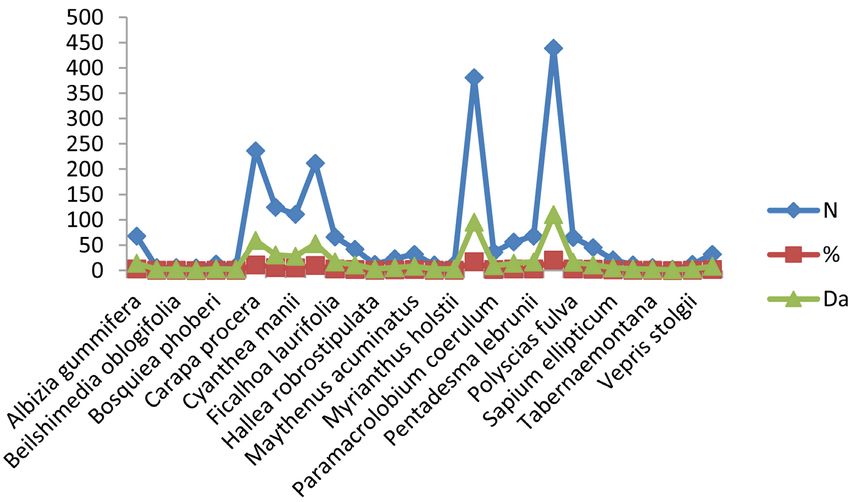
L. S. Achille et al.

Figure 1. Kalikuku forest reserve.

                                     in the extreme of North Kivu are essentially clayey and weakly ferritic, crystal-
                                     line terrains of the Lower Cambrian [14].
                                        These different streams are: Kalikuku, Lusimi, Makanga, Kyamasamba, Ki-
                                     huko, Mupa, and Vwandanzi stream. The average annual rainfall is 1750 mm
                                     [15].

                                     2.2. Sampling Method
                                     To establish the list of tree species and their density in Kalikuku dense forest,
                                     data collection was carried out by measuring diameter at breast height (dhp).
                                     However, only data with dhp ≥ 10 cm [16] were kept for further analysis under
                                     [17]. These measurements were made along 10 plots spread over a 2000 m long
                                     layon through the forest in agreement with [18]. The width of a plot is 20 m
                                     while the length was 250 m. For each plot, counts of seedlings (dhp < 10 cm) of
                                     each of the more abundant tree species were also made in aggregate (A) and
                                     non-aggregate (B) areas. Next, we counted the number of tree seedlings in all
                                     plots for the respective species.
                                        Thus, the seedling count was conducted in these two plots to have paired or
                                     matched samples. The identification of tree species was based on the nomencla-
                                     ture of [19].

                                     2.3. Data Analysis Method
                                     In terms of the horizontal spatial distribution of trees, [1] [2] distinguish three
                                     horizontal spatial models: the random horizontal spatial model when, given the
                                     location of an individual, the probability that another individual will be found in
                                     its vicinity is unaffected; the aggregated horizontal spatial model when this
                                     probability is increased; and the uniform horizontal spatial model when this
                                     probability is reduced. In this study, the horizontal spatial distribution model of
                                     the trees was tested and confirmed by the method of [20] (Da) adapted to small
                                     samples. This test was applied based on the number of trees counted on an equal
                                     inventory area for all 10 plots (10 = pn). Further analysis was given by the values
                                     of λ = 2 σ/m; 2 σ being the variance and m the arithmetic mean. With a uniform

DOI: 10.4236/oje.2021.117034                              529                                    Open Journal of Ecology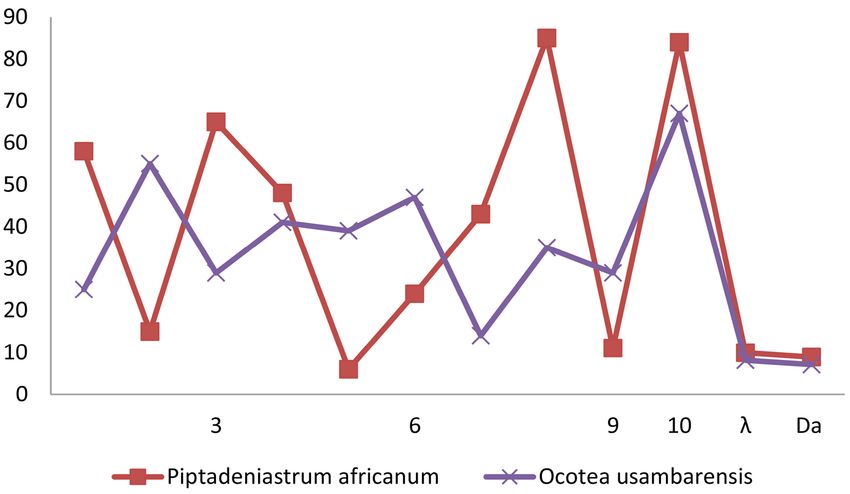
L. S. Achille et al.
distribution, λ < 1; in a random distribution λ ≈ 1; and in an aggregated distri-
bution, λ > 1.
The value of λ varies, for a probability rate, between confidence limits that are
a function of the number of samples np. The deviation from unity of λ is signifi-
cant for α = 0.05 where Da > β (in this case, Da = λ − 1 and
β 2
= ( 2 × np ) × ( np − 1) −=
1 0.9 ).
The effect of aggregates on the number of seedlings was determined using the
Wilcoxon signed-rank test (W) [21]. This test is most appropriate for comparing
paired or paired numbers in this case, the numbers of tree seedlings counted in
aggregate and non-aggregate areas of the same transect.
Regeneration status was determined by analyzing the diametric distribution of
individual trees into diameter classes according to the [16] rule. To test this
state, the equitability index (R) and the χ2 test were applied [21] [22] [23]. The
value of R is given by the formula below [Equation (1)]:
R = H H max (1)
where H corresponds to the Shannon-Weaver diversity index (observed diversi-
ty)
Hmax corresponds to the theoretical maximum diversity calculated assuming
frequency of biological traits.
Finally, the value of the natural regeneration index (Rn) was determined by
the ratio of the proportion of seedlings (dhp < 10 cm) to other three individuals
(dhp ≥ 10 cm). According to [24], if the value of this index is less than unity, the
population is in deficit; if it is greater than or equal to unity; the population is
balanced, i.e., in terms of the distribution of tree individuals in diameter classes,
the numbers continue to decrease as one moves from the lower to the higher
diameter class.
3. Results
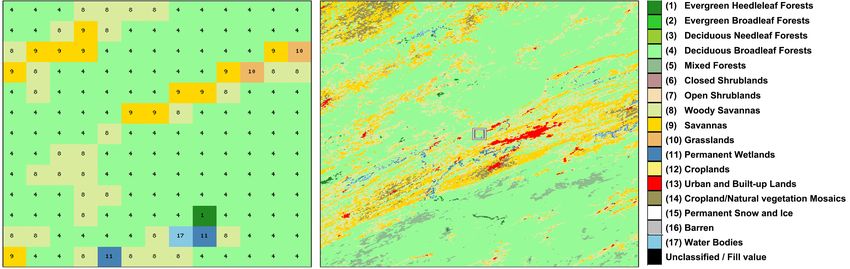
Figure 2 illustrates the evolution of NDVI, EVI and LST of day and night in Ka-
likuku reserve from 2000 to 2021 dominated by a woody savanna.
3.1. Analysis of Tree Species Density in Kalikuku Dense Forest
In Kalikuku Dense Forest, 2169 individual trees of 30 species were identified.
Table 1 and Figure 3 present the list and density of these identified species. The
average density of trees in Kalikuku dense forest is 541 feet/ha. The two most
represented species are Piptadeniastrum africanum and Ocotea usambarensis,
whose relative abundance is 20.3% and 17% respectively, with a density of 439
and 311 trees/ha, respectively.
3.2. Analysis of the Horizontal Spatial Distribution Pattern of
Trees
Table 2 shows the number of individual trees for each of the three most abun-
dant species on the same 0.5 ha inventory area in the 10 plots surveyed. It also
DOI: 10.4236/oje.2021.117034 530 Open Journal of Ecology
L. S. Achille et al.

Figure 2. Evolution of NDVI, EVI and LST in Kalikuku (source: [9] [10] [11]).

                                       Table 1. List of tree species identified and their density in Kalikuku dense forest. N:
                                       number of trees per species; Da: density (number of trees/ha).

                                                           Species                       N             %              Da
                                                      Albizia gummifera                 68.0           3.1            14
                                                   Anthochleista grandifolia             6.0           0.3             2
                                                   Beilshimedia oblogifolia              6.0           0.3             2
                                                     Bersama abyssinica                  5.0           0.2             1
                                                      Bosquiea phoberi                  13.0           0.6             3

DOI: 10.4236/oje.2021.117034                                   531                                    Open Journal of Ecology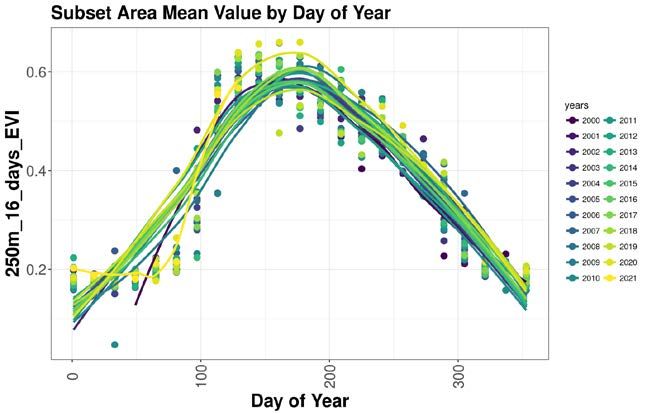
L. S. Achille et al.

                               Continued
                                              Bridelia micrantha                     8.0            0.4                2
                                                Carapa procera                      236.0          10.9            59
                                                Cathas edulis                       125.0           5.8            31
                                               Cyanthea manii                       111.0           5.1            28
                                              Dialium corbisieri                    212.0           9.8            53
                                              Ficalhoa laurifolia                   66.0            3.1            17
                                              Grewia milbraedii                     42.0            1.9            11
                                             Hallea robrostipulata                  12.0            0.6                3
                                                   Ilex mitis                       23.0            1.1                6
                                            Maythenus acuminatus                    32.0            1.5                8
                                            Musanga cecropioides                    11.0            0.5                3
                                              Myrianthus holstii                    12.0            0.6                3
                                             Ocotea usambarensis                    381.0          17.6            95
                                          Paramacrolobium coerulum                  36.0            1.7                9
                                               Parinaria holstii                    56.0            2.6            14
                                             Pentadesma lebrunii                    68.0            3.1            17
                                             Piptadenia africanum                   439.0          20.3            110
                                                Polyscias fulva                     65.0            3.0            16
                                           Rapanea melonophloeria                   45.0            2.1            11
                                              Sapium ellipticum                     21.0            1.0                5
                                              Syzygium guinense                     11.0            0.5                3
                                              Tabernaemontana                        6.0            0.3                2
                                              Trema guineensis                       2.0            0.1                1
                                                 Vepris stolgii                     12.0            0.6                3
                                             Xymalos monospora                      32.0            1.5                8
                                                     Total                         2163.0          100.0           541

                               Figure 3. List of tree species identified and their density in Kalikuku dense forest.

DOI: 10.4236/oje.2021.117034                           532                                         Open Journal of Ecology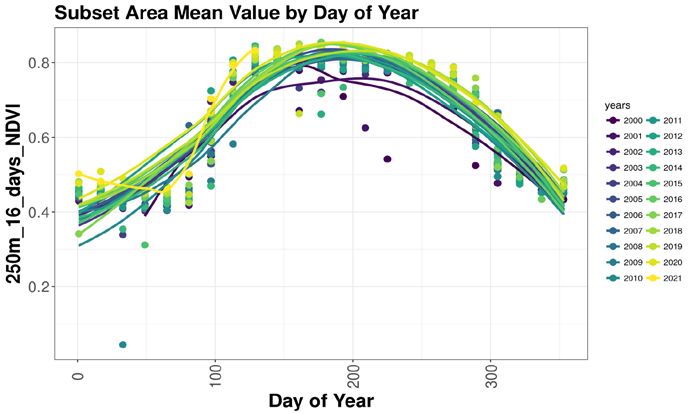
L. S. Achille et al.

                               shows the test of the horizontal spatial distribution model according to [25]
                               (Da). Individuals of the main tree species in Kalikuku dense forest are spatially
                               distributed according to the aggregated model. Indeed, λ > 1 for all three species
                               tested. For α = 0.05, this deviation from unity is significant given that Da values
                               are well above β, i.e. Da > 0.9 (Table 2 and Figure 4).

                               3.3. Comparison of Seedling Numbers in Aggregate and
                                    Non-Aggregate Areas
                               Table 3 and Figure 5 present the number of seedlings counted in aggregate and
                               non-aggregate areas for the three most abundant tree species in Kalikuku dense
                               forest (Piptadeniastrum africana and Ocotea usambarensis). Seedlings are more
                               abundant in aggregate areas than in non-aggregate areas. This difference is con-
                               firmed by the Wilcoxon signed-rank test (W) which shows that for both species
                               tested, the value of W is less than the value of W0.05 = 17. Thus, there is a sig-
                               nificant difference between the number of seedlings in aggregate and non-aggregate
                               areas. The influence of spatial structure on the natural regeneration of Kalikuku
                               dense forest is therefore confirmed.

                               Table 2. Number of individuals for the three most abundant two species in Kalikuku
                               Forest. χ1 to χ10: number of individuals; λ: ratio of variance to arithmetic mean; Da: test
                               for horizontal spatial distribution model.

                                       Species/Plot             χ1   χ2    χ3   χ4   χ5   χ6       χ7   χ8   χ9     χ10    λ     Da

                                Piptadeniastrum africanum       58   15    65   48   6    24       43   85   11      84    9.9   8.9

                                   Ocotea usambarensis          25   55    29   41   39   47       14   35   29      67    8.1   7.1

                               Table 3. Number of seedlings in aggregate (A) and non-aggregate (B) areas.

                                           Piptadeniastrum africanum                               Ocotea usambarensis

                                         A1                           B1                   A2                        B2

                                          53                          29                   26                        15

                                          21                          13                   14                         6

                                          34                          2                    35                        18

                                          21                          3                    34                         13

                                          43                          14                   11                         15

                                          16                          5                    38                         11

                                          34                          2                        6                      6

                                          53                          15                   23                         9

                                          19                          8                    38                         21

                                          39                          15                   31                         11

                                         296                         143                  186                        195

                                                      W = 8.2                                           W = 7.5

DOI: 10.4236/oje.2021.117034                           533                                              Open Journal of Ecology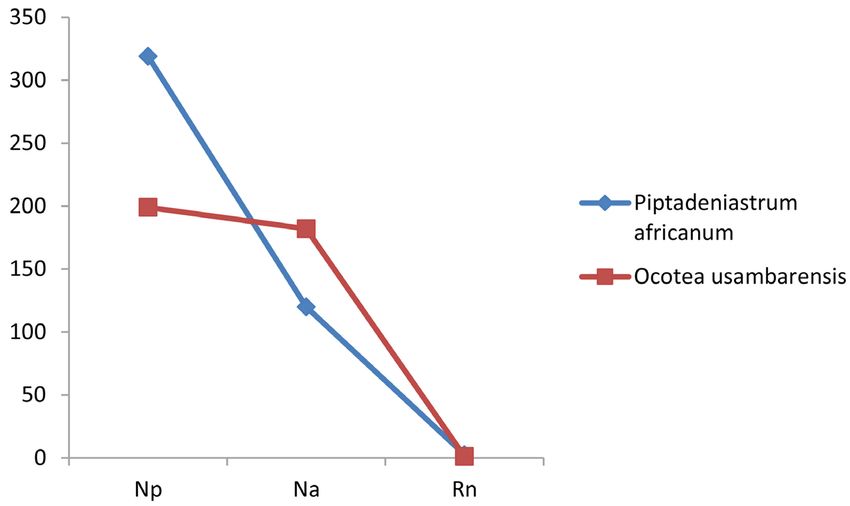
L. S. Achille et al.

                               Figure 4. Number of individuals for the three most abundant two species in Kalikuku forest.

                               Figure 5. Seedlings in aggregate (A) and non-aggregate (B) areas.

                               3.4. Analysis of Natural Regeneration in Kalikuku Dense Forest
                               The values of the equitability index confirm that for both species, the seedling
                               class (dhp < 10 cm) contains more individuals than the other diameter classes. In-
                               deed, this index is equivalent to R = 0.14 for Piptadeniastrum africana and R = 0.12
                               for Ocotea usambarensis. Thus, the diameter class does not share equally the pro-
                               portions of tree individuals because these values of the equitability index are close
                               to zero. Furthermore, comparative analysis of the distribution of the proportions
                               of the frequencies of the different diameter classes for the two tree species indi-
                               cates that there is no significant difference as χ2 = 3.1 (p > 0.05). Furthermore,
                               the values of the natural regeneration index reflect the state of equilibrium of the
                               Kalikuku dense forest as they are greater than unity for all the species analyzed.
                               Indeed, for Piptadeniastrum africana, Rn = 2.6 and for Ocotea usambarensis, Rn
                               = 1.1 (Table 4 and Figure 6).

DOI: 10.4236/oje.2021.117034                          534                                          Open Journal of Ecology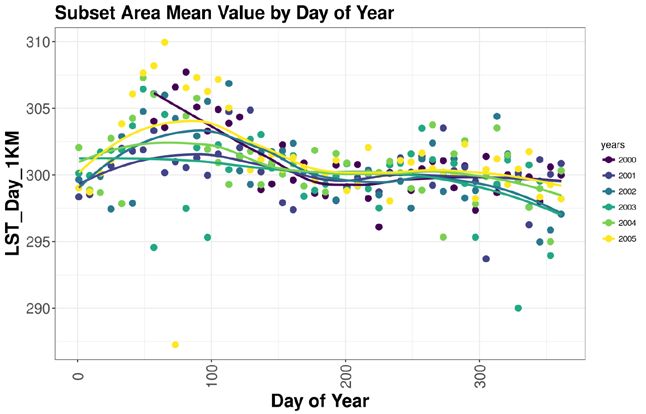
L. S. Achille et al.

                               Table 4. Regeneration index values for the two most abundant two species in Kalikuku
                               dense forest. Np: number of seedlings (dhp < 10 cm); Na: number of mature trees (dhp ≥
                               10 cm); Rn: natural regeneration index.

                                                   Species                         Np           Na              Rn

                                          Piptadeniastrum africanum                319          120             2.6

                                             Ocotea usambarensis                   199          182             1.1

                               Figure 6. Regeneration index values for the two most abundant two species in Kalikuku
                               dense forest.

                               4. Discussion
                               In the Kalikuku dense forest, the analysis of tree density confirms the observa-
                               tions of [26] on the preponderance of Piptadeniastrum, Carapa and Ocotea spe-
                               cies in Afromontane forests. Furthermore, the density recorded (541 plants/ha)
                               is lower than the average of 600 plants/ha observed in other dense forests of the
                               Guineo-Congolese domain, notably by Lebrun [19]. This indicates that the Ka-
                               likuku forest is at a less advanced stage of evolution than those described by [27]
                               [28].
                                  In fact, the younger the dense forest, the more it presents numerous shrubs
                               that are not widely spaced, which is the opposite for an old stand with large,
                               widely spaced trees. This density obtained remains, however, in the same order
                               of magnitude generally obtained in tropical Africa where the density of trees in
                               the various inventories varies between 368 and 645 feet/ha [29].
                                  The distribution of trees in diameter classes follows a regularly decreasing
                               trend, with a maximum in the first diameter classes. A similar conclusion was
                               reached in the Dja Faunal Reserve in Cameroon by [29]. In nature, such a di-
                               ametric distribution reflects a state of equilibrium [30], which is itself syn-
                               onymous with good natural regeneration [5]. This shows that, thanks to the
                               growth of numerous seedlings and via their recruitment into the higher diameter
                               classes [31], the Kalikuku forest will be maintained.
                                  The analysis of the horizontal spatial distribution by the test [20] shows that

DOI: 10.4236/oje.2021.117034                        535                                      Open Journal of Ecology
L. S. Achille et al.
the individuals of the trees in Kalikuku dense forest are distributed in an aggre-
gated way. This aggregated spatial structure in turn influences the state of natu-
ral regeneration in this forest. The state of balanced regeneration is confirmed by
Rn values that are all above unity [24]. Ecologically, the observed aggregation of
trees can be explained either by the variation or heterogeneity of environmental
characteristics, or by the genetic characteristics and behavior of living beings of
the same species that often tend to group together [1] [2] [25]. In Kalikuku, the
aggregated pattern of spatial distribution of trees is explained by variation in soil
characteristics. The soil is silty in structure on the hilltops, whereas it is relatively
deep and fine on the slopes and towards the lowlands.
In addition, the spatial structure determines the local environment around
each tree (in particular the number of neighbors) and thus its growth conditions.
This local environment modifies the expression of natural processes such as
growth, mortality and regeneration of the stand; this can lead to a local monos-
pecific composition [32]. This trend is confirmed for the Kalikuku dense forest
in which all the two most abundant tree species are of different genera.
These authors point out that density is a particularly important concept in
forest management because it provides information on the degree of occupation
of space by the stand. In the case of the Kalikuku dense forest, the fact that there
is a balance in natural regeneration means that it is not necessary to introduce
other species for restocking. Furthermore, the density of 541 trees/ha is within
the range known in tropical Africa [29]. However, this density of trees observed
in the Kalikuku dense forest shows that there is intense competition between
these trees for resources.
The behavior of the juvenile stage of the Kalikuku rainforest provides more
information about the future of this ecosystem. Indeed, the regeneration of a tree
species is subject to the density and spatial distribution of individuals [33]. Thus,
the preponderant proportion of seedlings found in the Kalikuku dense forest is a
sign of a balanced regeneration. This conclusion corroborates the observations
of [34]-[40].
5. Conclusion
We note that the aggregated horizontal spatial structure of the trees in the Kali-
kuku dense forest favors natural regeneration in a balanced state despite the
many factors of disturbance of anthropic origin that are exerted on this ecosys-
tem. The present analysis constitutes an important argument in favor of taking
integral protection measures to maintain the good natural regeneration of this
forest. It is therefore not possible to introduce species by reforestation in the Ka-
likuku dense forest. These protection measures would focus on maintaining the
integrity of the forest, in particular by preserving it from any action that could
disturb the spatial structure of the trees, such as logging and clearing.
Funded
The paper was funded by “13.5” National Key Research Project No.
DOI: 10.4236/oje.2021.117034 536 Open Journal of EcologyL. S. Achille et al.
2016YFC0500908 in right place.
Conflicts of Interest
The authors declare no conflicts of interest regarding the publication of this pa-
per.
References
[1] Bütler, R. (2000) Analyse de la distribution spatiale d’objets dans un paysage. Fiche
d’enseignement, Laboratoire de gestion des écosystèmes (GECOS), Lausanne, 18 p.
[2] Dale, M.R.T. (2000) Spatial Pattern Analysis in Plant Ecology. Cambridge Universi-
ty Press, 326 p. https://doi.org/10.1017/CBO9780511612589
[3] Piug, H. (2001) Diversité spécifique et déforestation: Exemple des forêts tropicales
humides du Mexique. Bois et forêts des tropiques, 268, 20-37.
https://doi.org/10.19182/bft2001.268.a20102
[4] Vande Weghe, J.P. (2004) Forêts d’Afrique Centrale. La Nature et l’Homme. Edi-
tions Lannoo SA, Tielt-Belgique, 367 p.
[5] Boyemba (2006) Diversité et régénération des essences forestières exploitées dans
les forêts des environs de Kisangani (RDC). Mémoire inédit, faculté des sciences,
Université Libre de Bruxelles, Bruxelles, 101 p.
[6] Forman, R.T.T. and Godron, M. (1986) Landscape Ecology. John Wiley and Sons,
New York, 619 p.
[7] Bradstock, R.A., Williams, J.E. and Gill, A.M. (Eds.) (2002) Flammable Australia.
The Fire Regimes and Biodiversity of a Continent. Cambridge University Press,
Melbourne, 488 p.
[8] Nduire (2007) La détermination de différentes contraintes de la production de la
culture de maïs en cité de Lubero et ses environs. Nordkivu, République Démocratique
du Congo.
[9] Oak Ridge National Laboratory (ORNL) DAAC (2018) MODIS and VIIRS Land
Products Global Subsetting and Visualization Tool. Oak Ridge National Laboratory
(ORNL) DAAC, Oak Ridge. https://doi.org/10.3334/ORNLDAAC/1379
[10] Hulley, G. (2017) MOD21A2 MODIS/Terra Land Surface Temperature/3-Band
Emissivity 8-Day L3 Global 1km SIN Grid V006. NASA EOSDIS Land Processes
DAAC.
[11] Didan, K. (2015) MOD13Q1 MODIS/Terra Vegetation Indices 16-Day L3 Global
250m SIN Grid V006. NASA EOSDIS Land Processes DAAC.
[12] Vyakuno, K. (2006) Pression anthropique et aménagement rationnel des hautes
terres deLubero en RDC. Rapports entre société et milieu physique dans une mon-
tagne équatoriale, Tome I, Thèse, Université de Toulouse II, Département de géo-
graphie et aménagement, Toulouse, 144.
[13] Köppen, W. (1923) Die Klimate der Erde-Gundriss der Klimakunde. Walter de
Gruyter & Co., Berlin, Leipzig, 369 p. https://doi.org/10.1515/9783111491530
[14] Malaisse, F. (1982) Evolution of the Woody Structure in a Regressive Zambezian
Succession: Dry Evergreen Forest-Open Forest-Wooded Savanna. Revue interna-
tionale de géologie, de géographie et d’écologie tropicales, 6, 4.
[15] Sahani (2011) Le contexte urbain et climatique des risques hydrologiques de la ville
de Butembo(Nord-Kivu/ RDC). Université de Liège, Collège de doctorat en Géo-
graphie, Liège, 300 p.
DOI: 10.4236/oje.2021.117034 537 Open Journal of EcologyL. S. Achille et al.
[16] Blanc, L. (1998) Les formations forestières du Parc National de Cat Tien (Viêt-Nam):
Caractérisation structurale et floristique, étude de la régénération naturelle et de la
dynamique successionnelle. Thèse de doctorat, Université Claude Bernard Lyon 1,
Villeurbanne, 207 p.
[17] Dallmeier, F. (Ed.) (1992) Long Term Monitoring of Biological Diversity in Tropi-
cal Areas: Methods for Establishment and Inventory of Permanent Plots. Man and
Biosphere Digest No. 11, United Nations Educational, Scientific and Cultural Or-
ganization, Paris, 72 p.
[18] Malaisse, F. (1974) Quelques méthodes d’étude de la structure en forêt. Exemple
d’application au miombo zaïrois, écosystème tropical. Dans: La pratique de l’écologie.
Place du champ de Mars, Bruxelles, 104-118.
[19] Lebrun, J.-P. and Stork Adélaïde, L. (1991) Enumération des plantes à fleurs
d’Afrique tropicale—Vol. 1: Généralités et Annonaceae à Pandaceae. Conservatoire
et Jardin botaniques de la Ville de Genève, Genève, 254 p.
[20] Dajoz, R. (2000) Précis d’écologie. Dunod, Paris, 615 p
[21] Scherrer, B. (2007) Biostatistique. Vol. 1, 2ème édition, Gaëtan Morin (éditeur),
Montréal, 816 p.
[22] Piélou, E.C. (1966) Species Diversity and Pattern Diversity in the Study of Ecologi-
cal Succession. Journal of Theoretical Biology, 10, 370-383.
https://doi.org/10.1016/0022-5193(66)90133-0
[23] Motulsky, H.J. (2002) Biostatistique: Une approche intuitive (Sciences et méthodes).
De Boeck Supérieur, Louvain-la-Neuve, 484 p.
[24] Havyarimana, F. (2009) Impact de la distribution spatiale des espèces arborescentes
sur la diversité végétale dans la réserve naturelle forestière de Bururi (Burundi).
Mémoire, Université Libre de Bruxelles, Belgique, 55 p. + Annexes.
[25] Dajoz, R. (2006) Précis d’écologie. 8ème édition, Dunod, Paris, 631 p.
[26] Lewalle, J. (1972) Les étages de végétation du Burundi occidental. Bulletin du Jardin
botanique National de Belgique, 42, 1-171+173-247.
https://doi.org/10.2307/3667406
[27] Riéra, B., Puig, H. and Lescure, J.P. (1990) La dynamique de la forêt naturelle. Bois
et Forêts des Tropiques, 219, 69-78.
[28] Malaisse, F. (1984) Structure d’une forêt sèche à feuillage persistant bordant le
fleuve Zambèze dans les environs de Lubumbashi (Zaïre). Bulletin de la Société
Royale Botanique de Belgique, 117, 428-458.
[29] Sonké, B. (1998) Etudes floristiques et structurales des forêts de la Réserve de Faune
du Dja (Cameroun). Thèse de doctorat, Université Libre de Bruxelles, Bruxelles, 256
p.
[30] Bouko, S.B., Sinsin, B. and Soulé, G.B. (2007) Effets de la dynamique d’occupation
du sol sur la structure et la diversité des forêts claires et savanes du Bénin. Tropi-
cultura, 25, 221-227.
[31] Riéra, B., Pélissier, R. and Houllier, F. (1998) Caractérisation d’une Mosaïque Fo-
restière et de sa Dynamique en Forêt Tropicale humide Sempervirente. Biotropica,
30, 251-260. https://doi.org/10.1111/j.1744-7429.1998.tb00059.x
[32] Barot, S., Gignoux, J. and Menaut, J.C. (1999) Seed Shadows, Survival and Recruit-
ment: How Simple Mechanisms Lead to Dynamics of Population Recruitment
curves. Oïkos, 86, 320-330. https://doi.org/10.2307/3546449
[33] Dubourdieu, J. (1997) Manuel d’aménagement forestier: Gestion durable et intégrée
DOI: 10.4236/oje.2021.117034 538 Open Journal of EcologyL. S. Achille et al.
des écosystèmes forestiers. Office National des Forêts; Technique et Documentation,
Lavoisier, Paris, 244 p.
[34] Kohyama, T. (1991) A Functional Model Describing Sapling Growth under a Trop-
ical Forest Canopy. Functional Ecology, 5, 83-90. https://doi.org/10.2307/2389558
[35] Kubota, Y. (1995) Effects of Disturbance and Size Structure on the Regeneration
Process in a Sub-Boreal Coniferous Forest, Northern Japan. Ecological Research, 10,
135-142. https://doi.org/10.1007/BF02347935
[36] Reader, R.J., Bonser, S.P., Duralia, T.E. and Bricker, B.D. (1995) Inter Specific Vari-
ation in Tree Seedling Establishment in Canopy gaps in Relation to Tree Density.
Journal of Vegetation Science, 6, 609-614. https://doi.org/10.2307/3236431
[37] Berkowitz, A.R., Canham, C.D. and Kelly, V.R. (1995) Competition vs. Facilitation
of Tree Seedling Growth and Survival in Early Successional Communities. Ecology,
76, 1156-1168. https://doi.org/10.2307/1940923
[38] Mutamba, M. (2007) Farming or Foraging? Rural Livelihoods in Mafulira and Ka-
bompo Districts of Zambia. Center for International Forestry Research and Rhodes
University, Bogor, 20 p.
[39] White, F. (1983) The Vegetation Map of Africa. A Descriptive Memoir, UNESCO,
Natural Ressources Research, 20, 1-356.
[40] Lebrun, J.-P. and Stork Adélaïde, L. (1992) Enumération des plantes à fleurs
d’Afrique tropicale. Volume II. Chrysobalanaceae à Apiaceae. Conservatoire et Jar-
din botaniques de la Ville de Genève, Genève, 257 p.
DOI: 10.4236/oje.2021.117034 539 Open Journal of EcologyYou can also read


