Automated femur segmentation from computed tomography images using a deep neural network
←
→
Page content transcription
If your browser does not render page correctly, please read the page content below
Automated femur segmentation from computed tomography
                                                      images using a deep neural network
                                                P.A. Bjornsson∗a , B. Helgasonb , H. Palssonc , S. Sigurdssond , V. Gudnasond,e , and L.M.
                                                                                       Ellingsena,f
                                           a
                                             Dept. of Electrical and Computer Engineering, The University of Iceland, Reykjavik, Iceland
                                                               b
                                                                 Institute for Biomechanics, ETH Zürich, Zürich, Switzerland
                                                c
                                                  Dept. of Industrial Engineering, Mechanical Engineering, and Computer Science, The
                                                                           University of Iceland, Reykjavik, Iceland
arXiv:2101.11742v1 [eess.IV] 27 Jan 2021

                                                                    d
                                                                      The Icelandic Heart Association, Kopavogur, Iceland
                                                            e
                                                              Dept. of Medicine, The University of Iceland, Reykjavik, Iceland
                                           f
                                             Dept. of Electrical and Computer Engineering, The Johns Hopkins University, Baltimore, MD
                                                                                          21218, USA

                                                                                              ABSTRACT
                                           Osteoporosis is a common bone disease that occurs when the creation of new bone does not keep up with the loss
                                           of old bone, resulting in increased fracture risk. Adults over the age of 50 are especially at risk and see their quality
                                           of life diminished because of limited mobility, which can lead to isolation and depression. We are developing a
                                           robust screening method capable of identifying individuals predisposed to hip fracture to address this clinical
                                           challenge. The method uses finite element analysis and relies on segmented computed tomography (CT) images
                                           of the hip. Presently, the segmentation of the proximal femur requires manual input, which is a tedious task,
                                           prone to human error, and severely limits the practicality of the method in a clinical context. Here we present
                                           a novel approach for segmenting the proximal femur that uses a deep convolutional neural network to produce
                                           accurate, automated, robust, and fast segmentations of the femur from CT scans. The network architecture is
                                           based on the renowned u-net, which consists of a downsampling path to extract increasingly complex features of
                                           the input patch and an upsampling path to convert the acquired low resolution image into a high resolution one.
                                           Skipped connections allow us to recover critical spatial information lost during downsampling. The model was
                                           trained on 30 manually segmented CT images and was evaluated on 200 ground truth manual segmentations.
                                           Our method delivers a mean Dice similarity coefficient (DSC) and 95th percentile Hausdorff distance (HD95) of
                                           0.990 and 0.981 mm, respectively.
                                           Keywords: Computed tomography, Femur, Segmentation, Convolutional neural networks, Osteoporosis.

                                                                                         1. INTRODUCTION
                                           A consequence of ageing societies is a higher prevalence of chronic diseases amongst older populations. In the
                                           coming years, this will lead to shortages of qualified health care practitioners and mounting health care costs as a
                                           result of the added strain placed by these longevous populations. It appears that the current status quo of health
                                           care systems is unsustainable and must be restructured from face-to-face based care to a more decentralized,
                                           home based care that places emphasis on prevention rather than treatment. One disease that disproportionately
                                           affects those over the age of 50 is osteoporosis - a bone disease that occurs when the body loses too much
                                           bone, makes too little bone, or both, resulting in reduced bone mass, which leads to increased bone fragility
                                           and heightened fracture risk with age. Hip fractures are associated with some of the most dire socioeconomic
                                           consequences: those who incur a fracture typically experience a steep decline in physical, mental, and emotional
                                           function and, in 50-55% of cases, individuals are left with residual walking disability and in 15-30% of cases,
                                               Further author information: (Send correspondence to P.A.B.)
                                               P.A.B.: E-mail: pab11@hi.is
                                               L.M.E.: E-mail: lotta@hi.is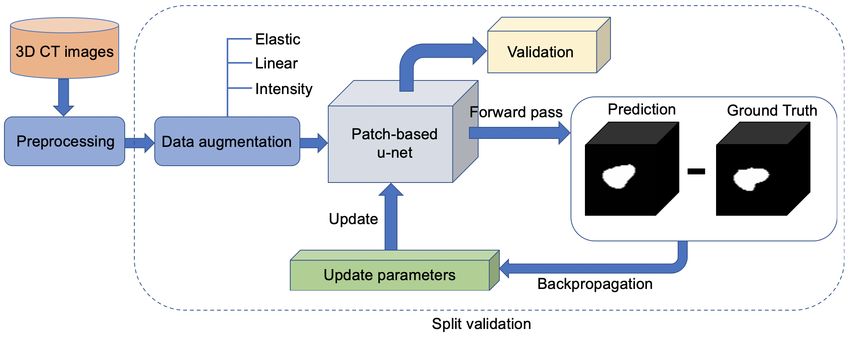
these individuals must be remanded to institutional care.1–5 What is most startling is that 11-23% of individuals
will be deceased six months after incurring the fracture, increasing to 22-29% after one year has passed since the
incident.6
    Subject-specific, image-based finite element (FE) analysis of bone is a popular approach in biomechanics that
has gained considerable traction in recent years.7 By exploiting the gray-scale features of the CT images in
concert with the respective segmentation mask, a screening tool for hip fracture risk prediction can be brought
to fruition. Such a clinical screening tool could prevent potentially devastating fractures for patients, as well as
to dramatically relieve the economic burden of hip fractures on our healthcare systems. However, these methods
have yet to be implemented for clinical use, since the segmentation of the proximal femur currently requires
manual input, which severely limits their use in clinical context.
    A number of methods have been implemented to surmount the problem of bone segmentation, ranging from
thresholding techniques to graph-cut methods.8–11 Current segmentation methods often require a “user-in-the-
loop” paradigm in order to manually correct segmentations to produce acceptable masks for FE modeling and/or
their processing time is too long for clinical use. This lack of robustness is costly in terms of time and the need for
a highly trained specialist to manually correct the segmentations. Consequently, these methods cannot process
larger cohorts to the same degree as fully automated ones. In recent years, the application of deep neural
networks (DNNs) in image segmentation has gained considerable attention. The use of deep neural networks as
a viable option for biomedical image segmentation is a direct consequence of the u-net architecture proposed by
Ronneberger et al.12 In this impactful paper, they demonstrated how the u-net architecture can produce fast
and precise segmentations without relying on a large training set. However, the process by which ground truth
segmentation masks are authored is typically manual delineation, which is a taxing and time-consuming process
that is ideally only implemented for a small training data set. Despite the need for ground truth labels, deep
neural networks have become the state-of-the-art approach in medical imaging.13, 14 A segmentation prediction
on novel data can be generated autonomously (i.e., without human intervention) in a matter of seconds, which is
often an order of magnitude faster than preceding methods that do not make use of DNN’s. Zhao et al.15 proposed
an automated, patch-based three-dimensional v-net architecture16 and reported a mean DSC of 0.9815 ± 0.0009.
Another successful method based on the u-net architecture12 was conducted by Chen et al.,17 who reported a
mean DSC of 0.9688 ± 0.0095. The major drawback to these two methods, however, is their dependence on
large training sets that require ground truth segmentations, as well as the small validation sets they have been
evaluated on. The arduous nature of authoring these ground truth segmentations, as previously mentioned, is
oftentimes not feasible and severely limits the practicality of these methods.
   Here we propose a fully automated method for segmenting the proximal femur from CT scans that is accurate,
robust, and faster than other state-of-the-art methods. We evaluate our method on 200 manually delineated
ground truth annotations from the Age, Gene/Environment Susceptibility-Reykjavik Study (AGES-RS),18 a
unique longitudinal study of the Icelandic elderly, to demonstrate the accuracy and robustness of our proposed
method.

                                                 2. METHODS
2.1 Preprocessing and data augmentation
The Icelandic Heart Association (IHA) provided us with CT images from the AGES-RS:18 a cohort that consists
of both men and women born between 1907 and 1935, monitored in Iceland by the IHA since 1967. This unique
database of high-quality CT images contains roughly 4800 density calibrated CT scans of the proximal femur at
baseline and 3300 scans of the same individuals acquired at a five-year follow-up. The in-plane resolution of each
scan is 512 × 512 voxels with 88-178 slices and 0.977 × 0.977 × 1 mm3 voxel size. The preprocessing of the data
consisted of three steps: Firstly, each of the 30 CT images used for training was split in half and the left sides
were subsequently mirrored to the right, resulting in 60 images of the right side hip/upper leg. Second, min-max
normalization was used to linearly map the intensity values from Hounsfield units to the range [0, 1]. Lastly,
Otsu thresholding19 was implemented to identify the background voxels and allow for automatic cropping of the
3D images to decrease their size and therefore speed up the execution of the neural network. Since each extra
voxel is computationally costly, the images were all cropped to eliminate unnecessary background voxels.
Figure 1. A flowchart showing the workflow of our proposed method.
The proposed fully automated proximal femur segmentation pipeline is illustrated in Figure 1. During
training, a training/validation set of 30 CT images (i.e., 60 proximal femurs) from the AGES cohort18 was
fed into a neural network that exploited on-the-fly data augmentation on randomly cropped patches from a
randomly selected batch of two images. On-the-fly data augmentation eliminates the need for excessive storage
of augmented images by performing the augmentation prior to each optimization iteration. Data augmentation
is imperative for maximizing the efficiency of a training set, since obtaining manual segmentations (i.e., ground
truth segmentations) is an arduous, time-consuming process that does not cater to large cohorts. Hence, data
augmentation is applied to teach the model invariance and robustness properties when only a limited data set
is available. In addition, artificially expanding the training set with data augmentation has a regularizing effect,
which avoids overfitting the model to a small subset of data. Deformations that capture variation within the
data set can be simulated efficiently and assist the model in learning invariance between images.12 Here we
applied elastic deformations as well as linear-spatial and intensity transformations (i.e., scaling, rotation and
brightness) to simulate the variability between patients’ scans. Data augmentation, with random transformation
parameters from pre-defined ranges, was implemented on-the-fly for each image before it was forwarded into the
neural network. Each transformation had a 35% likelihood of being applied to the image at hand, allowing the
model to encounter a diverse set of images, thereby decreasing redundancy. The scaling, rotation, and brightness
transforms were defined in the ranges (0.95, 1.05), (−3◦ , 3◦ ), and (0.75, 1.25), respectively, while the elastic
deformation transform was tuned to α = (0, 100) and σ = (9, 13).∗ On-the-fly data augmentation, in concert with
parameter sharing20 and batch normalization,21 rendered the use of explicit regularization techniques unnecessary
and even counterproductive.
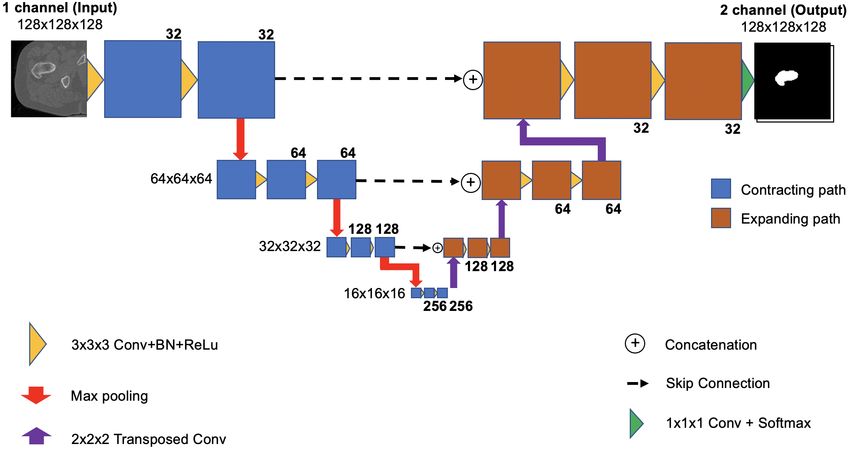
2.2 The segmentation workflow and model architecture
As previously stated, the u-net architecture addresses two main issues: namely, the ability to train a model from
a very small data set and the ability to produce precise segmentations despite the former. A schematic of the
proposed architecture is shown in Figure 2. The two paths that comprise the u-net structure are the contracting
(downsampling) path and the expanding (upsampling) path. The former is the encoder and captures context
with the use of stacked convolutional units and max pooling layers, while the latter is the decoder and allows
for precise localization with the use of transposed convolutions. In the final layer of the network, a 1 × 1 × 1
convolution is used to map the feature map to the number of classes. By applying a softmax layer voxel-wise, a
probabilistic map is outputted that gives each voxel a value in the range [0, 1]; voxels with a probability > 0.5
belong to the foreground class (proximal femur) and the rest to the background class. The proposed method
was implemented using the MIScnn framework22 in Python.
∗
Here, α denotes the scaling factor (controls the deformation intensity) and σ denotes the smoothing factor (controls
the displacement field smoothing) for the elastic deformation.Figure 2. A schematic of our proposed 3D u-net model. The bold numbers at the corners represent the number
of feature maps (channels) per layer. For the sake of simplicity, feature maps are depicted in two dimensions.
A patch-based model was adopted in consideration of memory constraints; each volume patch was 128×128×
128 voxels with an overlap of 64 × 64 × 64 voxels. This patch size captures the entire femoral head, which is the
most dynamic section of the proximal femur, and downsamples nicely, meaning that after each use of max pooling
we are left with integer values for patch dimensions. During training, volume patches were randomly selected
from the image volume and subsequently fed into the neural network. As the image patch is downsampled in the
contracting path, the number of channels increases, which allows for the extraction of more complex features.
Skip connections are used to pass features from the contracting path to the expanding path in order to recover
spatial information lost during downsampling. At each step in the decoder, a skip connection allows for the
concatenation of the output of the transposed convolutional layer with the corresponding feature map from the
encoder. A convolutional layer is subsequently able to produce a more precise output based on this information.
The Dice loss function, defined as 1−DSC, quantified the performance of the model at each iteration of each epoch
in order for the gradient descent algorithm to adjust the parameters during backpropagation. The validation set
allowed us to gain insight into the performance of the model on unseen data so that hyperparameters could be
adjusted accordingly.
Our model was trained on images from the AGES data set, comprising 260 proximal femurs with corresponding
manually delineated segmentations, generated with a semi-automated delineation protocol, that served as ground
truth annotations. A total of 54 images were used for training, 6 were used for validation, and the remaining
200 were used for evaluation. The Adam optimizer (β1 = 0.9 and β2 = 0.999) was used to update the weights
with an initial learning rate of 1 · 10−4 . Our model was trained using dual Nvidia GeForce GTX 1080 Ti GPUs
for 300 epochs, which took roughly 11.5 hours.
3. EXPERIMENTS AND RESULTS
We evaluated the performance of our model on the aforementioned AGES data set by processing 200 proximal
femurs that had been manually segmented (the current gold standard). We used the DSC and HD95 to evaluate
the accuracy and robustness of our method. The former metric measures the overlap between the automatically
generated segmentation mask and the ground truth manual mask. The HD95 metric, on the other hand, quantifies
the largest segmentation error between two images and provides valuable insight into the performance of theFigure 3. The box plots above show the mean DSC (left) and the mean HD95 (right) for 200 proximal femurs.
Figure 4. A visual comparison of our segmentation results and the manual segmentation. (a) The original CT
scans, (b) the segmentation predictions using the proposed method, (c) the ground truth segmentations.
model. The mean DSC on this evaluation set was 0.990 ± 0.002 and the mean HD95 was 0.981 ± 0.040 mm
(see Fig. 3), demonstrating both high accuracy and robustness of the proposed method. The time for each
segmentation prediction was 12-15 seconds, making the method viable for use in both large studies and clinical
settings. Figure 4 displays a visual comparison between the output of our proposed method and the ground
truth segmentation. Despite the thin and diffusive bone structure boundaries between the femoral head and the
acetabulum (i.e., the bottom two rows of Figure 4), our method accurately labels the voxels that belong to the
foreground class.
4. DISCUSSION AND CONCLUSION
This paper introduces a fully automated, accurate, fast, and robust method for proximal femur segmentation
that produces segmentation results with sub-millimeter accuracy. Our model addresses the biggest hurdles that
have impeded prior methods. Firstly, it is fully automated and does not require a trained operator to make
ad hoc corrections to unacceptable segmentation predictions. Secondly, the time our model takes to output
a segmentation prediction (around 12-15 seconds per prediction) is well within reasonable bounds for clinicalviability and can additionally be implemented to process large cohorts. The mean DSC was 0.990 ± 0.002 and
mean HD95 was 0.981 ± 0.040 mm when evaluated on 200 manually segmented femurs. The proposed method
is superior to preceding methods in terms of previously reported numbers of DSC and HD95 metrics and does
not require any manual interaction. In the near future, we will conduct a more extensive evaluation on a larger
cohort and, in turn, integrate the method into our existing FE pipeline, bringing it one step closer to becoming
a clinically viable option for screening at-risk patients for hip fracture susceptibility.
5. ACKNOWLEDGEMENTS
This work was supported by the RANNIS Icelandic Student Innovation Fund.
REFERENCES
[1] Ekström, W., Miedel, R., Ponzer, S., Hedström, M., Samnegård, E., and Tidermark, J., “Quality of life
after a stable trochanteric fracture–a prospective cohort study on 148 patients,” J Orthop Trauma 23(1),
39–44 (2009).
[2] Carpenter, R. and Carter, D., “The mechanobiological effects of periosteal surface loads,” Biomech Model
Mechanobiol. 7(3), 227–242 (2008).
[3] Magaziner, J., Fredman, L., Hawkes, W., Hebel, J., Zimmerman, S., Orwig, D., and Wehren, L., “Changes in
functional status attributable to hip fracture: A comparison of hip fracture patients to community-dwelling
aged,” Am. J. Epidemiol. 157(11), 1023–1031 (2003).
[4] Nevalainen, T., Hiltunen, L., and Jalovaara, P., “Functional ability after hip fracture among patients home-
dwelling at the time of fracture,” Cent Eur J Public Health 12(4), 211–216 (2004).
[5] Osnes, E., Lofthus, C., Meyer, H., Falch, J., Nordsletten, L., Cappelen, I., and Kristiansen, I., “Consequences
of hip fracture on activities of daily life and residential needs,” Osteoporos Int. 15(7), 567–574 (2004).
[6] Haleem, S., Lutchman, L., Mayahi, R., Grice, J., and Parker, M., “Mortality following hip fracture: Trends
and geographical variations over the last 40 years,” Injury 39(10), 1157–1163 (2008).
[7] Fleps, I., Guy, P., Ferguson, S., Cripton, P., and Helgason, B., “Explicit finite element models accurately
predict subject-specific and velocity-dependent kinetics of sideways fall impact,” J Bone Miner Res. 34(10),
1837–1850 (2019).
[8] Kim, J., Nam, J., and Jang, I., “Fully automated segmentation of a hip joint using the patient-specific
optimal thresholding and watershed algorithm,” Comput Methods Programs Biomed. 154, 161–171 (2018).
[9] Chang, Y., Yuan, Y., Guo, C., Wang, Y., Cheng, Y., and Tamura, S., “Accurate pelvis and femur segmen-
tation in hip ct with a novel patch-based refinement,” IEEE J Biomed Health Inform. 23(3), 1192–1204
(2020).
[10] Younes, L., Nakajima, Y., and Saito, T., “Fully automatic segmentation of the femur from 3d-ct images
using primitive shape recognition and statistical shape models,” Int J Comput Assist Radiol Surg. 9(2),
189–196 (2019).
[11] Pauchard, Y., Fitze, T., Browarnik, D., Eskandari, A., Pauchard, I., Enns-Bray, W., Pálsson, H., Sigurdsson,
S., Ferguson, S. J., Harris, T. B., Gudnason, V., and Helgason, B., “Interactive graph- cut segmentation
for fast creation of finite element models from clinical ct data for hip fracture prediction,” Comput Methods
Biomech Biomed Engin. 20(3), 342 (2016).
[12] Ronneberger, O., Fischer, P., and Brox, T., “U-net: Convolutional networks for biomedical image segmen-
tation,” in [Medical Image Computing and Computer-Assisted Intervention – MICCAI 2015], Navab, N.,
Hornegger, J., Wells, W. M., and Frangi, A. F., eds., 234–241, Springer International Publishing, Cham
(2015).
[13] Shao, M., Han, S., Carass, A., Li, X., Blitz, A., Shin, J., Prince, J., and Ellingsen, L. M., “Brain ventricle
parcellation using a deep neural network: Application to patients with ventriculomegaly,” NeuroImage:
Clinical 23, 101871 (2019).
[14] Huo, Y., Terry, J., Wang, J., Nair, S., Lasko, T., Freedman, B., Carr, J., and Landman, B., “Fully automatic
liver attenuation estimation combing cnn segmentation and morphological operations,” Med. Phys. 46(8),
3508–3519 (2019).[15] Zhao, C., Keyak, J., Tang, J., Kaneko, T. S., Khosla, S., Amin, S., Atkinson, E., Zhao, L., Serou, M.,
Zhang, C., Shen, H., Deng, H., and Zhou, W., “A deep learning-based method for automatic segmentation
of proximal femur from quantitative computed tomography images,” ArXiv. abs/2006.05513 (2020).
[16] Milletari, F., Navab, N., and Ahmadi, S., “V-net: Fully convolutional neural networks for volumetric medical
image segmentation,” in [3DV 2016 ], (2016).
[17] Chen, F., Liu, J., Zhao, Z., Zhu, M., and Liao, H., “Three-dimensional feature-enhanced network for
automatic femur segmentation,” IEEE J Biomed Health Inform. 23(1), 243–252 (2019).
[18] Harris, T., Launer, L., Eiriksdottir, G., Kjartansson, O., Jonsson, P., Sigurdsson, G., Thorgeirsson, G., As-
pelund, T., Garcia, M., Cotch, M., Hoffman, H., and Gudnason, V., “Age, gene/environment susceptibility
– reykjavik study: Multidisciplinary applied phenomics,” Am J Epidemiol. 165(9), 1076–1087 (2007).
[19] Otsu, N., “A threshold selection method from gray-level histograms,” IEEE Trans. Syst. 9(1), 62–66 (1979).
[20] LeCun, Y., Boser, B., Denker, J., Henderson, D., Howard, R., Hubbard, W., and Jackel, L., “Handwritten
digit recognition with a back-propagation network,” in [Advances in Neural Information Processing Systems],
Touretzky, D., ed., 2, 396–404, Morgan-Kaufmann (1990).
[21] Ioffe, S. and Szegedy, C., “Batch normalization: Accelerating deep network training by reducing internal
covariate shift,” CoRR abs/1502.03167 (2015).
[22] Müller, D. and Kramer, F., “Miscnn: A framework for medical image segmentation with convolutional
neural networks and deep learning,” ArXiv abs/1910.09308 (2019).You can also read