ACTIVE TRANSPORT STRATEGY 2021 - www.tamworth.nsw.gov.au - Tamworth Regional Council
←
→
Page content transcription
If your browser does not render page correctly, please read the page content below
ACTIVE
            TRANSPORT
             STRATEGY
                                          2021

www.tamworth.nsw.gov.au   Active Transport Strategy 2021   Page 1
CONTENTS
                       Executive Summary.....................................................................................................................................4

                       Strategic Alignment....................................................................................................................................6

                       Setting the Scene.........................................................................................................................................8

                       Vision...............................................................................................................................................................8

                       Context............................................................................................................................................................8

                       What is Active Transport?......................................................................................................................10

                       Benefits of Active Transport.................................................................................................................10

                       Current Approach......................................................................................................................................12

                                       Recent Achievements.............................................................................................................16

                       Potential Barriers.......................................................................................................................................19

                       Our Action Priorities.................................................................................................................................20

                                       Theme 1 – Encouraging active transport......................................................................20

                                       Theme 2 – Providing a connected network ...............................................................21

                                       Theme 3 – Providing a safe network..............................................................................21

                                       Theme 4 – Ensuring an inclusive network and accepting culture......................23

                                       Theme 5 – Pursuing a smart network...........................................................................23

                                       Theme 6 – Ensuring an affordable network...............................................................24

                                       Theme 7 – Maintaining a suitable network..................................................................25

                        Our Next steps..........................................................................................................................................26

                                       Monitoring and evaluation..................................................................................................26

                                       Funding and delivery.............................................................................................................26

                                       Summary of action priorities..............................................................................................27

                                     Tamworth Regional Council
                                     Active Transport Strategy 2021, prepared by the Regional Services Directorate of Tamworth Regional Council
                                     This document is a controlled document and therefore subject to review and amendment from time to time.

Page 2   Active Transport Strategy 2021
LIST OF FIGURES
Figure 1. Tamworth Regional Council Strategic Framework
for transport infrastructure.....................................................................................................................7

Figure 2. Greenhouse gas emissions for various transport modes.......................................11

Figure 3. Key areas of interest within Tamworth - walking and cycling..............................13

Figure 4. Key identified family-friendly areas within Tamworth............................................14

Figure 5. On-Road cycling loops around Tamworth....................................................................16

Figure 6. Key Urban On-Road cycling routes in Tamworth......................................................17

Figure 7. Stewart Avenue shared path - constructed early 2020.........................................18

Figure 8. Tamworth Regional Cycling Centre..................................................................................19

Figure 9. Tamworth Regional Skate Park........................................................................................19

LIST OF TABLES
Table 1. Journey to Work mode share within Tamworth Regional Council.........................8

Table 2. Summary of on-road cycling loops around Tamworth.............................................16

Table 3. Theme 1 actions - encouraging active transport.......................................................20

Table 4. Theme 2 actions - providing a connected network..................................................21

Table 5. Theme 3 actions - providing a safe network................................................................21

Table 6. Theme 4 actions - ensuring an inclusive network
and accepting culture.............................................................................................................................23

Table 7. Theme 5 actions - pursuing a smart network..............................................................23

Table 8. Theme 6 actions - ensuring an affordable network.................................................24

Table 9. Theme 7 actions - maintaining a suitable network..................................................25

Table 10. Monitoring and evaluation techniques for priority actions..................................26

Table 11. Summary of priority actions...............................................................................................27

                                                                                                                             Active Transport Strategy 2021   Page 3
Page 4 Active Transport Strategy 2021
EXECUTIVE SUMMARY
The Tamworth Regional Council area has a growing         While private vehicles are expected to remain the
population, particularly the city of Tamworth which      primary mode of transport for many Tamworth
has about 75 per cent of the region’s population of      residents in the immediate future, the identified
62,541.                                                  increased load on the local road network needs to
                                                         be addressed in order to strike a more balanced
As the Tamworth region moves towards a population        transport network. Tamworth has many challenges
of 100,000 persons in the future, it is particularly     which can make it difficult to reduce private vehicle
important that our transport infrastructure caters       use, including large distances between residential
for this increase. With this growth, the number of       areas and places of work and a disconnected existing
daily vehicle trips within Tamworth itself is expected   active transport/public transport network.
to rise by 70 per cent. With almost every trip in
Tamworth currently completed using private vehicles,     Improving active transport infrastructure through
the demand on the road network and parking               creating a sustainable, connected, attractive, safe and
will dramatically increase, resulting in increased       inclusive network will greatly improve the likelihood of
congestion.                                              reducing the dependency on private vehicle use and
                                                         ensuring a more balanced transport network.
Increasing active transport usage such as walking
and cycling is one way to mitigate increasing traffic    Providing active transport infrastructure and
congestion. Active transport is generally any non-       encouraging more people to participate through
motorised form of transport involving physical           effective communication channels is key to
activity, such as walking and cycling. There are a few   developing a sustainable transport network. The
exceptions to this including mobility scooters and to    current active transport network in Tamworth consists
some extent public transport – which often includes      of 36km of shared path, 118km of footpath and 2km
either walking or cycling at the beginning or end of     of on-road cycleway. Council will continue working
journeys.                                                towards developing a connected active transport
                                                         network by identifying and completing missing links
Active transport provides tangible benefits by           in the network.
increasing daily physical activity levels and reducing
greenhouse gas emissions through a reduction in cars     Council aims to improve the safety of those using the
on the road. Other benefits include improved social      active transport network, with walkers and cyclists in
wellbeing and a greater sense of community.              the road environment being particularly vulnerable.
                                                         Safety can also refer to a person’s perception on
The Tamworth Regional Council Active Transport           safety, with Council improving lighting, line-of-sight
Strategy forms part of Council’s wider Tamworth          and the closed circuit television (CCTV) network.
Integrated Transport Masterplan (the Masterplan)
which consists of the Active Transport, Roads            End-of-trip and mid-trip facilities will be improved
Infrastructure, Bridge and Parking Strategies. The       to ensure that users’ needs are catered for when
Masterplan provides the transportation information       using the network. These will be located in areas of
required for achieving sustainable growth as outlined    high-use and public transport interchanges. To also
in Council’s Blueprint 100 plan.                         maximise the user experience, Council will seek to
                                                         implement innovative solutions to navigation and
                                                         explore new technologies as they become available.

                                                                                 Active Transport Strategy 2021   Page 5
Providing inclusive infrastructure and developing         This strategy outlines Council’s priority actions in
   an accepting culture towards active transport use         achieving a target of around 1 in 10 journeys to work
   is something which Council will prioritise. As each       being undertaken using active transport means within
   person has their own purpose for travelling, a            the next 10 years. The main themes for the Tamworth
   particular ability level and confidence level, Council    Regional Council Active Transport Strategy are:
   will aim to cater for all when developing the network.
                                                             • Theme 1 – Encouraging active transport
   Undertaking these improvements requires a                 • Theme 2 – Providing a connected network
   coordinated approach involving not only Council           • Theme 3 – Providing a safe network
   and its community stakeholders, but also the State        • Theme 4 – Ensuring an inclusive network and
   Government and Federal Government. All should                          accepting culture
   work together to meet the needs of the community in       • Theme 5 – Pursuing a smart network
   providing a functional, attractive, safe and connected    • Theme 6 – Ensuring an affordable network
   transport network.                                        • Theme 7 – Maintaining a suitable network

   STRATEGIC ALIGNMENT
   The Tamworth Integrated Transport Masterplan (the         Council’s Blueprint 100 document assesses all
   Masterplan) is Council’s guiding document in ensuring     infrastructure and non-infrastructure programs
   that our transport network meets the demand of            required in order to achieve a sustainable target
   the community now, and along the way in achieving         population of 100,000 persons in the region. This
   a target population of 100,000 people within the          target is to be achieved in a sustainable manner
   region. It comprises:                                     with consideration given to water, transport, sewer,
                                                             recreation and retail, commercial and industrial
   •   Active Transport Strategy;                            centres. The below framework demonstrates where
   •   Roads Infrastructure Strategy;                        the Active Transport Strategy, Tamworth Integrated
   •   Bridge & Major Culvert Strategy; and,                 Transport Masterplan and Blueprint 100 documents
   •   Tamworth CBD Parking Strategy.                        sit in the Regional Services Strategic Framework
                                                             hierarchy.
   The strategies which inform the Masterplan draw
   upon various Regional, State and Federal initiatives
   in order to provide a holistic view of transport in the
   region.

Page 6   Active Transport Strategy 2021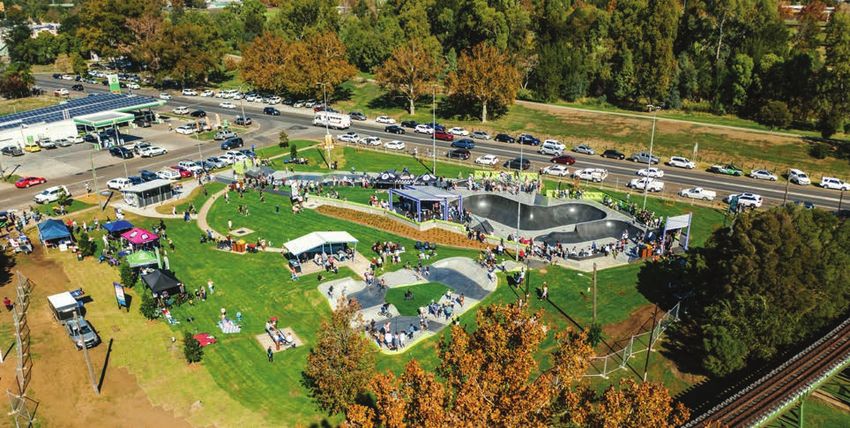
REGIONAL SERVICES STRATEGIC FRAMEWORK FOR
                        DELIVERY OF TRANSPORT INFRASTRUCTURE

                                                    State Government Strategies & Plans

                                                       Community Strategic Plan (CSP)
      Council Strategies

                                                        Blueprint 100 (Future Document)
          LEVEL 1

                                                        Tamworth Regional Transport
                                                               Masterplan
      Asset Strategies
         LEVEL 2

                             TRC Roads                     Active                                                  Tamworth
                            Infrastructure               Transport                      TRC Bridge                CBD Parking
                               Strategy                  Strategy                        Strategy                   Strategy
     Delivery Strategies

                                                  Consolidated Regional Services Works Program
                                                 and Funding Strategy - New and Upgrade Works
          LEVEL 3

                                                          Asset Management Plans
     Financial Strategies
          LEVEL 4

                                  AOP & 4 Year Delivery Program                             Long Term Financial Plan

                                                               Regional Services
                                                       Infrastructure Delivery Programs

FIGURE 1. TAMWORTH REGIONAL COUNCIL STRATEGIC FRAMEWORK FOR TRANSPORT INFRASTRUCTURE.

                                                                                                         Active Transport Strategy 2021   Page 7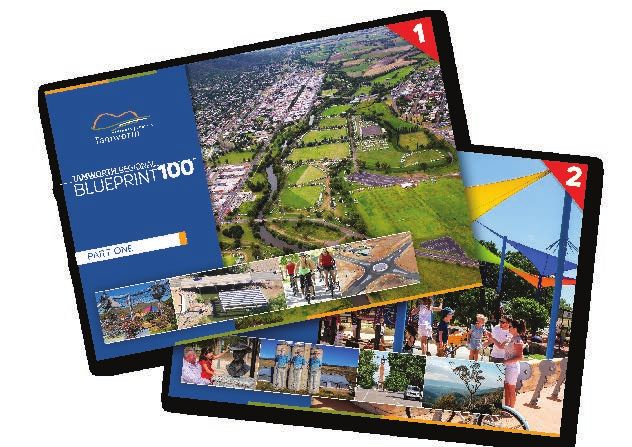
SETTING THE SCENE
    The Tamworth Regional Council Active Transport                            The Active Transport Strategy will deliver
    Strategy (Active Transport Strategy) aims to ensure                       improvements over the next 10 years and will
    the Tamworth region is equipped to transform                              support objectives outlined within the Tamworth
    into a pedestrian and cycle-friendly region for the                       Integrated Transport Masterplan and ultimately
    benefit of both its residents and all visitors. This will                 Blueprint 100.
    be achieved through providing a safe, connected,
    inclusive, accepting and smart active transport                           VISION
    environment.
                                                                              Our vision is to create a connected, accessible, safe,
                                                                              inclusive and attractive walking and cycling network
    Cycling and walking plays an important role in
                                                                              which will attract those of all abilities and ages to
    shaping the region’s transport network, with the
                                                                              walk and cycle.
    Active Transport Strategy identifying the priority
    actions catering for an expected increase in the
                                                                              By 2031, it is targeted that around 1 in 10 journeys
    number of persons participating in active transport,
                                                                              to work will be done so by either walking or cycling.
    and the frequency in which they do so.
                                                                              Currently, only around 1 in 20 trips are done so in
                                                                              this manner.

         Transport Mode                                                     % Share of Trips

                                      2006               2011              2016           2021             2026            2031

         Walking                           5.6            4.4              4.0             5.0              6.0             7.0

         Cycling                           0.8            0.6              0.5             1.0              2.0             2.5

         Public Transport                  1.0            0.8              0.9             2.0              3.0             4.0

         Private Transport             92.6              94.2              94.6           92.0             89.0             86.5

   TABLE 1. JOURNEY TO WORK MODE SHARE WITHIN TAMWORTH REGIONAL COUNCIL.

   Achieving this vision will result in:

   • Increased use of active transport for a range of purposes including recreational, commuter, tourism and those
      seeking health benefits;

   • Improved acceptance of pedestrians and particularly cyclists in the community;

   • A reduction in congestion, particularly around busier intersections within the Tamworth CBD;

   • Improved safety of those participating in active transport; and

   • Appropriate end-of-trip facilities to support user demand.

Page 8    Active Transport Strategy 2021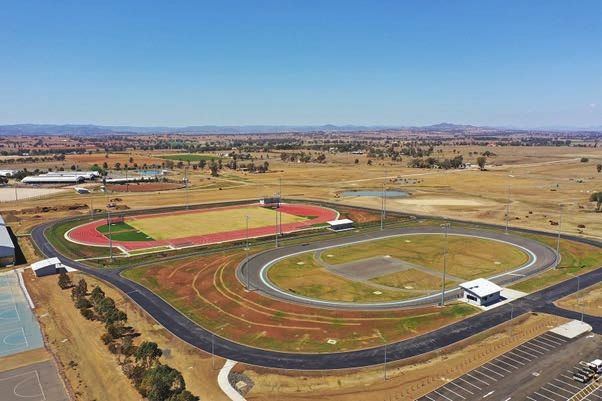
CONTEXT
    The Tamworth region is home to around 62,541                         Active transport methods such as walking and
    residents, with the city of Tamworth representing                    cycling are key alternate transport modes that play
    75% of this total. Tamworth attracts an estimated                    a significant role in reducing the forecasted traffic
    1,251,000¹ annual visitors through various tourism                   congestion issues. Walking and cycling are two highly
    events and high-level sporting events.                               economical and environmentally friendly transport
                                                                         options which shape a sustainable future for the
                                                                         region.
    As a low-density residential area, Tamworth covers
    a large spatial area which results in difficult and
    unique transport challenges, with private vehicles
    the predominant form of transport currently utilised.
    Targeting a population increase to 100,000 persons
    as outlined in Blueprint 100 represents an estimated
    increase of 70% in the total number of daily trips.

    With almost all of these journeys occurring via private
    vehicles, the need for alternate transport modes
    becomes highly necessary as traffic congestion
    significantly increases on the road network.

¹ (Source Local Government Area Profiles | Tourism Research Australia)

                                                                                              Active Transport Strategy 2021   Page 9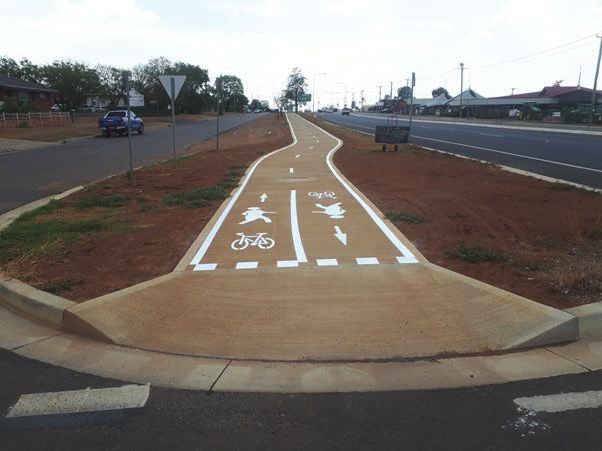
WHAT IS ACTIVE TRANSPORT?
     Active transport is generally any non-motorised            Within the umbrella terms of cyclists and
     form of transport involving physical activity, such as     pedestrians, there are different types of each:
     walking and cycling. It is free, healthy, sustainable
                                                                •   Recreational – Sporting, leisure, touring
     and environmentally friendly. It includes pedestrians,
                                                                •   Commuter – To and from work
     cyclists and those who use various mobility
                                                                •   Beginner – Inexperienced and unconfident
     devices. Almost everyone in the community is able
                                                                •   Experienced – Advanced skills and confident
     to participate in some form of active transport,
     whether it is for short trips or longer journeys, or for
     commuter or recreational purposes.

     The use of active transport is critical for the
     transport network, with increased uptake in active
     transport participation resulting in decreased road
     congestion, improved environmental amenity and
     cost savings to the user.

     BENEFITS OF ACTIVE
     TRANSPORT
      The range of benefits active transport has is vast,           Collaboration (2017)) and physical inactivity costing
      from the individual to the region as a whole; active          the Australian healthcare system an estimated
      transport has the potential to reshape how we                 $13.8 billion per year (National Heart Foundation of
      currently look at transport.                                  Australia 2014), active transport can play a major
                                                                    role in improving both outcomes.
      Active transport provides tangible benefits by
      increasing daily physical activity levels and reducing        Walking and cycling are low risk forms of exercise
      greenhouse gas emissions through a reduction in               that have minimal impact on joints, with various
      cars on the road. Other benefits include improved             health studies demonstrating how walking just 30
      social well-being and a greater sense of community.           minutes a day helps to:

      HEALTH IMPROVEMENTS                                           •   Reduce risk of heart disease and stroke;
                                                                    •   Manage weight, blood pressure and cholesterol;
      Regardless of age, gender, weight or fitness level,
                                                                    •   Improve balance and coordination; and
      those who participate in active transport receive
                                                                    •   Prevent and control diabetes.
      numerous health benefits. With almost 41 per
      cent of adults living in the Tamworth region being
      obese (according to the Australian Health Policy

Page 10   Active Transport Strategy 2021
ECONOMIC BENEFITS
In Regional NSW, it is estimated private vehicles congestion on the local road network, with cyclists
cost an average of $250 per week to run (Budget taking up much less space on the roads and
Direct 2018). In comparison, the cost of buying and pedestrians being removed from the road network
maintaining a bicycle is estimated as 1% of this cost altogether (for the most part).
– with walking having a lower cost again. The 2016
Census showed that the median weekly household The Australian Government spends an average
income for the Tamworth region is estimated of $27 million per day maintaining the road
at $1,180 – meaning running a private vehicle network (Department of Transport and Main Roads
represents 20 per cent of this household income – a Queensland). Active transport results in little to no
significant portion which can be reduced through damage to the road network, extending the life of
using active transport means. road pavements and wearing courses.
With metered public parking used in the Tamworth ENVIRONMENTAL BENEFITS
CBD, cycling and walking avoids any end-of-trip Compared to motorised transport, active transport
costs unlike private vehicle use. A full-time worker in produces no air pollution or noise pollution. Private
the Tamworth CBD may spend up to $750 per year vehicles are the greatest contributor to greenhouse
for parking. gas emissions and with almost 95 per cent of trips
to work in Tamworth made in private vehicles
TRAFFIC CONGESTION (Census 2016), replacing some of these trips with
It is estimated that the avoidable cost of traffic active transport will greatly improve the amenity of
congestion will reach $20.4 billion by 2020 urban centres and the health of those within these
(according to Australian Government Major Cities centres.
Unit 2010). Particularly for short trips, active
transport greatly assists in reducing traffic
GREENHOUSE GAS EMISSIONS FROM DIFFERENT MODES OF TRANSPORT
kg per person per km
CYCLING, WALKING
0 kg/person/km
PUBLIC TRANSPORT 0.003
FUEL EFFICIENT CAR,
FOUR PEOPLE 0.042
AVERAGE CAR,
FOUR PEOPLE 0.08
LARGE 4WD,
FOUR PEOPLE 0.11
FUEL EFFICIENT CAR,
ONE PERSON 0.17
AVERAGE CAR,
ONE PERSON 0.32
LARGE 4WD,
ONE PERSON 0.44
FIGURE 2. GREENHOUSE GAS EMISSIONS FOR VARIOUS TRANSPORT MODES (SOURCE: TRANSPORT FOR NSW FUTURE TRANSPORT STRATEGY 2056).
Active Transport Strategy 2021 Page 11CURRENT APPROACH
In the last three years, Tamworth Regional Council has been successful in obtaining various external grants for
undertaking active transport and pedestrian safety improvements. Council has secured around $6.23 million
worth of grant funding for the construction of shared paths, and $1.75 million for the construction of footpaths
across the region. In addition to this, internal funding is allocated annually for things such as new footpaths,
pram ramps, disabled parking and pedestrian refuges.
The active transport network in the Tamworth region consists of:
40
End-of-trip facilities
(bicycle parking) 5 High Pedestrian
Activity Zones (HPAZ)
36km
of shared pathways
118km
of footpaths
2km
of on-road cycleway
8 water refill
stations Outdoor gym
equipment
Page 12 Active
ActiveTransport
TransportStrategy
Strategy2021
2021Since 2014, the following have been constructed:
Multiple school pedestrian safety improvements:
• Children’s crossings • Line marking • Concrete medians
• Kerb extensions • Signage
FOOTPATHS AND SHARED PATHS:
9.6km
of new shared path
4.4km of new footpath
(with a further 7.7km to be (with a further 2.2km to be
constructed by 2023) constructed by 2023)
ACTIVE TRANSPORT ATTRACTIONS:
Significant
New Tamworth New Tamworth
upgrades to
Regional Cycling Centre Regional Skate
Tamworth
with a velodrome and Park
Mountain Bike
criterium track
Park
HIGH PEDESTRIAN MID AND END-OF-TRIP FACILITIES:
ACTIVITY ZONES (HPAZ):
40
New Tamworth
CBD HPAZ 8 water refill
stations
End-of-trip facilities
(bicycle parking)
PEDESTRIAN ACCESS IMPROVEMENTS:
32
disabled parking spaces Multiple kerb ramp Tactile ground surface indicator
installations across the region installation at a number sites
across the region
Active
Page 13Transport
ActiveStrategy 2021
Transport Page
Strategy 13
2021IMPORTANT ACTIVE
TRANSPORT LOCATIONS
Figure 3 below shows the key areas of interest within Tamworth that require linking together in order to
facilitate active transport. Each of these areas have their own distinct user groups, including those walking/
cycling for work purposes, for recreation, sporting related, families and vulnerable user groups such as the
elderly. Depending on the type of user groups expected to utilise a path or on-road network will shape just
what type of facility is required.
FIGURE 3. KEY AREAS OF INTEREST WITHIN TAMWORTH - WALKING AND CYCLING.
Red – Key fringe areas Green – Key family attractors
Pink – Cycling attractors Purple – Primary retail areas
Blue – Health and education precinct Orange – Key Transport area
Page 14 Active Transport Strategy 2021A variety of different facilities are required to cater for the range of user groups.
These types of cycling/walking loops include:
• Family-friendly and tourism loops
• Advanced loops – those for on-road cyclists
• Linking loops – those which link large groups of people with key attractors such as schools,
sporting precincts, health facilities, retail and other loops
• Recreational loops – those designed for fitness and social needs
FAMILY-FRIENDLY AREAS
The key family-friendly / recreational areas identified are as follows and shown below in Figure 4:
• 1. Peel River Loop
• 2. Tamworth Golf Course Loop
• 3. Calala to Tamworth CBD (via King George Avenue)
• 4. Victoria Park Precinct
4
1
2
3
FIGURE 4. KEY IDENTIFIED FAMILY-FRIENDLY AREAS WITHIN TAMWORTH.
Active Transport Strategy 2021 Page 15Each of these areas is expected to provide shady, scenic routes that cater for families and recreational users. It is also
an expectation that these loops will be constructed to a standard which caters for large groups of people/cyclists.
Examples of this may include increased width, separation between travel directions, higher levels of lighting, water refill
stations and/or seating.
ON-ROAD CYCLING LINKS
Non-Urban
On-road cyclists are a large user group within Tamworth, with Figure 5 showing the key on-road cycling routes around
Tamworth. As part of Council’s road maintenance, these roads will eventually feature wider shoulders, line marking and
signage indicating cyclists in the area. This will improve safety for all road users and ensure that motorists are aware of
cyclists in these areas, and that cyclists have a safe space to utilise. Note that only the non-urban roads which make up
these cycling loops are shown and the typical (although not always) direction of travel for these loops is shown.
Appleby
Lane
Davidsons
Lane
Gidley-Appleby Road
Uppe
rM oor M
oo
e nb
iG
Cr
ap
ee
k
Ro
ad
Gid
ley New England
-Sid
ing Gully Road
Man
Roa
d
Road
illa R
MOONBI
oad
Daruka
Ta Ro
ng ad
lew
oo
ek Road
d
Moore Cre
KOOTINGAL br
iR
oa
d
d Lim
oa
aR
ruk
Da
d
oa
yR
W
nd
all
Sa
am
or
eR
oa
d
oa
d
lR
ga
in
ot
Ko
ay
ck
hw
Ba
Hig
nd
gla
En
w
Ne
TAMWORTH
URBAN AREA Ar
m
ida
le R
oad
Nu
Ro ndle
ad
e an
Cala
s L
la L
ane
rien
O’B
Lo
om
be
ra
h
Ro
ad
ay
New England Highw
h Road
Loombera
Duri-Dungo
wan Road
FIGURE 5. ON-ROAD CYCLING LOOPS AROUND TAMWORTH.
Page 16 Active Transport Strategy 2021Table 2 shows a list of the on-road cycling loops from Figure 5. Note that only the non-urban roads are listed.
Usual Group Length
Loop No. Name Difficulty
Ride Direction (km)
1 Mine Shaft Hard Anti-clockwise 42
2 Pedal the Peel Moderate Clockwise 41
3 Oxley Anchor Loop Moderate Clockwise 28
4 The Gap Loop Hard Clockwise 56
5 Moore Creek Caves Hard Anti-clockwise 28
6 Recovery Easy Anti-clockwise 27
7 Tamworth Worlds Moderate Anti-clockwise 34
TABLE 2. SUMMARY OF ON-ROAD CYCLING LOOPS AROUND TAMWORTH.
Urban
Similarly to the non-urban on-road cycling routes, the important urban cycling routes are shown below in Figure
6. These identified routes are to have consideration given to on-road cyclists whenever road upgrade works are
undertaken, and also seek to improve on-road cycling where possible.
FIGURE 6. KEY URBAN ON-ROAD CYCLING ROUTES IN TAMWORTH Red – Key urban on-road cycling routes Blue - Tamworth Urban area
Active Transport Strategy 2021 Page 17RECENT ACHIEVEMENTS
Tamworth Regional Council has been actively seeking The three most significant recent funding allocations
funding opportunities from external sources in recent were:
years. These have included Roads and Maritime
Services (now Transport for NSW) grants as well • $3.284m from the NSW Government under the
as NSW Government and Federal Government RMS’s Active Transport Program in August 2019
programs. for shared path projects to be completed up to
June 2022;
Council has a set allocation of $60,000 a year as part
• $1.245m from the NSW Government under the
of its annual budget for new footpaths and shared
Stronger Country Communities Fund in
paths. This is enhanced through securing additional
September 2018 for shared path works; and
external funding sources. In addition to this, most
new developments have either footpath or shared • $1m from the Australian Government as part of
path constructed in accordance with development its Drought Communities Programme initiative
guidelines and future planned networks. which allowed more than 15 years worth of
footpath works to be carried out during 2020.
FIGURE 7. STEWART AVENUE SHARED PATH - CONSTRUCTED EARLY 2020.
Page 18 Active Transport Strategy 2021TAMWORTH REGIONAL CYCLING CENTRE
• 333m long asphalt velodrome • Completed October 2019
• 6m wide 880m long criterium track • $2.26million
FIGURE 8. TAMWORTH REGIONAL CYCLING CENTRE - COMPLETED OCTOBER 2019
TAMWORTH REGIONAL SKATE PARK
• Stage 1 completed june 2019 • Features unique bowl design with varying depths of
• Total project cost for Stage 1 $1.7million - with 7, 9 and 11 feet
close to $1million of this being State Government • Also features a street skate course. pump track and
contribution other supporting infrastructure such as paths,
lighting, security cameras, BBQ's and shelters.
FIGURE 9. TAMWORTH REGIONAL SKATE PARK
Active Transport Strategy 2021 Page 19POTENTIAL BARRIERS
Despite the significant benefits of active transport, • Spatial
there are certain factors which can limit or challenge - The Tamworth urban area has a population
a person’s perceptions when choosing to take part density of 290 people per km² (via 2016
in forms of active transport. Knowing these factors Census) compared to Armidale (520
can assist in removing these barriers or limiting the people/km²), Coffs Harbour (490 people/
effect they may have on a person. Examples identified km²) and Orange (830 people/km²). This
through the consultation process are: low value corresponds to a large spread of
people, which can prove difficult for active
• Different ability levels: transport. It is important that connected,
- Estimated that 1 in 5 Australians are living efficient active transport links be provided
with some form of disability (via Australian across the Tamworth area to reduce this
Network on Disability 2019). Whilst not all barrier.
disabilities limit a person’s ability to walk or
cycle, it is often the case that they can
• Safety risk perceptions
restrict how a person utilises the active
transport network. - Safety plays a major role in how likely
someone will choose active transport
- A person’s health, fitness and confidence/
compared to other transport modes. This is
skill level can also restrict how they use
particularly the case for user groups such
active transport
as children, shift workers and the elderly.
Factors such as poor lighting, visibility, time
• Weather conditions: of day and constrained spaces all contribute
- Tamworth has a relatively low annual to safety risk perceptions of active transport.
rainfall compared to most coastal areas
in NSW with an average of 83 rain days
per year. However, temperatures in
summer often reach above 40°C. Rainy
days and days of extreme temperatures
can greatly restrict participation numbers
for active transport.
• Existing infrastructure:
- The connectivity of the existing active
transport network is a limiting factor in
active transport participation. Results from
a 2018 Cycling Survey undertaken by
Council indicated that 95% would cycle
more frequently if infrastructure is improved.
Page 20 Active Transport Strategy 2021OUR ACTION PRIORITIES
The visionary target set by Council to achieve 1 in 10 THEME 1 – ENCOURAGING ACTIVE
trips to work undertaken via active transport by 2031 TRANSPORT
will be achieved through the following six priorities:
Theme 1: Encouraging active transport To make active transport an attractive, fun and safe
mode of transport, the benefits need to be effectively
Theme 2: Providing a connected network
communicated in order to encourage behavioural
Theme 3: Providing a safe network
changes. There are very few people in the Tamworth
Theme 4: Ensuring an inclusive network and region participating in active transport, with only
accepting culture 4.5 per cent travelling to work using this method.
Theme 5: Pursuing a smart network A behavioural change facilitated through effective
Theme 6: Ensuring an affordable network communication methods is required for increasing
participation numbers in active transport. This can
Theme 7: Maintaining a suitable network
include promoting the various benefits of active
transport, and ensuring that attractive walking,
Low < $50,000 running and cycling events are provided.
Medium $50,000 - $1,000,000
High > $1,000,000
Delivery
No. ACTION Purpose Cost ($)
Timeframe
Active transport provides many benefits to individuals
Inform the community
and the community. Informing the wider community
1.1 about the benefits of 1-3 years Low
of these benefits through communication channels is
active transport
highly important in achieving the target vision.
Walking, running and cycling events are enjoyed
Actively seek to attract and
by many people with a wide range of abilities.
1.2 facilitate walking, running and Ongoing Low
Encouraging more events within the region helps
cycling events in the region
boost the profile of active transport
Walking trails often provide more challenges and
better scenery then their urban counterparts. These
trails are highly popular amongst those seeking
Improve existing mountain to escape the urban environment and challenge
bike and bush walking trails themselves whilst getting amongst the natural
1.3 throughout the LGA, and environment. Similarly, mountain bike trails provide 1-5 years Medium
identify areas for expanding a challenging and fun experience for those seeking
these facilities something different from the standard urban cycling
routes Improving both walking and mountain bike
trails will assist in encouraging increased usage of
these trails and safer use of these facilities.
Targeting short journey trips such as those to school
and work can greatly reduce urban congestion and
Encourage behavioural
improve the amenity of urban centres. Reducing the
change through targeted
1.4 number of private use vehicles also improves safety 1-3 years Medium
school and business
for pedestrians. Behavioural changes in schools and
programs
businesses can significantly contribute to achieving
the transport mode targets.
TABLE 3. PRIORITY 1 ACTIONS - ENCOURAGING ACTIVE TRANSPORT.
Active Transport Strategy 2021 Page 21THEME 2 – PROVIDING A CONNECTED NETWORK
Whilst there has been an increased focus on The primary network must also ensure that it captures
constructing active transport infrastructure in recent as many trip attractors as possible including schools,
years, there are still many gaps in Council’s existing aged care facilities, sporting precincts, retail centres
network. These gaps include missing footpath, shared and public transport routes.
path and on-road cycleway links which are all critical in
developing a connected active transport network.
Delivery
No. ACTION Purpose Cost ($)
Timeframe
Update and implement Footpaths and shared paths are critical in moving
2.1 footpath and shared path pedestrians and many cyclists around in a safe, 1-3 years High
priority programs efficient manner.
Pedestrian mobility infrastructure improvements
Identify pedestrian mobility
include disabled parking, shared paths, footpaths,
infrastructure improvements
2.2 kerb ramps, concrete medians, kerb blisters, tactile 1-3 years High
and develop an updated
markers, signage and line marking. These all aim to
works program
improve pedestrian mobility and safety.
Investigate additional Identify any further missing links or areas that may
locations that may benefit highly benefit from future improvements including
2.3 Ongoing Low
from future active transport line marking, footpaths/shared paths, signage,
improvements lighting and kerb ramps.
Capturing key trip attractors and public transport links
Plan infrastructure around within the active transport network such as schools,
2.4 key trip attractors and large employers, aged care facilities and bus pickups Ongoing Low
public transport ensures that the active transport network is highly
accessible
TABLE 4. PRIORITY 2 ACTIONS - PROVIDING A CONNECTED NETWORK.
Page 22 Active Transport Strategy 2021THEME 3 – PROVIDING A SAFE NETWORK
Pedestrians and cyclists are particularly vulnerable a perceived lack of safety being one of the main
when entering the road environment. It is highly barriers identified in limiting a person’s willingness to
important that the safety of those participating in participate in walking or cycling, well-designed safe
active transport is prioritised. With safety, or infrastructure is critical in removing this barrier.
Delivery
No. ACTION Purpose Cost ($)
Timeframe
The safety of vulnerable user groups such as the
Improve safety around elderly, children and those with disabilities is critical
3.1 schools and other high-risk when planning an active transport network. Having Ongoing Med
locations unsafe infrastructure means less people are inclined
to utilise active transport.
Entering the road environment for cyclists and
pedestrians presents a high number of potential
hazards. Limiting the number of times active
transport users must enter the road environment,
Improve safety of road the length of time in which they are in the road
3.2 crossings for cyclists and environment and the width of travel lanes they must Ongoing High
pedestrians traverse at one time are all methods for improving
safety. Investigating treatments such as kerb
extensions, centre medians and designated crossing
points all contribute to a safe active transport
network.
Where possible, providing separation between active
transport users and motorists greatly reduces the
likelihood of incidents occurring. Shared paths cater
Separate active transport
3.3 for the needs of the majority of active transport Ongoing High
users from busy roads
participants, however it is understood that on-road
cyclists reach much higher speeds which are unable
to be achieved through the use of shared paths.
Developing a greater presence of security cameras,
improved lighting and line-of-sight are critical in
Increased focus on reducing the safety hazard perception some people
3.4 1-3 years Med
surveillance may have with regards to active transport. Low levels
of lighting can greatly dissuade people participating
in active transport.
On-road cyclists are a key user group within the active
Identify key on road cycling transport space. These cyclists travel at much higher
routes and maintain to a speeds than those which are suitable along shared
3.5 suitable standard which paths. Providing a safe, connected environment with Ongoing High
allows for safe on-road suitable line marking, shoulder width and signage will
cycling improve the safety of cyclists and motorists sharing
the same space.
Road Safety Parks provide a safe place for children to
Identify suitable location/s learn road rules and practice safe walking and cycling
across the LGA for the behaviour. These parks feature miniature signage and
3.6 3-5 years Low
construction of additional line marking consistent with those found in the road
Road Safety Park/s environment to assist with improving cycling ability
and also knowledge around road rules.
TABLE 5. PRIORITY 3 ACTIONS - PROVIDING A SAFE NETWORK.
Active Transport Strategy 2021 Page 23THEME 4 – ENSURING AN INCLUSIVE NETWORK AND ACCEPTING CULTURE
Under the Disability Discrimination Act 1992, it is a Cyclists, particularly those using the on-road
requirement for infrastructure to be designed and environment are often the targets of unwarranted
constructed to a standard that is inclusive of all ability criticism and are subjected to the highest level of risk.
levels. The active transport network is no different, Improving the acceptance and awareness of cyclists in
with infrastructure required to be constructed that the community is critical to improving active transport
allows ease of access for all users. Routinely engaging numbers, and ensuring the safety of cyclists and
with key community stakeholders can identify areas motorists when sharing the same space.
that require access improvements.
Delivery
No. ACTION Purpose Cost ($)
Timeframe
There are many existing disabled parks that do not
Greater connectivity between have immediate or safe access to the adjoining
4.1 disabled parking spaces and footpath. Improving the connectivity between the 1-3 years Low
footpaths two will have safety benefits for those using disabled
parking spaces.
Where possible, all active transport infrastructure
Cater for all abilities and
is to be planned, designed and constructed in
4.2 ages when planning and Ongoing Low
accordance with the Disability Discrimination Act
constructing infrastructure
1992.
Liaising with a broad range of active transport
stakeholders such as schools, cycle clubs, aged care
Engage routinely with key
4.3 facilities, businesses and disability access groups will Ongoing Low
active transport stakeholders
provide continual feedback on the network and how
it can be further improved.
Cycling often attracts unwarranted disapproval,
Improve community particularly when undertaken in the road
acceptance of active environment. Improving the knowledge of both
4.4 Ongoing Low
transport, particularly cyclists and motorists when sharing the road
cycling environment is critical in developing an accepting
active transport culture.
TABLE 6. PRIORITY 4 ACTIONS - ENSURING AN INCLUSIVE NETWORK AND ACCEPTING CULTURE.
Page 24 Active Transport Strategy 2021THEME 5 – PURSUING A SMART NETWORK
Innovative ideas assist in improving the user also a crucial tool, allowing users to know where they
experience for cyclists and pedestrians. Along with are and where they need to go. It is important that
providing facilities for active transport users to rest new technologies and ideas which improve the user
along their journey and facilities at the end-of-trip experience are continually investigated.
locations to cater for bicycle storage, navigation is
Delivery
No. ACTION Purpose Cost ($)
Timeframe
Investigate the use of Smartphone applications allow active transport maps,
5.1 smartphone applications to points of interest, ‘refuel’ stations and end-of-trip 3-5 years Low
improve user experience. facilities to be accessed conveniently.
Signage is a great visual tool used to assist users in
Develop a network of navigating the active transport network. Wayfinding
5.2 wayfinding signage to signage is typically located at major intersections of 3-5 years Low
assist in navigation. the active transport network, informing users where
points of interest are and where to go.
Innovation can greatly improve efficiency and
Investigate innovative active safety of transport networks. Continually looking for
5.3 Ongoing Med
transport improvements. opportunities to implement innovative ideas has the
potential to improve the active transport network.
‘Recharge’ stations include water refill, seating, shelter
and lighting. These are ideally located at key points
Provide ‘recharge’ stations
along the active transport network and provide
5.4 along key active transport 3-5 years Med
users the opportunity to rest, have some water and
links.
continue on their journey. If poor weather sets in,
they may also provide the opportunity to seek shelter.
Investigate the feasibility of
Improving the safety and ease in which pedestrians
pedestrian countdown timers
cross the road environment is highly important in
5.5 and/or scramble crossings at 1-3 years Low
both reducing risk of injury, and assisting in making
high pedestrian use
walking a more attractive transport option
intersections
A Bicycle Hub within the Tamworth CBD will provide
Identify a suitable location a safe, secure and accessible location for the storage
for the construction of a of bicycles. This will enable improved access to the
5.6 1-3 years Low
Bicycle Hub within the CBD for those utilising active transport. End-of-
Tamworth CBD trip facilities are a critical component of all active
transport journeys.
TABLE 7. PRIORITY 5 ACTIONS - PURSUING A SMART NETWORK.
Active Transport Strategy 2021 Page 25THEME 6 – ENSURING AN AFFORDABLE NETWORK
With footpath and shared path costing roughly $210 possible, new developments or other infrastructure
and $350 per lineal metre respectively, prioritisation of projects should be making allowances for active
the proposed network is extremely important. In order transport infrastructure in order to fill in missing
to fast-track these priority programs, external funding network links and further extend the network.
is to be sought on a continual basis. Also where
Delivery
No. ACTION Purpose Cost ($)
Timeframe
Implementing actions outlined in this strategy will
require a substantial amount of funding over an
Actively seek external grant
6.1 extended period of time. It is important that external Ongoing Low
funding
grant funding be applied for in order to fund network
improvements and fast-track their implementation.
Ensure all new capital works Any works that Council is either facilitating or has
6.2 include provisions for active some control of design processes over, the provision Ongoing Low
transport where practicable of active transport infrastructure is to be considered.
Achieving the transport mode share targets outlined
within this strategy and reducing the dependency on
Aim to reduce private vehicle private vehicle transport will result in many savings
6.3 Ongoing Low
dependency including reduction in new car park construction,
reduced congestion (improved road network
efficiencies) and savings to the individual
TABLE 8. PRIORITY 6 ACTIONS - ENSURING AN AFFORDABLE NETWORK.
THEME 7 – MAINTAINING A SUITABLE NETWORK
With many users of the active transport in the scheduled for appropriate maintenance, renewal or
vulnerable users category (children, the elderly and replacement. Achieving this requires a collaborative
some disabilities), it is important that defective active effort between community reporting of defects, and
transport infrastructure be made aware of and the ongoing implementation of inspection programs.
Delivery
No. ACTION Purpose Cost ($)
Timeframe
Develop and implement Inspection schedules assist in obtaining condition
7.1 inspection schedules for the data and subsequently developing maintenance and/ 3-5 years Low
active transport network or renewal timeframes.
Shared paths and on-road facilities often experience
accumulation of silt/material and also growth
Ensure the primary shared
of weeds/grass adjacent to these facilities. It is
path network and on-road
7.2 important that these facilities are maintained to a Ongoing Med
facilities are maintained to a
high standard in order to encourage usage of the
high standard
facilities and ensure the safety of those utilising the
network.
TABLE 9. PRIORITY 7 ACTIONS - MAINTAINING A SUITABLE NETWORK.
Page 26 Active Transport Strategy 2021OUR NEXT STEPS
Achieving the actions and outcomes within the Active Transport Strategy will require a combined effort over the next 10
years between Tamworth Regional Council, the State Government, private businesses and the community.
MONITORING AND EVALUATION
Ongoing monitoring and evaluation of the actions outlined within the Strategy ensure that the intent and vision of
the Strategy is being achieved. Tamworth Regional Council will undertake the following monitoring and evaluation
techniques:
Data Source How Data is Gathered What Data Achieves Frequency
Cycling and Either manually or using Number of cyclists and pedestrians using particular Every 2
Pedestrian Counts automated counters links years
Community Every 2
Online surveys Information regarding all aspects of active transport
Surveys years
Gives insight into number of and severity of crashes
Crash Data NSW Centre for Road Safety Every 1 year
involving pedestrians and cyclists
Stakeholder Face-to-face or informal Ongoing feedback relating to cycling and walking
Ongoing
Engagement meetings network
Walking and
Event attendance numbers Target improvements to certain areas Ongoing
Cycling Events
Information regarding journey to work mode of
Survey of each household in Every 5
Census Data transport which is used as a measuring tool in how
Australia years
successful the active transport network is
TABLE 10. MONITORING AND EVALUATION TECHNIQUES FOR PRIORITY ACTIONS.
Reviews of the Strategy will be undertaken on a periodic basis in response to data monitoring and evaluation.
Active Transport Strategy 2021 Page 27FUNDING AND DELIVERY
Funding for the Active Transport Strategy will require • A portion of Section 7.11 funding is used to construct
a joint effort between Tamworth Regional Council new shared paths and footpaths, particularly missing
and the State and Federal Governments through sections linking areas of development
funding initiatives. With identified priority programs
for pedestrian and cycling infrastructure, funding these State and Federal Funding
and other infrastructure described within the Strategy
is to be achieved through: • Due to limited internal funding for active transport
infrastructure, external grant funding opportunities
Internal Funding through the State and Federal Government are to be
actively applied for
• Council currently allocates around $60,000 per year
for the construction of new footpath and shared • Without receiving State or Federal funding for
path and a further $30,000 per year for pedestrian active transport, the implementation of outlined
facilities including concrete medians, pram ramps infrastructure improvements will take a substantially
and other mobility improvements. longer period of time
Section 7.11 Developer Contributions
• Section 7.11 contributions enables Council to levy
contributions for public amenities and services
(including footpaths/shared paths) as a consequence
of development to ensure that appropriate
infrastructure is constructed which meets the needs
of the development
SUMMARY OF PRIORITY ACTIONS
No. Action Purpose Timeframe Cost ($)
1.0 – Encouraging active transport
Active transport provides many benefits to individuals and
Inform the community
the community. Informing the wider community of these
1.1 about the benefits of 1-3 years Low
benefits through communication channels is highly important
active transport
in achieving the target vision.
Actively seek to attract Walking, running and cycling events are enjoyed by many
and facilitate walking, people with a wide range of abilities. Encouraging more
1.2 Ongoing Low
running and cycling events within the region helps boost the profile of active
events in the region transport
Walking trails often provide more challenges and better
scenery then their urban counterparts. These trails are
Improve existing
highly popular amongst those seeking to escape the urban
mountain bike and
environment and challenge themselves whilst getting
bush walking trails
amongst the natural environment. Similarly, mountain bike
1.3 throughout the LGA, 1-5 years Medium
trails provide a challenging and fun experience for those
and identify areas
seeking something different from the standard urban cycling
for expanding these
routes Improving both walking and mountain bike trails will
facilities
assist in encouraging increased usage of these trails and
safer use of these facilities.
Targeting short journey trips such as those to school and
work can greatly reduce urban congestion and improve
Encourage behavioural
the amenity of urban centres. Reducing the number of
change through
1.4 private use vehicles also improves safety for pedestrians. 1-3 years Low
targeted school and
Behavioural changes in schools and businesses can
business programs
significantly contribute to achieving the transport mode
targets.
Page 28 Active Transport Strategy 2021No. Action Purpose Timeframe Cost ($)
2.0 – Providing a connected network
Update and implement Footpaths and shared paths are critical in moving
2.1 footpath and shared pedestrians and many cyclists around in a safe, efficient 1-3 years High
path priority programs manner.
Identify pedestrian Pedestrian mobility infrastructure improvements include
mobility infrastructure disabled parking, shared paths, footpaths, kerb ramps,
2.2 improvements and concrete medians, kerb blisters, tactile markers, signage and 1-3 years High
develop an updated line marking. These all aim to improve pedestrian mobility
works program and safety.
Investigate additional
locations that may Identify any further missing links or areas that may highly
2.3 benefit from future benefit from future improvements including line marking, Ongoing Low
active transport footpaths/shared paths, signage, lighting and kerb ramps.
improvements
Plan infrastructure Capturing key trip attractors and public transport links
around key trip within the active transport network such as schools, large
2.4 Ongoing Low
attractors and public employers, aged care facilities and bus pickups ensures that
transport the active transport network is highly accessible
No. Action Purpose Timeframe Cost ($)
3.0 – Providing a safe network
The safety of vulnerable user groups such as the elderly,
Improve safety around
children and those with disabilities is critical when planning
3.1 schools and other Ongoing Med
an active transport network. Having unsafe infrastructure
high-risk locations
means less people are inclined to utilise active transport.
Entering the road environment for cyclists and pedestrians
presents a high number of potential hazards. Limiting the
number of times active transport users must enter the road
Improve safety of road environment, the length of time in which they are in the
3.2 crossings for cyclists road environment and the width of travel lanes they must Ongoing Med
and pedestrians traverse at one time are all methods for improving safety.
Investigating treatments such as kerb extensions, centre
medians and designated crossing points all contribute to a
safe active transport network.
Where possible, providing separation between active
transport users and motorists greatly reduces the likelihood
Separate active of incidents occurring. Shared paths cater for the needs of
3.3 transport users from the majority of active transport participants, however it is Ongoing High
busy roads understood that on-road cyclists reach much higher speeds
which are unable to be achieved through the use of shared
paths.
Developing a greater presence of security cameras,
improved lighting and line-of-sight are critical in reducing
Increased focus on
3.4 the safety hazard perception some people may have with 1-3 years Med
surveillance
regards to active transport. Low levels of lighting can greatly
dissuade people participating in active transport.
Active Transport Strategy 2021 Page 29On-road cyclists are a key user group within the active
Identify key on road
transport space. These cyclists travel at much higher speeds
cycling routes and
than those which are suitable along shared paths. Providing
3.5 maintain to a suitable Ongoing High
a safe, connected environment with suitable line marking,
standard which allows
shoulder width and signage will improve the safety of
for safe on-road cycling
cyclists and motorists sharing the same space.
Identify suitable Road Safety Parks provide a safe place for children to learn
location/s across road rules and practice safe walking and cycling behaviour.
the LGA for the These parks feature miniature signage and line marking
3.6 3-5 years Low
construction of consistent with those found in the road environment to
additional Road assist with improving cycling ability and also knowledge
Safety Park/s around road rules.
No. Action Purpose Timeframe Cost ($)
4.0 – Ensuring an inclusive network and accepting culture
Greater connectivity There are many existing disabled parks that do not have
between disabled immediate or safe access to the adjoining footpath.
4.1 1-3 years Low
parking spaces and Improving the connectivity between the two will have safety
footpaths benefits for those using disabled parking spaces.
Cater for all abilities
and ages when Where possible, all active transport infrastructure is to be
4.2 planning and planned, designed and constructed in accordance with the Ongoing Low
constructing Disability Discrimination Act 1992.
infrastructure
Liaising with a broad range of active transport stakeholders
Engage routinely with
such as schools, cycle clubs, aged care facilities, businesses
4.3 key active transport Ongoing Low
and disability access groups will provide continual feedback
stakeholders
on the network and how it can be further improved.
Cycling often attracts unwarranted disapproval, particularly
Improve community
when undertaken in the road environment. Improving the
acceptance of active
4.4 knowledge of both cyclists and motorists when sharing the Ongoing Low
transport, particularly
road environment is critical in developing an accepting active
cycling
transport culture.
Page 30 Active Transport Strategy 2021You can also read