Addendum 2 - An Update to the Indiana Bat Summer Survey Level of Effort Trigger and to Include Minimum Recommended Effort for Northern Long-eared Bats
←
→
Page content transcription
If your browser does not render page correctly, please read the page content below
Addendum 2 – An Update to the Indiana Bat Summer Survey Level of Effort Trigger and
          to Include Minimum Recommended Effort for Northern Long-eared Bats
                                                 March 2022
     Mike P. Armstrong 1, R. Andrew King 2, Robyn A. Niver 3, Jill S. Utrup4, Vona Kuczynska 5,
        Emily D. Thorne 6, Jesse De La Cruz6, Sabrina M. Deeley6, Katherine M. Gorman6,
                    Alexander Silvis 7, Robin E. Russell 8 and W. Mark Ford 9

Introduction
This provides an update to the Methods to Evaluate and Develop Minimum Recommended
Summer Survey Effort for Indiana Bats: White Paper (Niver et al. 2014) and the subsequent
Addendum 1 (Niver et al. 2018). Given that impacts from white-nose syndrome (WNS) continue
to result in population declines to Indiana bats (IBAT, Myotis sodalis) in the Northeast (where
the disease was initially discovered) and with varying degrees across the entire range of the
species, the U.S. Fish and Wildlife Service (Service) has taken an adaptive management
approach by periodically examining current data and when warranted, revising the Range-wide
Indiana Bat Survey Guidelines and associated recommended summer survey effort. This update
considers IBAT and northern long-eared bat (NLEB, Myotis septentrionalis) population declines
due to WNS and incorporates additional survey data for both species. We previously lacked
sufficient data to provide species-specific survey level of effort (LOE) recommendations for the
NLEB separately from the IBAT, but recently collected data (2017-2021) have now made this
possible.
This addendum provides 1) an assessment for reexamining the Service’s “trigger” to modify
IBAT survey LOE values for mist-netting for the Midwest and Ozark-Central recovery units
(RU) and 2) provides a range-wide minimum recommended LOE for surveys for the NLEB.
Herein, we only discuss sections where changes have been made from the previous white paper
(Niver et al. 2014) and subsequent addendum (Niver et al. 2018) and defer to these previous
versions for unchanged sections. For example, equations for determining LOE (methodology)
remain the same as used previously (Niver et al. 2014, Niver et al. 2018) for both acoustics and
mist-netting; therefore, that section is not included in this update.

1
  U.S. Fish and Wildlife Service, Frankfort, KY
2
  U.S. Fish and Wildlife Service, Bloomington, IN
3
  U.S. Fish and Wildlife Service, Headquarters
4
    U.S. Fish and Wildlife Service, Bloomington, MN
5
    U.S. Fish and Wildlife Service, Columbia, MO
6
  Virginia Polytechnic Institute and State University, Blacksburg, VA
7
  West Virginia Division of Natural Resources, Elkins, WV
8
  U.S. Fish and Wildlife Service, Fort Collins, CO
9
  U.S. Geological Survey, Blacksburg, VA

                                                      1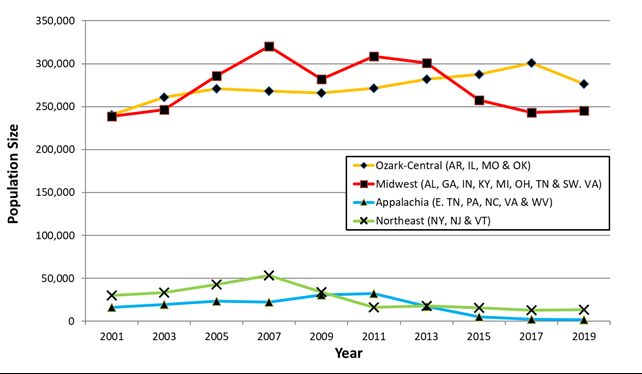
Methods
Updated Acoustic Data Sources
The U.S. Geological Survey (USGS) and Virginia Polytechnic Institute and State University
(VPISU) with assistance of personnel from Alabama Wildlife and Freshwater Fisheries,
Cleveland Metro Parks, Georgia Division of Natural Resources, Missouri Botanical Garden,
North Carolina Wildlife Resources Commission, Tennessee Wildlife Resources Agency, U.S.
Army, U.S. Forest Service, U.S. Fish and Wildlife, Virginia Department of Conservation and
Recreation Service, conducted full spectrum and frequency-division/zero-crossing acoustic
surveys during the summer of 2020 and 2021 at 16 and 29 sites, respectively, of IBAT and/or
NLEB maternity colonies in Alabama, Arkansas, Georgia, Illinois, Indiana, Kentucky, Missouri,
New Jersey, New York, North Carolina, Ohio, Tennessee, Virginia, West Virginia and
Wisconsin (Figure 1). For IBATs, this expanded the post-WNS number of survey sites where the
species was confirmed as present from 4 in 2017 (included in 2018 addendum) to 8 in 2020, and
finally to 13 in 2021. For NLEBs, 2020 data collection included 10 survey sites and 12 in 2021.
An additional 6 sites for IBATs and 8 sites for NLEBs each were considered “within range” but
without documented maternity colonies in 2020, and 12 and 15, respectively, for 2021 LOE
assessment modeling. Nights when detectors were deployed and minimum weather standards
were not met were coded as “rain.”
Mist-netting Data Sources
There were no targeted mist-netting studies for NLEBs in 2020 and only limited surveys
occurred in New York and Virginia that were not sufficient in duration for inclusion herein,
though in both states, NLEBs were captured. However, the USGS and VPISU analyzed recent
NLEB mist-netting capture records (2016-2019) from known NLEB post-WNS maternity colony
sites from the District of Columbia, New York, North Carolina and West Virginia (Figure 1).
Estimating Detection Probabilities and Occupancy Rates for Acoustics and Mist-netting
The USGS and VPISU analyzed the resulting detection histories following MacKenzie et al.
(2002) using the R software package unmarked to estimate nightly occupancy (Ψ) detection
probability (ρ) (https://cran.r-project.org/web/packages/unmarked/index.html) for the various
geographic locations across the acoustic survey effort for IBATs and NLEBs and mist-netting for
NLEBs (Figure 1). The USGS compared models incorporating the IBAT RUs: Appalachian,
Ozark-Central, Midwest, and Northeast and an additional group of Southeast U.S. sites located
outside of the IBAT RUs, but within the NLEB range. Comparisons were based upon AIC
values, with an information-theoretic approach to model selection, with smaller values generally
indicating a more parsimonious model (Burnham and Anderson 2002). For consistency with
existing recommendations and since RUs have not been designated for the NLEB, sites for the
NLEB were also partitioned by IBAT RUs.
Sites that fell outside of currently designated IBAT RU boundaries, but that have been confirmed
to have IBAT or NLEBs following the original RU designations were assigned to the nearest
RU. For IBAT, presence at Fort A.P. Hill in Virginia and for NLEB presence and Marine Corps
Base-Quantico in Virginia were assigned to the Appalachian RU. The NLEB presence at

                                               2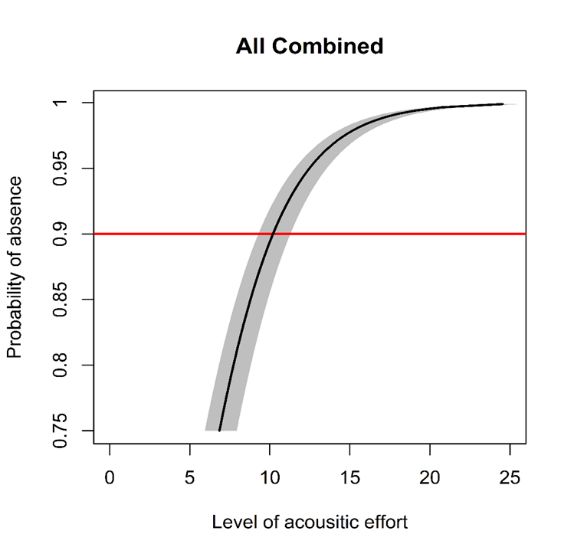
Governor Dodge State Park and Horicon Marsh National Wildlife Refuge was assigned to the
Midwest RU (Figure 1). Sites located in the Southeast (i.e., Georgia and North Carolina) and far
outside of previously designated IBAT RUs were placed in a Southeast group. These sites
included Whitehall Forest and Ocumulgee WMA in Georgia and Pineola Bog and North River
Game Land in North Carolina that were surveyed to begin data collection for tricolored bat
(Perimyotis subflavus) and/or little brown bat (Myotis lucifugus) as was a site with tricolored bat
presence at Jessieville-Winona Fourche Ranger District in Arkansas assigned to the Ozark-
Central RU (Figure 1).
Acoustic data model covariates included 1) binary designations of recent confirmed presence of
a maternity colony versus possible maternity colony presence from being “within range” (Roost),
2) no rain versus rain (Rain), 3) site variables of detector placement within a) interior forest, b)
forest riparian/wetland and c) forest/field edge (Habitat) and 4) geographic region (Region).
NLEB mist-netting model covariates were 1) day of year (DOY), 2) month, 3) year and 4)
region.
Results
Indiana Bats Acoustics
The number of rain-free detector nights for all IBAT and other species discussed below across all
RU’s by individual detector ranged from 7 to 90 (55.01 ± 1.59 nights). The best supported model
for predicting probability of occurrence and site occupancy of IBATs was ρ(Roost),Ψ(Region);
however, the ρ (Rain+Roost)Ψ(Region) was within 1.85 AIC units and considered the most
informative for survey protocol purposes since nights not meeting required weather standards are
excluded for monitoring purposes (Table 1). Occupancy varied greatly by region (Table 2).
Potential LOE was calculated by regions from sites with known maternity colonies for nights
with no rain. At α = 0.1, the Ozark-Central RU returned the longest required LOE of ~ 10
detector nights, with ~ 9 detectors nights in the Midwest, with ~ 6 detector nights in the
Northeast, with ~ 4 detector nights at the Southeast sites outside the designated RUs, and ~ 3
detector nights in the Appalachians (Table 2, Figure 2).
Northern Long-eared Bats Acoustics
The best supported acoustic model (post-WNS) for NLEBs was ρ(Rain+Roost),
Ψ(Region+Habitat), though ρ(Rain+Roost), Ψ(Region) was within 2.16 AIC units (Table 3).
Similar to IBATs, occupancy varied by region, as more survey sites contained recent known
maternity colonies (Table 4). The LOE was calculated by regions from sites with (recent) known
maternity colonies for nights with no rain inclusive of all habitat types using the ρ(Rain+Roost),
Ψ(Region). At α = 0.1, the Ozark-Central RU returned the longest required LOE of ~14 detector
nights, with ~13 detector nights in the Midwest, ~12 detector nights in the Southeast, ~9 detector
nights in the Appalachians, and ~ 6 detector nights in the Northeast (Table 4, Figure 3).
Northern Long-eared Bats Mist-netting
The best supported mist-netting model (post-WNS) for NLEBs where maternity colonies were
known was ρ (DOY) Ψ(.).; however, there were 3 other models that also had strong empirical

                                                 3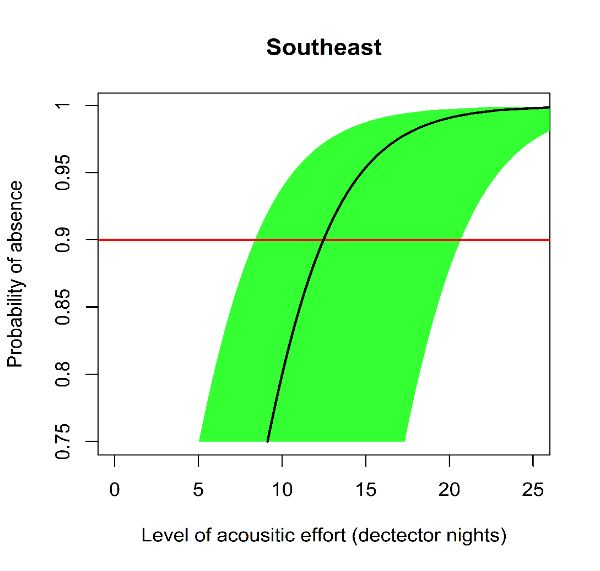
support (∆AICc < 2) and were considered competing (Table 5). No geographic covariate (i.e.,
region or state) contributed, indicating variability was temporal (less with increasing years,
summer months within a year, or days within the summer season). As such and owing to the
similar AICc weights among competing models, we used ρ (.) Ψ(.) as our selected model. Using
our selected model, the LOE at α = 0.1 showed that ~16 net-nights are required (Table 6, Figure
4).
Survey Implications
Indiana Bat LOE
Based on our findings, we recommend an increase in the IBAT acoustic LOE from 8 to 10 rain-
free detector nights for non-linear projects (per 123 acres) and from 2 to 4 detector nights per km
of suitable habitat for linear projects starting in 2022(Table 7). We also recommend that mist
netting LOE remain the same as previous years with 42 net-nights for non-linear projects and 10
net-nights for linear projects necessary in the Northeast and Appalachian RUs and 9 and 2 net-
nights, respectively, for the Midwest and Ozark-Central RUs (Table 7).
Updated Indiana Bat LOE Trigger Analysis
Since 2014, the Service has required a significantly higher LOE for mist net surveys within fully
“WNS-impacted” IBAT RUs (Northeast and Appalachian) than in RUs that had not yet been as
severely impacted by WNS (Midwest and Ozark-Central) (Figure 5). Niver et al. (2014)
originally recommended that a RU be considered “WNS-impacted” if 1) it has a ≥30% decline in
its total RU population (Trigger #1), or 2) if ≥50% of Priority 1 and 2 IBAT hibernacula within a
RU decline by ≥30% from their most recent pre-WNS population estimates (Trigger #2).
Because the Northeast and Appalachian RUs are already considered to be WNS-impacted, the
trigger analyses are only needed for the Midwest and Ozark-Central RUs. For these analyses, the
most recent "pre-WNS" population estimates are from 2011 and 2013 for the Midwest and
Ozark-Central RUs, respectively. We have been conducting a new trigger analysis approximately
every two years as new winter population data become available from state and federal partners.
Results from a recently completed trigger analysis using 2019 data are presented in Table 8.
Based on these recent data, Trigger #1 has not yet been met for the Midwest or Ozark-Central
RUs. Numerically speaking, the RU-wide numbers in these RUs have not experienced the same
magnitude of WNS-associated declines as seen in the Northeast and Appalachian RUs, whereby
2014, had suffered approximately 70% and 90% declines, respectively. Overall population
declines in the Midwest and Ozark-Central have been less severe over time than in the eastern
RUs. In contrast, Trigger #2 has been numerically met in both the Midwest and Ozark-Central
RUs, indicating that at least half of the largest hibernacula in both RUs have experienced
considerable population declines (≥30%) since WNS arrived. As noted in the recent 5-year
review (FWS 2019) and further supported by this trigger analysis, the winter distribution of
IBAT populations apparently has changed after the arrival of WNS in these RUs, with remaining
populations becoming more concentrated into fewer, large Priority 1 and 2 sites within their
respective geographic regions.

                                                 4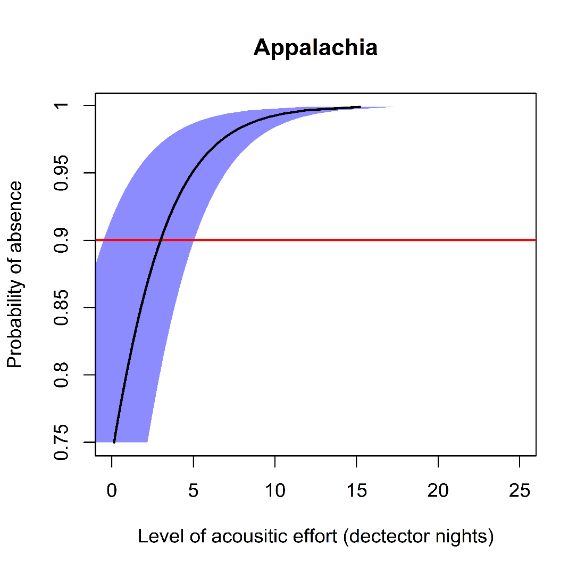
Because a large disparity remains in the overall percentage of post-WNS population decline
between the Midwest and Ozark-Central RUs, and the Northeast and Appalachian RUs, we
paused to reassess the wording and intent of our originally defined triggers. The primary reasons
the Ozark-Central RU has only experienced 2% decline post-WNS is because the vast majority
of IBATs overwinter in two very large sites (Lime Kiln Mine in MO and Magazine Mine in IL),
one of which has experienced a relatively small decline and the other has actually had significant
growth in population size since the onset of WNS.
Solution—The Service has decided to revise the 2014 trigger standard to now require that
both Trigger #1 and Trigger #2 need to be met rather than just one or the other as
originally written. Thus, the Midwest and Ozark-Central RUs will remain at the lower
LOE for mist netting until such time that Trigger #1 has also been met. For future years,
as effects of WNS on summer survey results are better calibrated, it may require revising
the summer guidance by subunits smaller than the current RU. We recommend
continuing to evaluate summer netting and acoustic detection probabilities and occupancy
rates and/or winter count information but also exploring how additional geo-spatial
analyses of winter populations may improve our decision-making process.
Northern Long-eared Bat LOE
We now have sufficient data available to provide acoustic and netting minimum LOE
recommendations specifically for the NLEB for the first time. Although there were differences in
recommended acoustic LOE across the range, starting in 2022, we recommend using a range-
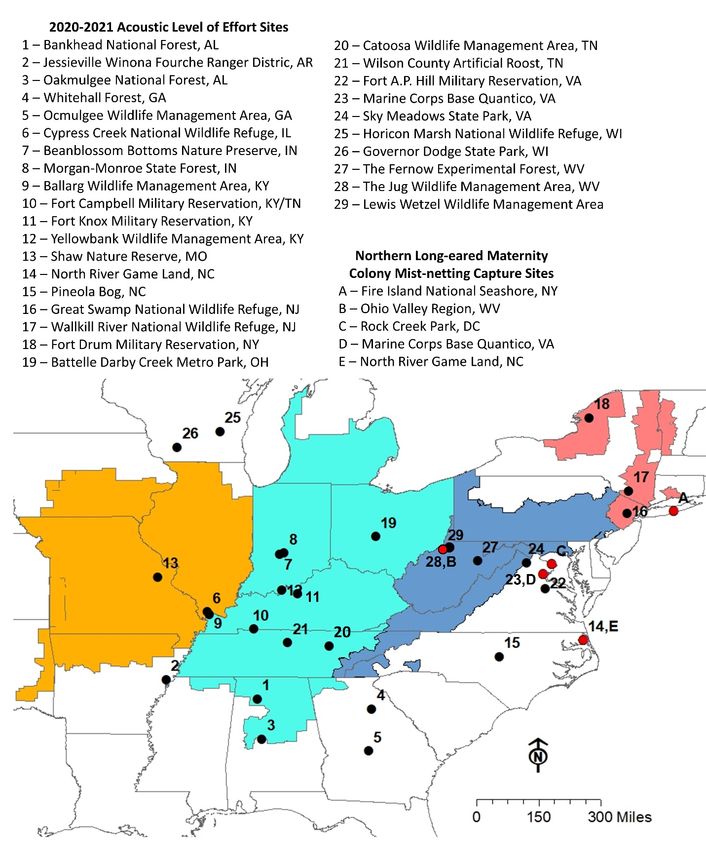
wide LOE of 14 detector nights or 16 net nights for non-linear projects (FIGURE 1. U.S. Fish and Wildlife Service acoustic level of effort monitoring sites May-
August, 2020-2021 (black dots) and netting level of effort calculated from current and recent
past (2016-2019) NLEB (Myotis septentrionalis) study sites (red dots). Shaded areas represent
the four IBAT Recovery Units (orange=Ozark-Central, cyan=Midwest, blue=Appalachian, and
pink=Northeast).
6TABLE 1. Akaike Information Criterion (AIC) table for IBAT (Myotis sodalis) acoustic
occupancy and detection models, May-August, 2020-2021. Covariates were Roost (confirmed or
within range; binary), Rain (rain or no rain on nightly basis; binary), Region (Appalachian,
Ozark-Central, Midwest, and Northeast recovery units and Southeastern sites; categorical) and
Habitat Type (forest, riparian/wetland or forest/field edge; categorical).
Model AICc ΔAICc wi K
P(roost) Ψ(region) 7749.29 0.00 0.59 7
P(rain+roost) Ψ(region) 7751.14 1.85 0.23 8
P(roost) Ψ(region+habitat) 7752.28 2.99 0.13 9
P(rain+roost) Ψ(region+habitat) 7754.19 4.90 0.05 10
P(roost) Ψ(.) 7767.87 18.58 0.00 3
P(rain+roost) Ψ(.) 7769.66 20.36 0.00 4
P(roost) Ψ(habitat) 7771.24 21.95 0.00 5
P(rain+roost) Ψ(habitat) 7773.05 23.76 0.00 6
P(year) Ψ(.) 7817.70 68.40 0.00 4
P(.) Ψ(region) 7873.44 124.15 0.00 6
P(rain) Ψ(region) 7874.98 125.69 0.00 7
P(.) Ψ(region+habitat) 7876.50 127.21 0.00 8
P(rain) Ψ(region+habitat) 7878.10 128.80 0.00 9
P(.) Ψ(.) 7892.40 143.10 0.00 2
P(.) Ψ(Year) 7894.26 144.97 0.00 4
p(.) Ψ(habitat) 7895.82 146.52 0.00 4
P(rain) Ψ(habitat) 7897.33 148.04 0.00 5
7TABLE 2. Level of survey effort required (acoustic detector nights for non-linear projects) to reach certainty of absence at given
alpha levels for the IBAT (Myotis sodalis) within known maternity colony areas for the Appalachian, Ozark-Central, Midwest and
Northeast recovery units and Southeast sites based on the top supported model, May-August, 2020-2021.
Within a Known Maternity
Area Occupancy and Detection Detector Nights required at set α
No.
Detector
Region sites used Ψ SE ρ SE 0.001 0.01 0.05 0.10 0.20 0.25
Appalachia 42 0.26 0.09 0.32 0.01 15.20 9.20 4.92 2.99 0.88 0.14
Midwest 61 0.75 0.06 0.32 0.01 20.76 14.76 10.48 8.55 6.44 5.70
Northeast 17 0.50 0.09 0.32 0.01 17.91 11.91 7.63 5.70 3.59 2.85
Ozark-Central 20 0.85 0.08 0.32 0.01 22.41 16.41 12.13 10.19 8.09 7.35
Southeast 2 0.37 0.15 0.32 0.01 16.53 10.53 6.25 4.32 2.21 1.47
All 142 0.60 0.04 0.32 0.01 18.96 12.97 8.69 6.75 4.65 3.90
8FIGURE 2. Acoustic level of effort with 95% confidence interval for IBAT (Myotis sodalis) at
sites with known maternity roosts for Appalachian, Ozark-Central, Midwest and Northeast IBAT
recovery units and Southeast sites as well as range-wide. Red line indicates the 90% confidence
level for probability of absence.
9TABLE 3. Akaike Information Criterion (AIC) table for NLEB (Myotis septentrionalis) acoustic
occupancy and detection models, May-August, 2020-2021. Covariates were Roost (confirmed or
within range; binary), Rain (rain or no rain on nightly basis; binary), Region (using Appalachian,
Ozark-Central, Midwest, and Northeast IBAT [Myotis sodalis] recovery units and Southeastsites;
categorical) and Habitat Type (forest, riparian/wetland or forest/field edge; categorical).
Model AICc ΔAICc wi K
P(rain+roost) Ψ(region+habitat) 9281.93 0.00 0.75 11
P(rain+roost) Ψ(region) 9284.09 2.16 0.25 9
P(rain+roost) Ψ(habitat) 9296.01 14.08 0.00 7
P(rain+roost) Ψ(.) 9298.60 16.67 0.00 5
P(roost) Ψ(region+habitat) 9302.35 20.42 0.00 10
P(roost) Ψ(region) 9304.60 22.67 0.00 8
P(roost) Ψ(habitat) 9316.61 34.68 0.00 6
P(roost) Ψ(.) 9319.34 37.41 0.00 4
P(rain) Ψ(region+habitat) 9337.26 55.33 0.00 9
P(rain) Ψ(region) 9339.34 57.41 0.00 7
P(rain) Ψ(habitat) 9350.97 69.04 0.00 5
P(rain) Ψ(.) 9353.58 71.65 0.00 3
P(.) Ψ(region+habitat) 9356.88 74.95 0.00 8
P(.) Ψ(region) 9359.03 77.10 0.00 6
P(.) Ψ(habitat) 9370.71 88.78 0.00 4
P(.) Ψ(.) 9373.38 91.45 0.00 2
P(.) Ψ(year) 9374.37 92.44 0.00 4
10TABLE 4. Level of survey effort required (acoustic detector nights for non-linear projects) to reach certainty of absence at given
alpha levels for NLEB (Myotis septentrionalis) using the Appalachian, Ozark-Central, Midwest and Northeast IBAT (Myotis sodalis)
recovery units and Southeast sites based on the top supported model, May-August, 2020-2021.
Occupancy and
Detection Detector Nights required at set α
No.
Detect
or
sites
Region used Ψ SE ρ SE 0.001 0.01 0.05 0.1 0.2 0.25
Appalachian 46 0.68 0.07 0.28 0.01 23.29 16.25 11.23 8.96 6.49 5.61
Midwest 60 0.90 0.04 0.28 0.01 27.71 20.68 15.65 13.38 10.91 10.03
Northeast 18 0.44 0.10 0.28 0.01 20.29 13.25 8.23 5.95 3.49 2.61
Ozark-Central. 20 0.91 0.07 0.28 0.01 28.07 21.03 16.01 13.73 11.26 10.39
Southeast 11 0.87 0.12 0.28 0.01 26.81 19.77 14.75 12.48 10.01 9.13
All 155 0.76 0.03 0.28 0.01 24.53 17.50 12.47 10.20 7.73 6.85
11FIGURE 3. Acoustic level of effort with 95% confidence interval for NLEB (Myotis
septentrionalis) at sites with known maternity roosts using the Appalachian, Ozark-Central,
Midwest and Northeast IBAT (Myotis sodalis) recovery units and Southeast sites as well as
range-wide. Red line indicates the 90% confidence level for probability of absence.
12TABLE 5. Akaike Information Criterion (AIC) table for NLEB (Myotis septentrionalis) mist-
netting occupancy and detection models at known maternity colony areas, 2016-2019 (see Figure
1). Covariates were DOY (day of year; continuous), Month (categorical), year (categorical),
Region (Appalachian, Ozark-Central, Midwest, Northeast IBAT [Myotis sodalis] recovery units
and Southeast sites; categorical) and State (state; categorical).
Model K AICc ∆ AICc Wi
ρ (DOY) Ψ(.) 3 368.95 0.00 0.22
ρ (.) Ψ(Month) 6 369.03 0.08 0.21
ρ (.) Ψ(.) 2 369.60 0.65 0.16
ρ (DOY) Ψ(Month) 7 370.68 1.73 0.09
ρ (.) Ψ(Year) 6 370.92 1.97 0.08
ρ (.) Ψ(Region) 4 371.91 2.96 0.05
ρ (.) Ψ(Month+Region) 8 372.08 3.12 0.05
ρ (DOY) Ψ(Year) 7 372.29 3.34 0.04
ρ (DOY) Ψ(Region) 5 372.76 3.81 0.03
ρ (.) Ψ(State) 6 373.62 4.67 0.02
ρ (DOY) Ψ(Month+Region) 9 373.90 4.95 0.02
ρ (.) Ψ(Year+Region) 8 375.07 6.12 0.01
ρ (DOY) Ψ(State) 7 375.32 6.37 0.01
ρ (DOY) Ψ(Year+Region) 9 375.97 7.02 0.01
TABLE 6. Level of mist-netting survey effort required (net nights) to reach certainty of absence
at given alpha levels for NLEB (Myotis septentrionalis) based on top supported model, 2016-
2019 (see Figure 1).
Occupancy and Detection Days required at set α
Ψ SE ρ SE 0.001 0.01 0.05 0.1 0.2 0.25
0.92 0.16 0.25 0.05 32.50 24.46 18.72 16.13 13.31 12.31
13`
FIGURE 4. Range-wide mist-netting level of effort with 95% credible interval for NLEB
(Myotis septentrionalis) at sites with known maternity roosts, 2016-2019 (see Figure 1). Red line
indicates the 90% confidence level for probability of absence.
14TABLE 7. The U.S. Fish and Wildlife Service’s recommended minimum survey level of effort
for presence/probable absence surveys for the IBAT (Myotis sodalis) and the NLEB (Myotis
septentrionalis) for linear and non-linear projects.
Indiana Bat Northern Long-eared Bat
Netting Acoustic Netting Acoustic
(net nights) (detector nights) (net nights) (detector nights)
Northeast & Midwest &
Appalachian Ozark- Range-wide Range-wide Range-wide
RUs Central RUs
Linear
Projects 10 2 4 4 4
(per km of
habitat)
Non-linear
Projects 42 9 10 16 14
(per 123 ac.
of habitat)
WNS
WNS
WNS
WNS
FIGURE 5. IBAT (Myotis sodalis) population estimates by recovery unit from 2001 to 2019.
(color-coded arrows depict approximate time of arrival of white-nose syndrome within multiple
sites in each Recovery Unit).
15TABLE 8. Updated trigger analysis for IBAT (Myotis sodalis) mist net survey LOE for the Midwest and Ozark-Central Recovery
Units (RU) using the most recent population data available (i.e., 2019 data).
TRIGGER #1: TRIGGER #2:
Has the RU as a whole experienced ≥30% decline Have ≥50% of P1 and P2 sites in the RU had a ≥30% decline
from its most recent pre-WNS population estimate? from their most recent pre-WNS population estimates?
(Analysis included all P1 andP2 sites with ≥1,000 IBATs in the most
Recovery Unit recent pre-WNS year.)
Midwest NO. YES.
(pre-WNS = 2011) 20% decline from 2011-2019. 14 out of 28 sites or 50% have experienced a ≥30% decline
post-WNS.
An additional loss of 29,628 bats would be required
to meet this trigger.
Ozark-Central NO. YES.
(pre-WNS = 2013) 2% decline from 2013-2019. 9 out of 17 sites or 53% have experienced a ≥30% decline
post-WNS.
An additional loss of 78,825 bats would be required
to meet this trigger.
Recommended Citation for this Document:
Armstrong, M.P., R.A. King, R.A. Niver, J.S. Utrup, V. Kuczynska, E.D. Thorne, J. De La Cruz, S.M. Deeley, K.M. Gorman, A.
Silvis, R.E. Russell, and W.M. Ford. 2022. Addendum 2 – An Update to the Indiana Bat Summer Survey Level of Effort Trigger
and Inclusion of Minimum Recommended Effort for Northern Long-eard Bats. U.S. Fish and Wildlife Service, Region 3,
Bloomington, MN. 16 pp.
https://www.fws.gov/library/collections/range-wide-indiana-bat-and-northern-long-eared-bat-survey-guidelines
16You can also read