Air Quality And Health Benets of Increasing Carbon Mitigation Tech-Innovation In China
←
→
Page content transcription
If your browser does not render page correctly, please read the page content below
Air Quality And Health Bene ts of Increasing Carbon Mitigation Tech-Innovation In China Shunlin Jin Jiangsu University https://orcid.org/0000-0002-0510-4699 Weidong Wang ( wangwd@ujs.edu.cn ) Jiangsu University Dragana Ostic Jiangsu University Caijing Zhang Nanjing Agricultural University Na Lu Jiangsu University Dong Wang Jiangsu University Wenli Ni Jiangsu University Research Article Keywords: Carbon mitigation tech-innovation, Haze pollution, Health bene ts, Sustainable development, Mediating effect Posted Date: September 13th, 2021 DOI: https://doi.org/10.21203/rs.3.rs-800136/v1 License: This work is licensed under a Creative Commons Attribution 4.0 International License. Read Full License
1 Air quality and health benefits of increasing carbon
2 mitigation tech-innovation in China
3 Shunlin Jin1,Weidong Wang1 ,Dragana Ostic1,Caijing Zhang2, Na Lu1, Dong Wang1,Wenli Ni1
4
5 ABSTRACT:
6 Most studies on the short-term local benefits of carbon mitigation technologies
7 on air quality improvement and health focus on specific technologies such as biofuels
8 or Carbon sequestration technologies, while ignoring the overall role of the growing
9 scale of low-carbon technologies, and the relevant empirical studies are particularly
10 lacking. Based on STIRPAT model and EKC hypothesis, this paper takes 30 provinces
11 of China from 2004 to 2016 as research samples, measures the carbon mitigation
12 tech-innovation(CMTI) with Y02 low carbon patent applications, and constructs a
13 econometric model to empirically analyze the effect of carbon mitigation
14 tech-innovation in response to climate change on the inhibition of haze pollution. It
15 draws on relevant studies to quantify air quality and health benefits of carbon
16 mitigation tech-innovation. Research shows that a 1% increase in the number of
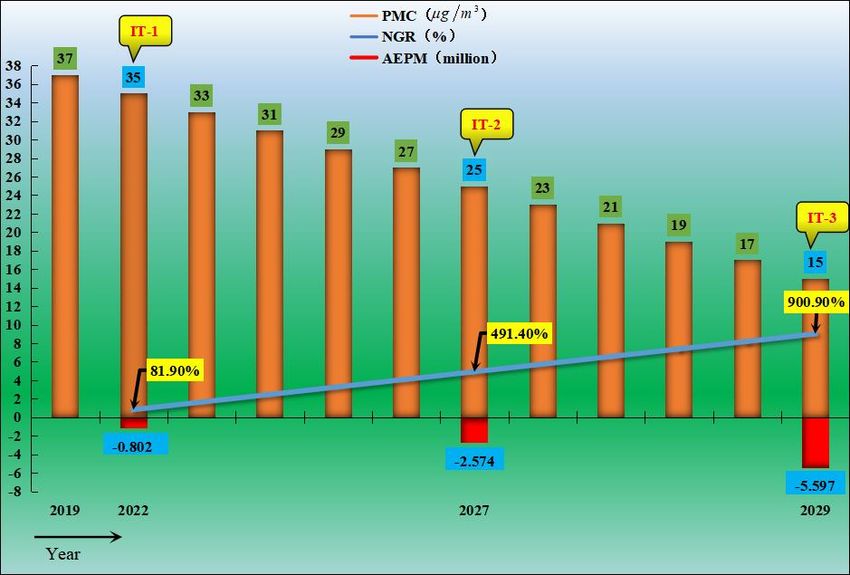
17 low-carbon patent applications can reduce haze pollution by 0.066%. According to
18 this estimate, to 2029,China's carbon mitigation tech-innovation could reduce PM 2.5
19 concentration to 15 g m 3 preventing 5.597million premature deaths. The research
20 further found that carbon mitigation tech-innovation can also indirectly inhibit haze
21 pollution by triggering more systematic economic structure changes such as energy
22 and industrial structure. Additionally, the study found that the role of grey
1 School of Finance and economics, Jiangsu University, Zhenjiang, China. 2School of public administration, Nanjing
Agricultural University, China. email:wangwd@ujs.edu.cn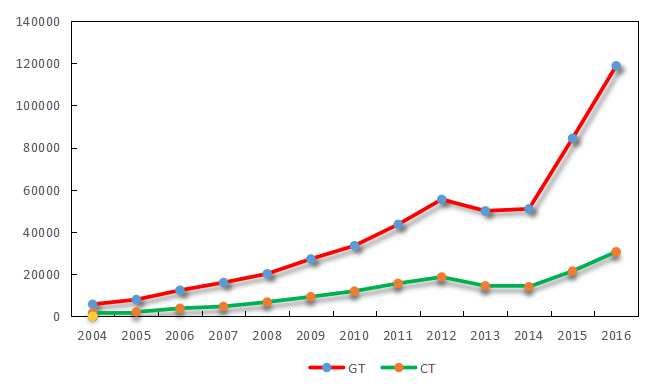
23   tech-innovation(GT) related to improving the efficiency of fossil energy is stronger

24   than that of clean technology(CT) related to the use of renewable energy. This

25   suggests that for a large economy such as China, where coal is still the dominant

26   source of energy consumption, the short-term local benefits of improving air quality

27   and health through the use of grey tech-innovation to improve energy and industrial

28   structure are still important to balance the cost of carbon mitigation.

29   Keywords: Carbon mitigation tech-innovation; Haze pollution; Health benefits;

30   Sustainable development; Mediating effect

31

32   1. Introduction

33        Since the reform and opening up, China's economic development has made

34   remarkable achievements, but the air pollution caused by rapid industrialization and

35   urbanization is one of the biggest environmental challenges facing China at present

36   (Lin et al.,2010; Guan et al.,2012; Lyu et al.,2016; Zeng et al.,2019; Zhao et al., 2021).

37   In fact, as early as 2013, the Chinese government began to implement the Air

38   Pollution Prevention and Control Action Plan. And In June 2018, the State Council

39   issued the Three-Year Action Plan to Win the Blue Sky Defense War. Although the

40   Chinese government has taken a number of measures to curb the country's worsening

41   air pollution, it doesn't seem to be having the desired effect. In 2019, 180 of the

42   country's 337 cities at or above the prefecture level exceeded the standard, accounting

43   for 53.4 percent. 337 cities had 1,666 days of heavy pollution. If the impact of sand

44   and dust is not deducted, the proportion of cities exceeding the standard will reach
45 57.3% (Ministry of Ecology and Environment,2020). Severe air pollution leads to 46 widespread smog problems in many Chinese cities (Feng and Robert,2012; Apet et 47 al.,2015; Yin et al.,2019; Yin and Wang,2017; Yin and Zhang,2020), and one of the 48 main causes of haze problem is the increase in the concentration of particulate matter 49 ( PM 2.5 ) in the atmosphere (Hsu et al.,2017; Liao et al., 2017). Relevant data show 50 that among the major air pollutants, the fine particulate matter (2.5μm or smaller in 51 diameter, PM 2,5 ) has the greatest effect (Yu et al.,2016; Xie et al.,2019). In 2019, the 52 number of days with PM 2.5 as the primary pollutant in China accounted for 78.8 53 percent of the days with severe pollution or above, the average concentration was 37 54 g m 3 . (Ministry of Ecology and Environment,2020). Continuous PM 2.5 pollution 55 not only leads to the large-scale spread of haze in China, but also causes a sharp 56 decline in air quality and dual loss of health benefits and economic benefits (Guan et 57 al.,2016; Abajobir et al.,2016; Li et al.,2018; Liu et al.,2018; Zhao et al.,2018; Guan et 58 al.,2019; Zhang et al., 2019). It is estimated that by 2060, the country with the greatest 59 economic losses due to air pollution will probably be China (Lanzi et al.,2018). 60 Related to smog pollution, climate change is one of the biggest threats facing all 61 living things in the 21st century. Over the years, a large number of emissions of 62 greenhouse gases (mainly CO2 ) lead to global warming, climate change is very 63 outstanding, and long-term climate change will not only bring serious threat to human 64 existence, may also lead to the collapse of the earth's ecological system, even human 65 health problems brought by the response to climate change, Governments need to 66 invest a large amount of capital cost every year (Landrigan et al.,2018; Tong et
67   al.,2019; Coelho et al.,2020; Liu et al.,2020a; Wright et al.,2021). In response to this

68   threat, China signed a commitment at the Paris Agreement in 2015 to reduce energy

69   intensity by 60-65% from 2005 levels by 2030, and to peak carbon emissions around

70   2030 or even earlier. In 2020, China has further announced new nationally determined

71   contribution targets such as carbon peak and carbon neutrality, which are included in

72   the 14th Five-Year Plan (2021-2025). It can be seen that carbon emission reduction

73   has been the task of China for a long time now.

74        Effective carbon emission reduction is the only way to deal with global climate

75   change, and it has an important synergistic effect on air quality and human health (Xie

76   et al.,2018; Cao et al.,2019; Scovronick et al.,2019; Sharifi et al.,2020), and the value

77   generated by this effect is higher in developing countries (Nemet et al.,2010a). A

78   major obstacle to carbon reduction is the difficulty of reconciling the global,

79   long-term benefits of climate change with the short-term, local costs. However,

80   relevant studies suggest that most air pollutants (mainly PM 2.5 ) share a common

81   source with greenhouse gases (mainly CO2 ) (West et al.,2004; West et al.,2013a),

82   carbon emission reduction actions will reduce other emissions of air pollution, such as

83   CO2 , SO2 and NOx , which can bring short-term and partial health benefits and relieve

84   the short-term cost pressure of emission reduction actions (Zhang et al.,2017; Cai et

85   al.,2018a; Wang et al., 2020 a; Liu et al., 2020b). However, most of these studies have

86   focused on assessing the air quality and health benefits of carbon reduction policies

87   such as carbon trading, carbon pricing, and carbon taxes (Thompson T M et al.,2014a;

88   Shindell D et al.,2018; Scovronick et al.,2019; Chang et al., 2020a; Yang et al.,2021a),
89   or focus on assessing the benefits of individual technologies such as biofuels and

 90   carbon sequestration (CCS) to address climate change (Ou et al.,2018a; Wang et

 91   al.,2020b), but less consideration is given to the overall short-term air quality and

 92   health benefits of the increasingly large scale carbon mitigation tech-innovation, and

 93   the relevant empirical and impact mechanism studies are particularly lacking. Based

 94   on this, this paper takes China as the background to analyze three issues: How will the

 95   increasingly active technological innovation of carbon emission reduction triggered

 96   by long-term global climate change affect the short-term and local benefits of air

 97   quality? What is the role of important relevant factors such as energy structure and

 98   industrial structure in the influencing process? Is there heterogeneity in the impact of

 99   different types of low-carbon technology innovation activities, such as clean

100   technology and grey technology innovation?

101        The innovation and improvement of the research include:

102        (1) Extend the research on air quality benefits of current climate change

103   technologies from scenario simulation of individual negative emission technologies to

104   empirical research of low-carbon technologies as a whole. For the first time, the

105   empirical method based on historical data and the STIRPAT model and the classical

106   EKC hypothesis will be integrated to build an econometric model to study the

107   common benefits of carbon emission reduction measures. Different from the previous

108   simulation methods, which are mainly based on scenario setting, to analyze the air

109   quality benefits of specific negative emission technologies (Ou et al.,2018b; Wang et

110   al., 2020 b).
111        (2) The hypothesis of "externality" of carbon mitigation tech-innovation will be

112   further studied. Current studies generally assume that carbon emission reduction

113   technological innovation is constrained by "double externalities", that is, it is difficult

114   to recover both economic and environmental benefits of innovation, resulting in

115   insufficient incentives (Horbach et al.,2012; Cunico et al., 2017). However, the

116   benefits of air quality and health are often neglected in the calculation of the benefits

117   of carbon mitigation tech-innovation, so the benefits of carbon mitigation

118   tech-innovation are underestimated. The calculation of such benefits has a direct

119   impact on the decision-making of climate change action. If the benefits are large, it is

120   more worthwhile to use environmental policy and technological means to deal with

121   climate change action.

122        (3) Industrial structure and energy structure are included in the study to more

123   accurately and completely reveal the impact mechanism of carbon mitigation

124   tech-innovation on reducing haze pollution.

125        (4) The carbon mitigation tech-innovation is divided into clean technology and

126   grey technology, and the possible heterogeneity of different types of low-carbon

127   technologies on the prevention and control effects of haze pollution is studied.

128   2. Literature review and theoretical hypotheses

129   2.1.Carbon mitigation tech-innovation and Haze Pollution

130        Due to the obvious homology between greenhouse gases and haze, it has created

131   great potential for common control (Dong et al.,2015a). Research on co-control or
132   co-benefit focuses on the simultaneous reduction of local emissions of air pollutants

133   through measures to reduce greenhouse gas emissions, or measures to reduce local air

134   pollutants at the same time. (Rypdal K et al.,2007; Tollefsen P et al.,2009; Yeora C et

135   al.,2010; Mao et al., 2012; Kanada et al.,2013) As for the former, situational

136   simulation is often used in studies. For example, Nemet et al.(2010b) found that the

137   health benefits of GHG emission reduction are equivalent to the costs of GHG

138   emission reduction. West et al.(2013b) estimate that economic and energy system

139   transformation under climate mitigation scenarios will reduce air pollutant emissions

140   and prevent 1.3 million premature deaths worldwide in 2050 due to PM 2.5 and ozone

141   exposure. Shindell et al.(2016) found that according to the global target of controlling

142   temperature rise within 2°C by 2050, the short-term benefits of carbon dioxide

143   reduction in the United States may exceed the policy costs. Recently, research on

144   specific emission reduction policies has been strengthened. For example, studies show

145   that carbon dioxide emission standards for the power generation industry in the

146   United States will affect the fuels and technologies used for power generation, as well

147   as environmental air quality and public health (Driscoll C et al.,2015). Thompson et

148   al.(2014b) studied the role of carbon cap-and-trade system and clean energy standards

149   in the United States in 2030 and found that the improved health benefits brought by

150   improved air quality could offset 26%-1050% of the cost of carbon reduction policies.

151   Garcia-Menendez et al.(2015) found that a global carbon tax could significantly

152   reduce emissions of air pollutants, and that the benefits of such a policy would

153   increase over time. Trail et al.(2015) found that a relatively aggressive carbon tax may
154   lead to a significant improvement in PM 2.5 air quality in the United States. The results

155   of Ou et al.(2016) suggest that greenhouse gas emission reduction measures may also

156   have adverse effects.

157        In recent years, the coordinated governance of climate change and haze has

158   attracted great attention of the Chinese government. This kind of research with China

159   as its object has emerged in recent years (Yang et al.,2018). First, research based on

160   region, industry and technology. The study points out that the shared health benefits of

161   reducing greenhouse gas emissions are most pronounced in East Asia, with two-thirds

162   of the global shared benefits expected to occur in China by 2030 (Cai et al.,2018b).

163   Yang et al.(2013a) found that deployment of distributed photovoltaic systems in

164   eastern rather than western China and interprovincial transmission would maximize

165   the health benefits associated with carbon dioxide emission reduction and air quality

166   by 2030. Dong et al.(2015b) found that provinces with high energy consumption or

167   relatively intensive coal or industry in China gained greater common benefits. Yang et

168   al.(2013b) calculated the synergistic benefits of energy-saving technologies in China's

169   cement industry. Cai et al.(2018c) estimated that by 2030, 18%-62% of the

170   implementation cost of renewable power generation in the power generation industry

171   could be covered by health benefits, which would significantly increase to 3-9 times

172   the cost by 2050. Second, research based on climate policy. He et al.(2010) quantified

173   the impact of China's energy policy on air pollution, focusing on the formation of fine

174   particulate matter PM 2.5 . Nielsen and Ho(2013) show that a nationwide carbon

175   dioxide tax during the Eleventh Five-Year Plan period is expected to improve air
176   quality at a low cost. Chang et al.(2020b) found that under a national carbon emission

177   trading system, air quality and health benefits would be significantly improved. In

178   China's committed 2030 carbon peak policy scenario, the health benefits of improved

179   air quality will partially or fully offset the policy costs (Li et al.,2018). Yang et

180   al.(2021b) assess the benefits of carbon and pollution control policies for air quality

181   and human health through a comprehensive framework that combines an energy

182   economic model, an air quality model and a concentration-response model.

183        Increasingly serious haze pollution is the most significant external manifestation

184   of air quality deterioration. How to effectively improve haze pollution is the key to

185   achieve common benefits of air quality. According to the above review, a large

186   number of literatures still focus on the policy aspect, and only some literatures

187   mention technological innovation, which is limited to specific negative emission

188   technologies (Ou et al.,2018c). There is very little research on the effect of carbon

189   emission reduction technologies on haze control from the overall perspective of

190   technology. The use of environmental policies often means high economic and social

191   costs, which are short-term and difficult to fundamentally address, such as closing

192   down high-polluting enterprises. Compared with policies, the economic and social

193   costs of technological innovation should be relatively low and sustainable in the long

194   term, which is conducive to the fundamental control of haze pollution. In recent years,

195   the number of low-carbon patent applications in the world and China has increased

196   rapidly. As can be seen from Fig.1, from 2004 to 2016, the total number of

197   low-carbon patent applications (including clean and gray) in China jumped from
198   7,000 to about 150,000, making China the major low-carbon patent application

199   country in the world. Among them, the number of clean and gray patent applications

200   also experienced rapid growth, which should be conducive to haze control. The effect

201   of inhibiting haze. Thus, the following hypothesis is proposed:

202        H1. carbon mitigation tech-innovation to curb haze pollution.

203
204            Fig. 1.   Number of clean and gray patent applications in China from 2004 to 2016

205   2.2.carbon mitigation tech-innovation, energy structure and Haze Pollution

206        Technological innovation and energy structure optimization are both important

207   means to achieve sustainable development goals. Energy structure generally refers to

208   the composition and proportion of all kinds of energy in the total amount of energy.

209   For example, the advantages and disadvantages of energy structure are judged by the

210   proportion of coal, oil and other fossil energy consumption. The optimization of

211   energy structure may come from both policy pressure and technological change. Lin

212   and Chen.(2019) found that wind power technology innovation is the key to achieve

213   energy structure transformation and sustainable economic development. For the metal

214   industry, technological progress can also improve energy efficiency by changing
215   factor shares (Lin and Chen.2020). Wurlod et al.(2018) point out that green

216   technology innovation can help reduce energy intensity and achieve the core

217   objectives of climate policy. Studies by other scholars have found that energy

218   efficiency cannot be effectively improved only by adjusting industrial structure. Only

219   by relying on more advanced technologies can the problems of high emissions and

220   high energy consumption in industrial production be effectively solved, so as to

221   improve energy efficiency and bring about predictable adjustment of energy structure

222   (Shao et al., 2019; Wang and Wang, 2020). In fact, technological innovation is indeed

223   the key to the transformation of the energy structure. A large number of technological

224   innovation is conducive to those industries that rely on traditional energy (such as

225   steel, electricity, construction industry, etc.) to gradually transition to clean energy,

226   such as the use of renewable energy such as wind and solar energy. At the same time,

227   some gray technology innovations will significantly improve the energy utilization

228   efficiency of enterprises and reduce energy intensity, which plays an important role in

229   promoting the improvement of energy structure. Therefore, carbon mitigation

230   tech-innovation should promote the transformation of energy structure while reducing

231   haze. Thus, the following hypothesis is proposed:

232        H2a. Carbon mitigation tech-innovation will promote the optimization of energy

233   structure.

234        Studies show that excessive fossil energy consumption and high fossil energy

235   intensity are both important causes of haze pollution (Li et al.,2017; Jing et al.,2018),

236   the improvement of both plays an important role in the improvement of air quality
237   (Dong et al.,2019). In recent years, China's rapid industrialization and urbanization

238   have led to a large amount of fossil energy consumption, which makes it difficult to

239   improve the imbalance of energy structure and inevitably brings a large amount of

240   polluting gas emissions, leading to frequent and large-scale occurrence of haze

241   pollution (Liu et al.,2016a; Yao et al., 2018; Zhou et al., 2018). Accordingly, the

242   following hypotheses are proposed:

243        H2b. Optimization of energy structure will curb haze pollution.

244        According to H2a and H2b, it can be inferred that carbon emission reduction

245   technological innovation may also indirectly affect haze pollution through energy

246   structure. Thus, the following hypothesis is proposed:

247        H2c. Energy structure plays an intermediary role in the impact of carbon

248   emission reduction technological innovation on haze pollution.

249   2.3 Carbon mitigation tech-innovation and Industrial structure and Haze

250   Pollution

251        Technological innovation is also the key to the upgrading of industrial structure.

252   As early as 1989, Arthur.(1989) had found that technological innovation was

253   conducive to the upgrading of industrial structure. With the increasing appeal of

254   environmental protection products and cleaner production, enterprises adopt

255   low-carbon technology innovation or low-carbon technology to adapt to social

256   development and meet social needs, so as to obtain comparative competitive

257   advantages and improve enterprise competitiveness and performance (Li et al.,2019;

258   Li et al., 2021). Researchers clearly point out that widespread technological
259   innovation in the industry can not only improve the environment, but also optimize

260   the efficiency of capital allocation (Zhao et al.,2021). Funds in the market will flow to

261   industries with development potential, such as new energy vehicles, photovoltaic

262   power generation and other environmental protection industries. In the long run, the

263   number of high-pollution enterprises in the secondary industry will be reduced, the

264   overall improvement of the industrial system will be brought about, and the

265   transformation of the overall structure will be promoted (Zhao and Wang.2020).

266   However, part of the current research on industrial structure upgrading focuses on the

267   effect of government policies on industrial structure upgrading (Zheng et al.,2021a;

268   Du et al.,2021). However, such policies often ignore the possibility of industrial

269   migration. In fact, due to the "race to the bottom" and the "Pollution Haven

270   Hypothesis" among local governments, the migration of high-carbon industries in

271   China has become common. This leads to the failure of local industrial policies and

272   environmental regulations to some extent (Shen et al.,2019). In contrast, the use of

273   technological innovation to promote industrial upgrading may have more obvious

274   advantages. Thus, the following hypothesis is proposed:

275        H3a. Technological innovation of carbon emission reduction will promote the

276   upgrading of industrial structure.

277        Some scholars have proposed that the upgrading of industrial structure is the

278   most critical factor for solving environmental problems (Oosterhaven and

279   Broersma.2007). Li et al.(2017) believe that industrial structure upgrading can help

280   improve the efficiency of resource utilization and thus improve environmental
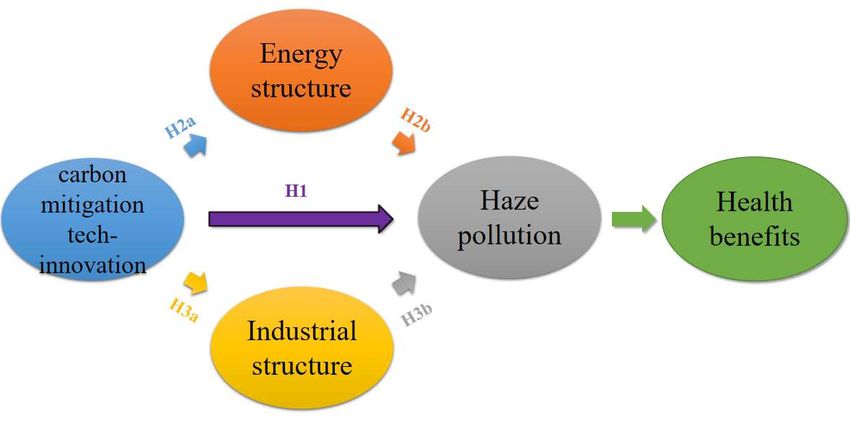
281   problems, and can also effectively alleviate the contradiction between economic

282   development and energy conservation and emission reduction. Chen et al.(2019) also

283   believe that in the long term, the upgrading of industrial structure is conducive to the

284   improvement of air pollution. In recent years, with the acceleration of urbanization

285   and industrialization in China, the high-carbon industry is still the pillar industry in

286   China (Zheng et al.,2021b). And, in the industrial structure of China, the "three high"

287   and "three wastes" (waste water, waste gas, And waste residue), and these problems

288   directly lead to the decline of haze pollution and air quality(Zhu et al.,2019).

289   Accordingly, the following hypothesis is proposed:

290        H3b. The upgrading of industrial structure will curb haze pollution.

291        According to H3a and H3b, carbon mitigation tech-innovation may inhibit haze

292   pollution by promoting industrial structure upgrading. Accordingly, the following

293   hypothesis is proposed:

294        H3c. Industrial structure plays an intermediary role in the impact of carbon

295   mitigation tech-innovation on haze pollution.

296        In summary, the methodological framework of the above five theoretical

297   hypotheses in this thesis is illustrated in Fig.2.
298
299                 Fig. 2. The methodological framework of theoretical hypotheses.

300   3. Data descriptive and model specification
301   3.1.Variables and data description

302   3.1.1. Haze Pollution

303        Haze pollution is often measured in terms of fine particles PM 2.5 (Zhang et

304   al.,2018). Data were collected using raster data from Dalhousie University

305   Atmospheric Composition Analysis Group based on annual mean global PM 2.5

306   concentrations monitored by satellites , data from the group's official website

307   (http://fizz.phys.dal.ca/~atmos/martin/? Page_id =140), and use ArcGIS software to

308   analyze it into the annual average PM 2.5 concentration value of China's provinces from

309   2004 to 2016. The reasons are as follows: First, China has not released long-term and

310   reliable PM 2.5 concentration data, which was only started in 2013 at the earliest, and

311   PM 2.5 detection in China is still mainly based on fixed site monitoring, with a very

312   limited number (Lin et al.,2018). Second, although the actual monitoring data

313   collected by the ground observation stations can more truly reflect the haze pollution

314   situation of the stations by taking advantage of their own advantages, the
315   concentration distribution of PM 2.5 is not limited to a single station, and there are

316   significant spatial differences in the same region. Therefore, if the station data of the

317   ground monitoring stations are used for analysis, It will only provide a rough measure

318   of the haze pollution situation in the region, which will bring a large error to the actual

319   estimation results. In contrast, satellite-based data on the concentration of haze

320   pollution ( PM 2.5 ) can give a more accurate picture of an area's PM 2.5 concentration.

321   Similarly, due to the above reasons, this data has been widely used in most existing

322   studies (Han et al.,2017; Yang et al.,2020; Feng et al., 2021).

323   3.1.2. carbon mitigation tech-innovation

324        Carbon mitigation tech-innovation (CMTI) is measured by the number of

325   domestic Chinese patent applications in the Y02 category of the CPC(Cooperative

326   Patent Classification) jointly issued by the European Patent Office (EPO) and the

327   United States Patent Office (USPTO) in 2013. CPC combines the strengths of the

328   United States Patent Classification System (USPC), the European Patent

329   Classification System (ECLA) and the International Patent Classification System (IPC)

330   while providing technical, functional and product application information. In order to

331   subdivide carbon emission reduction technologies into clean technologies and grey

332   technologies, each subcategory is identified based on the Y02 category in the

333   cooperative patent classification and according to the concepts of clean and grey

334   low-carbon technologies in the existing literature (Wang et al.,2020a). In this study,

335   the whole Y02 category represents low-carbon technologies. The patents with CPC

336   code in Schedule 1 belong to clean technologies, while the rest of the Y02 patents
337   belong to gray technologies.

338   3.1.3. Energy structure and industrial structure

339        Energy structure (ES). China's energy structure dominated by coal consumption

340   is an important cause of air pollution and greenhouse gas emissions (Liu et al.,2016b).

341   Since 1978, China's coal consumption has gradually exceeded that of all countries in

342   the world and continues to grow (Hao et al.,2016). This phenomenon is closely related

343   to the increasingly serious air pollution in China. Therefore, the proportion of coal

344   consumption in the total energy consumption is used to measure the energy

345   consumption structure, and it is used as an intermediary variable to explore the

346   intermediary effect between carbon mitigation tech-innovation and haze pollution.

347        Industrial structure (IS). Enterprises with high carbon emissions are always in

348   urgent need of rectification and elimination on the road of industrial structure

349   optimization in China. The depth of industrialization has led to serious problems in

350   China's current industrial structure, among which the excessively large proportion of

351   the secondary industry is a very prominent problem (Lin and Zhu,2019a). These

352   problems will indirectly damage China's environment and ecology. It has a serious

353   impact on air pollution in China. Therefore, this paper uses the proportion of the

354   added value of the secondary industry to measure the industrial structure (IS), and

355   also takes it as an intermediary variable to explore its mediating effect between carbon

356   mitigation tech-innovation and haze pollution.

357   3.1.4. Control variables
358        On the basis of existing studies, this paper selects four variables as control

359   variables: population density (POP), economic growth (PGDP), openness to the

360   outside world (FDI) and environmental regulation (MR).

361        (1) Population density (POP). In this paper, the ratio of population size to

362   administrative area is used as a proxy index of population size. Based on relevant

363   studies (Shao et al.,2011; Fan and Xu.,2020) found that the scale effect brought by

364   large population agglomeration usually leads to environmental deterioration and

365   further aggravates haze pollution, so the coefficient of this variable is expected to be

366   positive.

367        (2) Economic development level (PGDP). This paper uses the per capita GDP to

368   measure the level of regional economic development. According to existing studies,

369   there are mainly two views on the relationship between economic development level

370   and environmental quality: On the one hand, the level of regional economic

371   development shows Kuznets effect in the process of affecting environmental pollution,

372   that is, the environmental quality will deteriorate first and then gradually improve

373   with the improvement of economic development level, showing an inverted "U"

374   -shaped nonlinear relationship (Xu et al.,2016; Wang and Fang.2016; Gan et al.,2020);

375   On the other hand, economic scale effect is the dominant factor of climate change and

376   haze pollution, so they show a linear relationship (Kearsley and Riddel.2010), which

377   does not conform to Kuznets effect. Referred to relevant literature (Lin and

378   Zhu,2019b), the primary and secondary items of economic growth were included in

379   the research on the relationship between the level of economic development and haze
380   pollution, and the two main viewpoints on the relationship between the level of

381   economic development and haze pollution were tested respectively.

382        (3) Openness (FDI). In this paper, the ratio of the actual utilized foreign direct

383   investment to the regional GDP in each administrative division is used to measure,

384   and it is converted into RMB by the exchange rate between US dollar and RMB in

385   that year. Openness plays an important role in China's environmental research and is

386   an important factor that cannot be ignored. However, the relevant research

387   conclusions are not unified, mainly manifested in two hypotheses: the "pollution

388   heaven" hypothesis that FDI will worsen environmental quality. In order to accelerate

389   regional economic development, each region will lower its environmental protection

390   standards to attract more foreign investment, and accelerate the development and

391   utilization of natural resources to produce more highly polluting products. Therefore,

392   such regions are more engaged in the production of products with high energy

393   consumption and high emission. It also exports resource-consuming and

394   environment-polluting products (Asumadu-Sarkodie at al.,2020). Continued decline in

395   environmental standards will exacerbate the problem of environmental degradation by

396   intensifying regional competition to the bottom. The pollution halo hypothesis holds

397   that FDI can improve regional environmental problems in three main aspects. First of

398   all, the utilization of FDI will further alleviate the environmental pollution in the

399   region while improving the income level of local residents. The "polluted paradise"

400   will not last long (Opoku et al.,2021). Secondly, as foreign-funded enterprises are able

401   to implement stricter environmental protection standards, a large amount of foreign
402 investment can reduce pollution emissions in the places where the capital is used (Luo
403 et al.,2021). Last but not least, the new technologies brought by foreign investment
404 are also conducive to further improving the local environmental quality. The
405 introduction of environmentally friendly technologies and products by the inflow of
406 foreign capital can improve the environmental welfare of the destination (Khan et
407 al.,2021).
408 (4) Environmental Regulation (MR). This paper controls the impact of
409 command-and-control regulation (CR) and market-based regulation (MR), two major
410 types of environmental regulation in China. Command-and-control regulation (CR) is
411 measured by pollutant emission intensity, and market-based regulation (MR) is
412 measured by pollutant emission charge. In recent years, the Chinese government has
413 recognized the huge environmental pressure China is facing, and has taken different
414 measures to strictly regulate enterprises. These environmental regulations have been
415 proved by a large number of studies to play an important role in alleviating haze
416 pollution (Zhang et al.,2020; Zhang et al.,2020; Zhou et al.,2021). According to Ren
417 et al.(2018a) and Wang et al.(2020),command-and-control regulation (CR) can be
418 measured by the following formula.
419 First, the four pollutants, solid waste, sulfur dioxide ( SO2 ), wastewater and flue
420 gas, are treated according to Eq.(1)
UEij min U j
UEijs (1)
max U j min U j
421
422 Where, max U j and min U j are respectively the maximum and minimum
423 values of j pollutants in each province each year. UEij presents j pollutant424 discharge per unit output value in province i , and UEijs is the intensity of discharge
425 treated by linear standardization. The adjustment coefficient of the four pollutants,
426 such as Eq. (2), reflects the differences of the four pollutants in different provinces.
UEij
427 Wj (2)
UEij
428 Where, UEij represents the average unit output value of j pollutant discharge
429 in all provinces, and W j is the weight of j pollutant discharge in each provinces.
430 The synthesis method, which creates a comprehensive index of various pollutant
431 discharges, is shown in Eq. (3), and ERi represents the intensity of environmental
432 regulation.
1 4
433 ERi W jUEijs
4 j 1
(3)
434 At present, the market-based regulation (MR) is mainly measured by sewage
435 charges in China(Zhao and Sun.2015;Ren et al.,2018b). So we also adopt this
436 method, and sewage charges are taken 2000 as the base year for the correction.
437 3.1.5. Date source
438 In this paper, the data of 30 provinces from 2004 to 2016 were selected for the
439 research (due to the lack of data of Xizang, Hong Kong, Macao and Taiwan, the data
440 were not taken into account). Among them, the (Y02) patent data used by provinces
441 and cities to measure innovation in low-carbon technology was obtained from Incopat
442 database (https://www.incopat.com/). The population data of each region, per capita
443 GDP, actual utilized foreign capital data and secondary industry added value data are
444 from China Statistics Yearbook. Energy consumption data are from China Energy445 Statistics Yearbook. In order to eliminate the influence of heteroscedasticity, natural
446 logarithms of some variables are taken in this paper. Descriptive statistics of variables
447 are shown in Table 1.
448 Table 1
variables meaning Obs. Mean SD Min Max
lnPM Haze pollution 390 3.398 0.547 1.938 4.406
Carbon mitigation
lnCMTI 390 6.499 1.529 1.792 9.911
tech-innovation
lnGT Clean technology 390 6.218 1.550 1.609 9.643
lnCT Grey technology 390 5.044 1.515 0 8.462
ES Energy structure 390 0.649 0.165 0.121 0.938
IS Industrial structure 390 0.949 0.506 0.494 4.165
lnPGDP GDP per capita 390 10.26 0.669 8.370 11.68
lnPOP Population density 390 5.429 1.268 2.046 8.249
Ratio of foreign direct
FDI 390 2.605 2.287 0.0386 14.61
investment
Command-and-control
lnCR 390 5.467 1.786 -6.908 7.935
regulation
Market-based
lnMR 390 9.670 0.984 6.520 11.85
regulation
449 The descriptive statistics of explained variable and explanatory variables.
450
451 3.2. Econometric model specification
452 Considering that the basic research framework of environmental pollution
453 influencing factors mainly centers on STIRPAT model and EKC hypothesis, this paper
454 discusses the effect of carbon mitigation tech-innovation on reducing haze pollution
455 by combining them, and analyzes the mediation effect of industrial structure and
456 energy structure under the direct effect in detail.
457 The prototype of STIRPAT model is the IPAT model proposed by Ehrlich and458 Holdren (1971), and the traditional IPAT model is defined as Eq. (4). However, later 459 studies found the limitations of the IPAT model (Tursun et al.,2015). Therefore, Dietz 460 and Rosa (1994) further developed this model on this basis. A Modified Stirpat Model 461 as Eq. (5) 462 I PAT (4) 463 I it aPitb AitcTitd e (5) 464 Where, I it , Pit , Ait , Tit represent the environmental impact, population size, per 465 capita wealth and technological level of province i in year t , respectively. Parameter a 466 denotes the constant term. b , c , d respectively represent the population size, per 467 capita wealth and technical level, e represents the error term. Take natural logarithms 468 from both sides of the model and turn the model into a linear form to obtain Eq. (6). 469 LnI it bLnPit cLnAit dLnTit eit (6) 470 One of the major advantages of STIRPAT model is that it can not only estimate 471 the parameters of the model, but also change the environmental factors appropriately. 472 Therefore, Eq. (7) can be preliminarily rewritten as follows: 473 LnPMi ,t LnCMTIi ,t LnPOPi ,t LnPGDPi ,t i ,t (7) 474 Where i represents the province, t represents the year, PM represents haze 475 pollution ( PM 2.5 concentration), CMTI represents carbon mitigation tech-innovation 476 (measured by Y02 category patents), POP represents population size (measured by 477 provincial population density), and PGDP represents per capita wealth (measured by 478 provincial per capita PGDP ). , , are the coefficients of CMTI , POP and PGDP 479 respectively, is the constant term. i,t represents the error term.
480 The EKC hypothesis is first proposed by Grossman and Krueger (1991) on the
481 basis of Kuznets (1955), aiming to reveal the inverted U-shaped relationship between
482 economic development and environment. At present, most scholars incorporate the
483 EKC hypothesis when studying environmental problems(Lin and Zhu.2019c;Zhao et
484 al.,2020). Therefore, we follow the classical EKC hypothesis and make appropriate
485 changes of STIRPAT model to study the impact of carbon mitigation tech-innovation
486 on haze pollution, as shown in Eq. (8) :
LnPMi ,t LnCMTIi ,t LnPOPi ,t LnPGDPi ,t 1 LnPGDPi ,t
2
487 (8)
2 FDIi ,t 3 LnMRi ,t 4 LnCRi ,t i i i ,t
488 Where, i represents the province, t represents the year, 1 , , , i are the
489 coefficients of each variable, i and i represent individual effect and time effect
490 respectively, is the constant term.
491 In order to test the mediating role of the industrial structure and energy structure
492 proposed above in the impact of technological innovation coping with carbon
493 emission reduction on haze pollution, the following static panel model is preliminarily
494 set.
495 LnPMi ,t 0 1LnCMTIi ,t 2 X i ,t i i i.t (9)
496 LnPMi ,t 0 1ESi ,t 2 X i.t i i i ,t (10)
497 ESi ,t 0 1LnCMTIi ,t 2 X i ,t i i i ,t (11)
498 LnPMi ,t 0 1LnCMTIi ,t 2 ESi ,t 3 X i ,t i i i ,t (12)
499 LnPMi ,t 0 1ISi ,t 2 X i ,t i i i ,t (13)
500 ISi ,t 0 1LnCMTIi ,t 2 X i ,t i i i ,t (14)
501 LnPMi ,t 0 1LnCMTIi ,t 2 ISi ,t 3 X i ,t i i i ,t (15)502 In regression equations (9)~(15), X i ,t represents the control variable, including 503 LnPGDP, LnPGDP2 , LnPOP, FDI , LnMR and LnCR . , , , , , and are the 504 coefficients of each variable. If , and are significant, it indicates that H1, H2 505 and H3 are true. 506 In this paper, the mediation effect test will first use the Causal steps approach 507 (Baron and Kenny.1986). The inspection process is divided into three steps. The first 508 and second steps are to test H1, H2a and H3a, which 1 should be significant. The 509 third step is to test whether 1 , 2 and 1 , 2 are significant. If significant, H2c and H3c 510 are true; if at least one of them is not significant, Sobel test is required (Sobel.1988). 511 512 4. Estimation results 513 In this paper, classical econometric models are used for regression analysis. First, 514 Hausmann test is used to select fixed effect models and random effect models. The 515 test results are shown in Table 2. 516 4.1. Impact of carbon mitigation tech-innovation on haze pollution 517 According to the estimated results of Model 1 in Table 2, at the significance 518 level of 1%, the impact coefficient of carbon emission reduction technological 519 innovation on haze pollution is -0.066, that is, each 1% increase in carbon emission 520 reduction technological innovation can reduce haze pollution by 0.066%. This test 521 result supports H1. It shows that the technological innovation of carbon emission 522 reduction in China in recent years can effectively curb haze pollution while coping
523   with climate change, bringing about common benefits of air quality and improvement

524   of residents' health. In addition, it can be seen from the estimated results of Tabel 4

525   and Table 5 that every 1% increase in gray technology innovation can bring about a

526   0.066% reduction in haze pollution. Every 1% increase in clean technology

527   innovation can reduce smog pollution by 0.029%. It shows that both grey technology

528   innovation and clean technology innovation can effectively restrain haze pollution,

529   but grey technology innovation plays a greater role than clean technology innovation.

530   Table 2

531   Results of mediating effects

            Variables        lnPM         ES          lnPM           IS          lnPM
                            Model 1    Model 2      Model 3       Model 4       Model 5
            lnCMTI         -0.066***   -0.026***   -0.058***     -0.124***     -0.059***
                             (-3.17)     (-2.74)     (-2.76)       (-4.23)       (-2.77)
                ES                                  0.324***
                                                      (2.75)
                 IS                                                               0.057
                                                                                  (1.48)
            lnPGDP         1.464***      0.244*     1.543***       0.010        1.463***
                             (4.62)       (1.69)      (4.89)       (0.02)         (4.62)
            lnPGDP2        -0.063***    -0.014*    -0.068***      -0.032       -0.065***
                             (-3.96)     (-1.87)      (-4.25)     (-1.41)        (-4.07)
             lnPOP         0.643***    0.224***     0.571***     1.037***       0.702***
                             (3.76)       (2.87)      (3.33)       (4.30)         (4.00)
                FDI         0.011**       0.002      0.010**       0.002         0.011**
                             (2.24)       (0.87)      (2.13)       (0.32)         (2.27)
                lnMR        -0.026*    -0.030***     -0.017      -0.042**       -0.029*
                             (-1.80)     (-4.51)     (-1.11)      (-2.04)        (-1.95)
                lnCR         -0.001      -0.003      -0.000      0.048***        -0.004
                             (-0.21)     (-1.20)     (-0.03)       (6.31)        (-0.67)
            Constant       14.923***      0.635    14.718***      -1.114       14.987***
                             (6.44)       (0.60)     (6.41)       (-0.34)        (6.48)
           Hausman         P=0.0000    P=0.0002    P=0.0000      P=0.0000      P=0.0000
          Observations         390         390         390          390            390
           R-squared          0.431       0.395       0.443        0.713          0.434
             r2_a             0.350       0.309       0.363        0.672          0.353
F 13.57 11.70 13.52 44.49 13.05 532 Notes: t-statistics in parentheses.all results are calculated by Stata 16.0. 533 ⁎p < 0 . 1 . 534 ⁎⁎p < 0.05. 535 ⁎⁎⁎p < 0.01. 536 4.2. Impact of carbon mitigation tech-innovation on energy structure and 537 industrial structure 538 According to the estimated results of Model 2 and Model 4 in Table 2, it is found 539 that every 1% increase in carbon mitigation tech-innovation can significantly reduce 540 the proportion of coal's energy consumption by 0.026%, and the industrial proportion 541 of secondary industry's added value by 0.124%. In order to improve China's energy 542 structure and industrial structure. This test result supports H2a and H3a. It shows that 543 China's carbon mitigation tech-innovation not only improves air quality directly, but 544 also promotes a more systematic structural green transformation, including energy and 545 industrial structure. From the estimation results of Tabel 4 and Table 5, it can be found 546 that both clean technology innovation and grey technology innovation can effectively 547 promote the green transformation of China's energy structure and industrial structure, 548 and grey technology innovation plays a greater role. 549 4.3. Impact of industrial structure and energy structure on haze pollution 550 According to the regression results of Model 1 in Table 3, at the significance 551 level of 1%, the impact coefficient of energy structure on haze pollution is 0.372, 552 which indicates that the energy structure is highly correlated with haze pollution, and 553 the larger the proportion of fossil energy consumption is, the more serious the haze 554 pollution will be, which supports H2B. Meanwhile, according to the results of Model
555   2 in Table 3, we find that at the significance level of 5%, the influence coefficient of

556   industrial structure on haze pollution is 0.081, indicating that industrial structure is

557   also highly correlated with haze pollution. The excessive proportion of added value in

558   the secondary industry leads to the decline of air quality. The test results support H3b.

559   Based on the above tests, it is found that unreasonable energy structure and industrial

560   structure are both important causes of haze pollution.

561   Table 3

562   Impact of industrial structure and energy structure on haze pollution

                            Variables                   lnPM             lnPM
                                                      Model 1           Model 2
                            ES                        0.372***
                                                        (3.16)
                            IS                                          0.081**
                                                                          (2.13)
                            lnPGDP                     1.722***          1.629***
                                                        (5.52)            (5.19)
                            lnPGDP2                   -0.074***        -0.072***
                                                        (-4.66)          (-4.48)
                            lnPOP                      0.615***          0.782***
                                                        (3.57)            (4.47)
                            FDI                        0.011**          0.012**
                                                        (2.41)            (2.58)
                            lnMR                      -0.015            -0.029**
                                                        (-0.98)          (-1.97)
                            lnCR                        -0.001            -0.004
                                                        (-0.27)          (-0.61)
                            Constant                 15.762***         16.082***
                                                       (6.89)            (6.99)
                            Observations                390               390
                            R-squared                  0.430             0.422
                            r2_a                       0.350             0.340
                            F                          13.56             13.08

563

564   4.4. The mediating role of energy structure and industrial structure in the impact
565 of carbon mitigation tech-innovation on haze pollution 566 4.1.1. Overall carbon mitigation tech-innovation 567 According to Models 1 and 2 in Table 2, both the coefficients of energy structure 568 on haze pollution caused by carbon mitigation tech-innovation are negative at the 569 significance level of 1%, that is, 1 and 1 are significant. According to Model 3 in 570 Table 2, the coefficients of carbon mitigation tech-innovation and energy structure are 571 both significant at the significance level of 1%, that is, 1 and 1 are significant. 572 According to the Causal steps approach (Baron and Kenny.1986), if both are 573 significant, it indicates that the energy structure plays a partial mediating role in the 574 impact of carbon mitigation tech-innovation on haze pollution. According to Model 4 575 in Table 2, the influence coefficient of carbon emission reduction technological 576 innovation on industrial structure is negative at the significance level of 1%. However, 577 as the relationship between industrial structure and haze pollution in Model 5 is not 578 significant, Sobel test is needed (Sobel.1988). The verification results show that the Z 579 value of the mediating effect of industrial structure is -2.041. Therefore, the mediating 580 effect of industrial structure is significant, and the proportion of the mediating effect 581 in the total effect is 50.08%, which supports H2c and H3c. This result shows that 582 China's carbon mitigation tech-innovation can alleviate haze pollution by improving 583 the energy structure and industrial structure, and bring about synergistic effect of air 584 quality. In this process, the energy structure plays a greater intermediary role and the 585 effect is more obvious. The reason is that carbon reduction technology innovation can 586 not only improve the efficiency of fossil energy and reduce the use of such energy, but
587   also increase the proportion of renewable energy. The green transformation of energy

588   structure can more directly reduce pollution gas emissions and curb haze pollution.

589   Compared with the energy structure, the industrial structure involves a wider range,

590   and it is slower for technological innovation to reduce haze pollution through the

591   green transformation of the industrial structure.

592   4.4.1. Grey technology innovation

593        According to Models 1,2 and 3 in Table 4, its coefficients are significant at the

594   significance level of 1% and 5%, indicating that energy structure plays a partial

595   mediating role in the impact of grey technology innovation on haze pollution. Since

596   the relationship between industrial structure and haze pollution in Model 5 is not

597   significant, we also apply Sobel test. The results show that the Z value of the

598   mediating effect of the industrial structure is -2.052, indicating that the industrial

599   structure plays a partial mediating role in the impact of grey technology innovation on

600   haze pollution, and the mediating effect accounts for 62.2% of the total effect. As a

601   result, China in recent years, a lot of grey technology innovation not only direct

602   inhibition of smog pollution, but also can improve efficiency of energy utilization, is

603   advantageous to the reduction in the petrochemical industrial production energy

604   consumption and emissions of polluting gases (such as NOx , SO2 etc.), so as to

605   improve the energy structure and promote the green transformation of industrial

606   structure, to achieve indirect inhibition of smog pollution and improve air quality.

607   Table 4

608   The mediating effect of ES and IS in the impact of Grey technology innovation on haze pollution
Variable lnPM ES lnPM IS lnPM
Model 1 Model 2 Model 3 Model 4 Model 5
lnGT -0.066*** -0.023** -0.059*** -0.117*** -0.060***
(-3.36) (-2.58) (-2.98) (-4.19) (-2.97)
ES 0.323***
(2.75)
IS 0.055
(1.45)
lnPGDP 1.430*** 0.247* 1.510*** 0.025 1.432***
(4.50) (1.70) (4.78) (0.06) (4.51)
lnPGDP2 -0.061*** -0.014* -0.066*** -0.034 -0.063***
(-3.83) (-1.90) (-4.13) (-1.51) (-3.94)
lnPOP 0.670*** 0.236*** 0.593*** 0.983*** 0.724***
(3.94) (3.04) (3.48) (4.09) (4.16)
FDI 0.011** 0.002 0.010** 0.002 0.011**
(2.29) (0.94) (2.17) (0.23) (2.32)
lnMR -0.026* -0.030*** -0.016 -0.043** -0.029*
(-1.78) (-4.48) (-1.10) (-2.08) (-1.93)
lnCR -0.001 -0.003 0.000 0.049*** -0.004
(-0.16) (-1.13) (0.00) (6.40) (-0.63)
Constant 14.904*** 0.683 14.683*** -0.995 14.959***
(6.45) (0.65) (6.41) (-0.31) (6.48)
Observations 390 390 390 390 390
R-squared 0.433 0.393 0.445 0.712 0.436
r2_a 0.353 0.308 0.365 0.672 0.355
F 13.68 11.63 13.63 44.43 13.15
609 Notes: t-statistics in parentheses.all results are calculated by Stata 16.0.
610 ⁎p < 0 . 1 .
611 ⁎⁎p < 0.05.
612 ⁎⁎⁎p < 0.01.
613 4.4.2. Clean technology innovation
614 According to Models 1,2 and 3 in Table 5, it is found that the coefficients of
615 clean technology innovation in Model 1 and Model 2 are both significant, but the
616 coefficients of clean technology innovation in Model 3 are not. It is noteworthy that
617 the coefficient of energy structure is very significant. According to Baron and
618 Kenny.1986, if in Eq.(9) ~Eq.(12), 1 , 1 and 2 are significant, while 1 is not, it
619 indicates that the energy structure plays a complete intermediary role in the impact of620 clean technology innovation on haze pollution. According to the test results of Model
621 4 and Model 5, industrial structure has no obvious mediating effect on the impact of
622 clean technology innovation on haze pollution. Therefore, China's clean technology
623 innovation in recent years is mainly through the green transformation of the energy
624 structure to curb haze pollution. The reason may be that clean technology is
625 zero-carbon technology, which can increase the use of clean energy and replace the
626 consumption of coal and other fossil energy, which is conducive to improving China's
627 energy structure and indirectly inhibiting haze pollution. However, the adjustment of
628 industrial structure may require longer time and more investment in technological
629 innovation. Currently, the number of clean technology innovations in China is not
630 enough (as shown in Fig.1), so the industrial structure has not yet played an
631 intermediary role.
632 Table 5
633 The mediating effect of ES and IS in the impact of clean technology innovation on haze pollution
Variables lnPM ES lnPM IS lnPM
Model 1 Model 2 Model 3 Model 4 Model 5
lnCT -0.029* -0.016** -0.023 -0.070*** -0.024
(-1.71) (-2.15) (-1.37) (-2.93) (-1.40)
ES 0.353***
(2.98)
IS 0.072
(1.39)
lnPGDP 1.613*** 0.193 1.681*** 0.265 1.594***
(5.11) (1.36) (5.38) (0.59) (5.07)
lnPGDP2 -0.069*** -0.011 -0.073*** -0.021 -0.071***
(-4.33) (-1.57) (-4.61) (-0.93) (-4.43)
lnPOP 0.642*** 0.212*** 0.567*** 1.076*** 0.720***
(3.65) (2.66) (3.22) (4.32) (3.99)
FDI 0.011** 0.002 0.011** 0.001 0.011**
(2.36) (0.92) (2.24) (0.20) (2.39)lnMR -0.027* -0.031*** -0.016 -0.040* -0.030**
(-1.84) (-4.57) (-1.09) (-1.90) (-2.03)
lnCR -0.000 -0.003 -0.001 0.049*** -0.004
(-0.08) (-1.16) (-0.10) (6.30) (-0.69)
Observations 390 390 390 390 390
R-squared 0.419 0.390 0.434 0.705 0.425
r2_a 0.337 0.304 0.352 0.663 0.342
F 12.93 11.45 13.01 42.87 12.56
634 Notes: t-statistics in parentheses.all results are calculated by Stata 16.0.
635 ⁎p < 0 . 1 .
636 ⁎⁎p < 0.05.
637 ⁎⁎⁎p < 0.01.
638 4.5. Control variables
639 According to the test results of Model 1 in Table 2, the coefficient of population
640 density is positive,which is significant at the significance level of 1%,which indicates
641 that the scale effect of population plays a major role. It also proves that under the
642 fixed administrative area, the more population in each region, the more serious haze
643 will be.
644 According to the general testing process of EKC hypothesis,the testing of the
645 effect of economic growth is mainly conducted in the order of the second term and the
646 first term.According to the test results of Model 1 in Table 2,it can be seen that the
647 primary term of per capita GDP is positive and the secondary term is negative, and
648 the coefficient is significant at the significance level of 1%. The inverted "U" shaped
649 relationship between regional economic growth and haze pollution is verified. It
650 shows that the haze pollution level in the region increases first and then decreases
651 with the continuous improvement of regional economic development level.
652 According to the test results of Model 1 in Table 2,it is found that the coefficient
653 of openness to the outside world is positive at the significance level of 5%,which654 indicates that the direct use of foreign capital aggravates haze pollution. It is likely 655 that the local government, in order to increase employment and develop the local 656 economy,implements relatively loose environmental policies,which attracts many 657 polluting foreign enterprises and exacerbates China's haze pollution. This test result 658 supports the"pollution heaven hypothesis", while the "pollution halo hypothesis" has 659 not been verified. 660 According to the test results of Model 1 in Table 2,it is found that 661 command-and-control regulation (CR) does not significantly improve haze pollution 662 in China,and the coefficient of market-based regulation (MR) is significant at the 663 significance level of 10%. This indicates that Market-based regulation (MR) has a 664 better effect on haze pollution control in China than command-and-control regulation 665 (CR). 666 5. Health Benefit Measurement 667 Based on the above analysis, we use the empirical method to estimate that every 668 1% increase in carbon mitigation tech-innovation can reduce the haze pollution by 669 0.066%. Next, we will draw on the existing literature to estimate the health benefits of 670 carbon mitigation tech-innovation while reducing haze pollution. 671 Currently, the health benefits related to reducing haze pollution are mainly 672 measured in terms of the number of deaths averted by reducing PM 2.5 concentration 673 (Kamal Jyoti Maji et al.,2018; Yang et al., 2021c). Drawing on the results predicted by 674 Kamal Jyoti Maji et al.2018, Table 6 shows the potential health benefits from a 675 reduction in PM 2.5 concentrations by 2030. Of these, 802,000 premature deaths would
You can also read