Observing carbon cycle-climate feedbacks from space - PNAS
←
→
Page content transcription
If your browser does not render page correctly, please read the page content below
PERSPECTIVE
                         PERSPECTIVE

                                                                    Observing carbon cycle–climate feedbacks
                                                                    from space
                                                                    Piers J. Sellersa,1, David S. Schimelb,2, Berrien Moore IIIc, Junjie Liub, and Annmarie Elderingb

                                                                    Edited by Gregory P. Asner, Carnegie Institution for Science, Stanford, CA, and approved June 20, 2018 (received for review October
                                                                    6, 2017)

                                                                    The impact of human emissions of carbon dioxide and methane on climate is an accepted central concern
                                                                    for current society. It is increasingly evident that atmospheric concentrations of carbon dioxide and
                                                                    methane are not simply a function of emissions but that there are myriad feedbacks forced by changes in
                                                                    climate that affect atmospheric concentrations. If these feedbacks change with changing climate, which is
                                                                    likely, then the effect of the human enterprise on climate will change. Quantifying, understanding, and
                                                                    articulating the feedbacks within the carbon–climate system at the process level are crucial if we are to
                                                                    employ Earth system models to inform effective mitigation regimes that would lead to a stable climate.
                                                                    Recent advances using space-based, more highly resolved measurements of carbon exchange and its
                                                                    component processes—photosynthesis, respiration, and biomass burning—suggest that remote sensing
                                                                    can add key spatial and process resolution to the existing in situ systems needed to provide enhanced
                                                                    understanding and advancements in Earth system models. Information about emissions and feedbacks
                                                                    from a long-term carbon–climate observing system is essential to better stewardship of the planet.
                                                                                       |                     |              |
                                                                    remote sensing climate feedback mitigation ecosystems Winston Churchill|

                                                                    The carbon cycle is the Earth’s most fundamental                                  Fossil fuel emissions are known best from bottom–
                                                                    biogeochemical cycle, yet much of it remains enig-                            up estimates relying on national consumption and
                                                                    matic; it is a reflection of a planet with life, and its                      energy production statistics. While estimating the car-
                                                                    relevance to life has long been apparent. It is quite                         bon released as CO2 and CH4 from land-cover and
                                                                    remarkable and telling that human activity has signif-                        land-use change and animal husbandry remains chal-
                                                                    icantly altered carbon cycling at the planetary scale.                        lenging, it is becoming more certain, partly due to
                                                                    The atmospheric concentrations of CO2 and CH4                                 advances in remote sensing (7). Uncertainty of pertur-
                                                                    have dramatically exceeded their envelope of the                              bation due to fossil fuel emission on the global carbon
                                                                    last several million years. This increase is important                        cycle will likely grow both in an absolute sense, as
                                                                    in itself, and the increases of CO2 and CH4 shift the                         fluxes increase and their proportional uncertainty re-
                                                                    Earth’s climate on time and space scales that are                             mains stable, and in a relative sense, as more emis-
                                                                    important to humans.                                                          sions occur in nations or regions with inadequate or
                                                                        The perturbation of the carbon cycle by humans                            poorly developed reporting systems. The current un-
                                                                    occurs first and foremost through the transfer of                             certainty of flux estimates of the perturbation is evi-
                                                                    carbon from geological reservoirs (fossil fuels) into                         denced, in part, by disagreements between top–down
                                                                    the active land–atmosphere–ocean system (1–3) and,                            derived flux estimates (using atmospheric concentra-
                                                                    secondarily, through the transfer of biotic carbon from                       tion measurements) and bottom–up inventory methods
                                                                    forests, soils, and other terrestrial storage pools (e.g.,                    for both CO2 and CH4 (8–10). Quantifying the forcing
                                                                    industrial timber) into the atmosphere as well as                             (emissions) is, obviously, essential to the development
                                                                    through the additional production of greenhouse                               of any effective policy frameworks and early evidence
                                                                    gases in managed and agricultural lands (4–6).                                from a new satellite mission suggests that a mature

                                                                    a
                                                                     Sciences and Exploration, Goddard Space Flight Center, Greenbelt, MD 20771; bCarbon and Ecosystems Group, Jet Propulsion Laboratory,
                                                                    California Institute of Technology, Pasadena, CA 91109; and cCollege of Atmospheric and Geographic Sciences, University of Oklahoma,
                                                                    Norman, OK 73019
                                                                    Author contributions: P.J.S., D.S.S., B.M., J.L., and A.E. designed research; D.S.S., J.L., and A.E. performed research; J.L. contributed new reagents/
                                                                    analytic tools; D.S.S. and J.L. analyzed data; and P.J.S., D.S.S., B.M., and A.E. wrote the paper.
                                                                    The authors declare no conflict of interest.
                                                                    This article is a PNAS Direct Submission.
                                                                    Published under the PNAS license.
                                                                    1
Downloaded by guest on December 25, 2021

                                                                     Deceased December 23, 2016.
                                                                    2
                                                                     To whom correspondence should be addressed. Email: david.schimel@jpl.nasa.gov.
                                                                    Published online July 9, 2018.

                                           7860–7868 | PNAS | July 31, 2018 | vol. 115 | no. 31                                                                   www.pnas.org/cgi/doi/10.1073/pnas.1716613115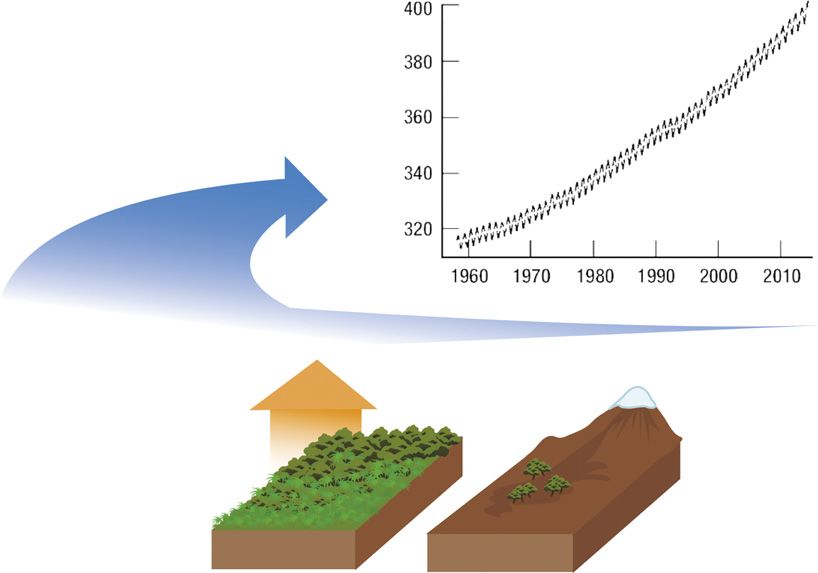
space-based greenhouse gas observing system could aid in esti-                              is called the airborne fraction (AF) and, by definition, represents the
                                           mating national to regional emissions of fossil CO2 (10, 11).                               proportion of human emissions that remains in the atmosphere—the
                                               Concentrations, however, not only reflect emissions but also                            human effect on the atmosphere and hence on climate.
                                           are substantially modulated by uptake by terrestrial and marine                                 Earth system models, which reproduce the AF in the present,
                                           systems, which reduce atmospheric carbon accumulation by nearly                             fundamentally disagree at the process level and consequently
                                           50%. What controls the quantitative rate of increase in the                                 disagree when simulating the future. Differences in model parame-
                                           atmospheric fraction of human CO2 and CH4 emissions? Clearly,                               terizations and structures, despite seemingly similar behavior in
                                           concentrations are a function of emissions; however, other pro-                             the present, are reflected by significant differences when projecting
                                           cesses, some of which may be climate dependent, are involved                                the future. This is important: If the balance among the emissions
                                           and are not yet well understood. If the balance of sources and sinks                        and the uptake processes changes, then the airborne fraction will
                                           changes as a result of carbon–climate feedbacks, then climate                               change, and, as a result, so will climate forcing (18). Climate-
                                           forcing and the impact of human activities will change (12).                                induced feedbacks on the carbon cycle and carbon-cycle feedbacks
                                               Understanding and ultimately predicting the stability of atmo-                          on climate have long been hypothesized (19). The concentration of
                                           spheric CO2 and CH4 levels in the future are the key concerns that                          CO2 over the past decades shows substantial variability on interannual
                                           motivate this Perspective. Climate can affect large-scale release of                        to decadal timescales, and the variation shows climate correlations
                                           CO2 from the Earth system. For example, terrestrial tropical ecosys-                        suggesting the imprint of strong climate feedbacks (Fig. 2). However,
                                           tem feedbacks from the El Ni~   no drove an ∼2-PgC increase in global                       the mechanisms through which carbon–climate feedbacks occur re-
                                           CO2 emissions in 2015 (13, 14). If emissions excursions such as this                        main controversial, since few lines of evidence provide unambiguous
                                           become more frequent or persistent in the future, agreed-upon mit-                          conclusions about the nature and magnitude of the various effects.
                                           igation commitments could become ineffective in meeting climate                                 The case for methane is even more complicated. Atmospheric
                                           stabilization targets. Earth system models disagree wildly about the                        CH4 is currently at three times its preindustrial levels (15), which is
                                           magnitude and frequency of carbon–climate feedback events, and                              clearly driven by anthropogenic emissions, but equally clearly,
                                           data to this point have been astonishingly ineffective at reducing this                     some of the change is because of carbon-cycle–climate feed-
                                           uncertainty. Space-based observations provide the global coverage,                          backs. Atmospheric CH4 rose by about 1%/y in the 1970s and
                                           spatial and temporal sampling, and suite of carbon cycle observations                       1980s, plateaued in the 1990s, and resumed a steady rise after
                                           required to resolve net C fluxes into their component fluxes (photo-                        2006 (20). Why did the plateau occur? These trends in atmo-
                                           synthesis, respiration, and biomass burning). These space-based data                        spheric methane concentration are not understood (21). They
                                           substantially reduce ambiguity about what is happening in the pre-                          may be due to changes in climate: increases in temperature, shifts
                                           sent and enable us to falsify models more effectively than previous                         in the precipitation patterns, changes to wetlands, or prolifera-
                                           datasets could, leading to more informed projections (15, 16).                              tions in the carbon availability to methanogens (22). Current data
                                               Remarkably, Earth system processes have produced a relatively                           are insufficient to provide a definitive conclusion (21).
                                           stable average proportion of anthropogenic emissions (from fossil                               Speaking broadly but accurately, carbon science has been
                                           fuel combustion, cement production, and land use) being retained in                         limited by data. Critical regional scales where climate variation
                                           the atmosphere (17) (Fig. 1). The fact that this proportion has                             produces globally significant carbon cycle fluxes have been all but
                                           remained relatively constant at ∼0.5 over the last 50 y is both in-                         impossible to observe directly. Since carbon exchange is the net of
                                           teresting and noteworthy. The ratio of the annual increase in atmo-                         numerous component fluxes, attributing its variation to underlying
                                           spheric carbon dioxide to the emissions from anthropogenic sources                          mechanisms affecting one or another component have had to be
                                                                                                                 Concentration (PPM)

                                                                            Atmospheric
                                                                            Increase 4.7
                                                                                                                                                    Decades
                                                                                Fossil +9.6      Tropical land -0.7                       Extratropical land -3.0     Ocean -2.7
                                                                                                     Net
                                                                                                 Deforestation
Downloaded by guest on December 25, 2021

                                           Fig. 1. Earth system feedbacks lead to sinks that absorb about half of anthropogenic emissions, with the remainder contributing to the
                                           atmospheric increase. Fluxes are from Le Quéré et al. (17) and partitioned consistent with Fig. 3. This budget is not balanced and includes a
                                           0.6 Pg/y residual flux.

                                           Sellers et al.                                                                                                        PNAS | July 31, 2018 | vol. 115 | no. 31 | 7861
inferred indirectly. Recent work suggests satellite observations can the land and ocean carbon exchange to increasing CO2. By
fill the gap in the resolution of processes and regional scales. Re- analogy to electrical systems, β and γ are the gain of the car-
search on feedbacks has focused almost exclusively on feedbacks bon–climate system or the extent to which increasing CO2
via CO2 (23); we likewise focus on CO2 but return to CH4 and affects the concentration of CO2 directly through concentration
methane–climate feedbacks later in this paper. We also note and indirectly through climate. Models of the carbon–climate
that there is still a relative scarcity of methane measurements system include both γ and β feedbacks, but current parameter-
from space—although this is rapidly changing with the launch of izations vary and produce a wide range of divergent results (25),
TROPOspheric Monitoring Instrument (TROPOMI) on Sentinel 5P the iconic Freidlingstein plot.
(24). We focus primarily on emerging evidence from a variety of Current scientific understanding is that roughly 25% of the
sources and argue that by using space-based measurements we carbon emitted by anthropogenic sources is being sequestered in
can begin to observe the signatures—the time/space and process the oceans, largely as a result of β or concentration-gradient–
patterns of flux—of several long-hypothesized feedbacks. driven exchange (26). Ocean models agree on global carbon in-
ventories, but they diverge on the specific regions responsible,
Carbon–Climate Feedbacks in the Contemporary Era which means that apparent convergence of modeled future ocean
Friedlingstein et al.’s (25) seminal paper outlined the current uptake is not robust. The understanding of future changes to
framework for studying the carbon–climate feedbacks for CO2. ocean circulation and biogeochemistry remains imperfect; this is
Friedlingstein et al. (25) showed that for CO2 the carbon–climate understandable, given the myriad positive and negative feed-
feedbacks can, at a high level, be described by the equation backs. However, there is an extensive array of physical and bio-
chemical in-ocean tracers, which provide valuable large-scale
g = −αðγland + γocean Þ=ð1 + βland + βocean Þ. [1] constraints on the surface exchange of CO2; such constraints are
generally absent for the terrestrial system (27).
In this expression, α is the linear climate sensitivity in degrees Terrestrial feedback effects remain uncertain. While experi-
K/ppm CO2, the γs are the sensitivities of the land and ocean mental studies consistently show increases in plant growth rates
carbon exchange to climate, and the βs are the sensitivities of under elevated CO2 (β, termed CO2 fertilization), the extrapolation
0.6
atmospheric growth
Airborne Fraction
10 0.5
0.4 land sink
0.3
0.2
ocean sink
0.1
8 0
La Niña Average El Niño
(Moderate / Strong) (Moderate/ Strong)
6
GtC year -1
4
2
2
El Niño
1
0
-1
La Niña
-2
1960 1970 1980 Year 1990 2000 2010
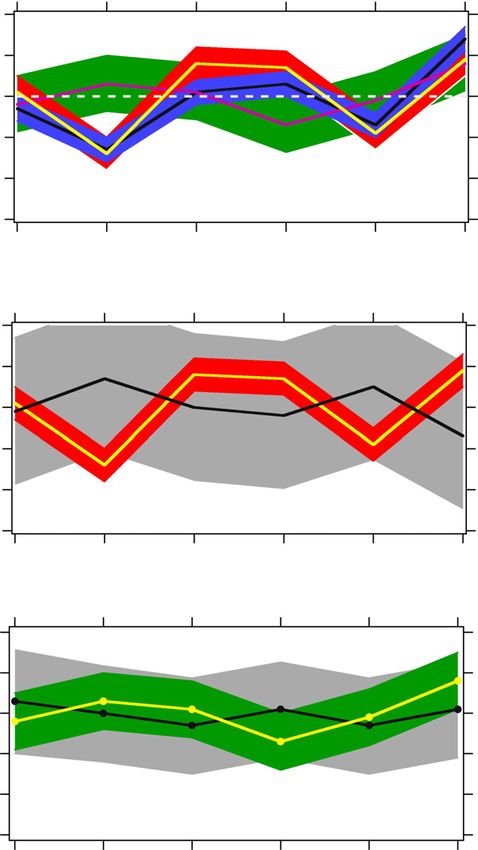
Fig. 2. The fate of fossil fuel over the 1959–2015 CO2 record, the ENSO cycle, and the AF. Over the long term, atmospheric CO2 increases relatively
smoothly, but varies considerably from year to year, largely due to variable land uptake. Variability in the land uptake is correlated with the El Ni~no
cycle (Lower) with more fossil fuel CO2 remaining in the atmosphere during El Ni~ no periods as a result of reduced land uptake and the opposite in La
Ni~
nas (AF Inset). Total anthropogenic emissions (including fossil fuel emissions and land use) are partitioned into their fate as atmospheric CO2
Downloaded by guest on December 25, 2021
growth (red), land sink (green), and ocean sink (blue). The AF is the ratio of the atmospheric CO2 to the sum of all three terms. Data are from Le Quéré
et al. (17). Lower shows the Oceanic ENSO index (68) and Upper Inset shows the AF [computed from Le Quéré et al. (17)] binned for the time period
when the ENSO index is in the Top or Bottom shaded region (Lower), indicating moderate to strong El Ni~ no or La Ni~
na conditions.
7862 | www.pnas.org/cgi/doi/10.1073/pnas.1716613115 Sellers et al.of even the largest-scale experiments to ecosystem carbon storage To try to tease apart β and γ feedbacks, Keenan et al. (32)
is problematic and some ecologists have argued that the physio- exploited the fact that global warming over vegetated land notably
logical response could be eliminated entirely by restrictions due to slowed since the start of the 21st century (the so-called temperature
limitation by nutrients or micronutrients (28). However, there is re- pause). Atmospheric CO2 concentrations continued to rise, and
cent evidence from the atmosphere that suggests increasing CO2 there was also slowing of the growth rate of atmospheric CO2 be-
enhances terrestrial carbon storage, leading to the continued in- tween 2002 and 2014. This coincided with a period during which
crease in land uptake paralleling CO2 concentrations (17, 29). Fig. 3 global temperature increases over vegetated land also slowed. This
shows the carbon budgeting technique, called the “diver-down” provided an opportunity to test the relative roles of some of the
method (29, 30). Fluxes in the plot are derived from assimilating processes creating the enhancement of terrestrial carbon uptake
either in situ data (for the pre-CO2 satellite period) or satellite es- and the consequent decline in the AF. Keenan et al. (32) concluded
timates of column-averaged concentrations of CO2 (for the recent that the terrestrial sink was enhanced primarily by CO2 fertilization
period) into atmospheric transport models (13). (β feedback) and secondarily by a slowdown in temperature-driven
In a diver-down analysis, the global carbon budget (31) is used ecosystem respiration (γ feedback).
as a constraint on the net land flux; assimilation of CO2 data is Ballantyne et al. (33) both agree and disagree with Keenan
used to partition the global net land flux between the tropics and et al. (32). Ballantyne et al. (33) find no evidence of increases in
the northern extratropics. In situ and inventory information can be primary production during the “temperature pause,” but rather
used to estimate tropical land use flux, by estimating the sink attribute the decline in the AF solely to temperature-induced
needed to balance the net deforestation flux so that their differ- declines in ecosystem respiration (γ feedback). We note that
ence (net deforestation − sink = estimated net flux) matches the during this temperature pause, and for two decades earlier, there
observed net flux (29). Because the net tropical flux for 2010– was a pattern of increased terrestrial “greening,” observed via
2013 is small, ∼0.2 PgC/y (Fig. 3), this suggests a sink balancing trends in satellite vegetation indexes, in the northern extratropics.
the estimated net deforestation (17) during this period, or about This increased greening is thought to be the result of a warming
∼0.7 PgC/y, likely due to CO2 “fertilization” or β. This uptake, climate and increasing CO2 (CO2 fertilization), but this causality is
which is smaller than the estimate of 1.4 PgC/y similarly derived not well established and significant debate continues (34–36).
for earlier decades, may reflect a saturating sink, growing nutrient Like the temperature pause, the strong 2015 El Ni~ no provided
limitation, or the influence of increasing climate stress. another opportunity to probe the roles of different terrestrial
processes in the carbon–climate feedback. The response of the
carbon cycle as expressed by changes in atmospheric CO2 con-
6 centrations during the El Ni~
Tropical and Southern Hemisphere (GtC year -1)
no has been evident since the early
1980s, and although early work attributed this response to the
4 oceans (37), more recent work has shown that it is largely (38, 39),
although not entirely, due to the land (40). Fig. 2 shows the sig-
nificant year-to-year variation in uptake and release of carbon in
2 2015 Fluxes
the Earth system in proportion to total anthropogenic emissions.
A simple analysis shows the effect of the variation on the AF. The
1990-2004 Fluxes
0 average AF, binned by phases of the El Ni~ no Southern Oscillation
2010-2013 Fluxes (ENSO) cycle, reveals a relationship between climate variability
NH Increase
and the AF (Fig. 2, Inset).
-2 El Ni~no years tend to be hot and dry in the tropics, while La
Ni~na years tend to be cold and wet (41). While the decadal effect
-4
of the terrestrial biosphere is a sustained CO2 sink, Fig. 2 illus-
trates the impact of γ. This simple histogram shows that the AF is
high during El Ni~ no years, relative to the long-term mean, due to
-6 carbon release from ecosystems, and low during La Ni~ na years as
6 -5 -4 -3 -2 -1 0 1
Northern Extratropics (GtC year -1) a result of larger than usual terrestrial CO2 uptake. As the tropical
climate moves toward El Ni~ no-like droughty conditions, tropical
Fig. 3. Decadal increases in northern extratropical uptake and
anomalous fluxes during the El Ni~ no year of 2015. Shown is
carbon uptake declines or transitions to net emission, while under
partitioning of the average and 2015 El Ni~ no land sink between the La Ni~ na conditions, carbon uptake increases.
northern extratropics and Southern Hemisphere (SH), 1990–2015. The asymmetry in magnitude between the La Ni~ na and the El
The sum of the northern extratropical and Southern Hemisphere and Ni~no AFs (Fig. 2, Inset) is not unexpected, and it likely reflects two
tropical, SH axis values equals the total land sink and can be
compared with the residual land sink from the global budget factors. First, the terrestrial climate anomalies between La Ni~ na
(indicated by the diagonal band) calculated by the Global Carbon and the El Ni~ no are not mirror images and affect different geo-
Project, in this case averaged for the years 2010–2016. Any graphic regions (41–43) and biomes with very different charac-
combination of SH and Northern Hemisphere (NH) within the band teristics. Second, terrestrial systems are slow-in/fast-out systems
(± uncertainty, the width of the band) satisfies the global carbon
budget constraint. The constraint for the period 1990–2007 was that accumulate carbon over decades at a pace limited by plant
quite different and is not the same as the 2010–2016 band. The growth and soil carbon stabilization, but can lose carbon far more
average fluxes for the period 1990–2004 are from Schimel et al. (29). quickly due to wildfire and plant mortality. From this, one would
The blue arrow indicates the apparent large decadal increase in NH
expect a smaller carbon cycle response during La Ni~ na/uptake
Downloaded by guest on December 25, 2021
extratropical uptake from the earlier period to the present. The
2010–2013 results are from the Carbon Monitoring System-Flux conditions compared with El Ni~ no/loss conditions of drought (and
system (49). fire) (losses), as shown in Fig. 2, Inset.
Sellers et al. PNAS | July 31, 2018 | vol. 115 | no. 31 | 7863Satellite Observations of Carbon–Climate Feedbacks and the El Ni~ no year. Satellite-constrained estimates show the El
Satellite observations provide information about the carbon cycle Ni~
no effect varies regionally within the tropics (13).
in two ways. First, satellites observe column CO2 (XCO2) and Earlier analyses of the El Ni~
no effect of the carbon cycle have,
provide dense sampling of CO2 in areas of the world poorly ob- at best, quantified pan-tropical responses with considerable un-
served by the surface observing network, which have been of certainty about the role of the humid and semiarid tropics. Anal-
particular importance in the tropics and have already led to sci- yses in Liu et al. (13) exploiting the increased density of
entific advances. The improvement in sampling has long been observations in the tropics showed that each tropical continent
anticipated in the literature (44). Second, and less anticipated, responded to drought conditions, but remarkably simultaneous
satellites provide both the net flux of CO2 and several of its key estimates of CO2 flux, biomass burning, and photosynthesis from
process-level fluxes. The ability to measure net fluxes comes from space showed that each continent responded idiosyncratically.
the serendipitous discovery that solar-induced fluorescence (SIF) These flux differences between years are less sensitive to errors
can be observed, taking advantage of the oxygen-A band. The caused by transport or bias in the data, which tend to have some
oxygen-A band is used on greenhouse gas satellites to determine consistency over time (47).
optical path length through the atmosphere (45). SIF is directly Additional satellite data streams allow further decomposition
correlated with terrestrial photosynthesis, so greenhouse gases of the net CO2 flux into its component fluxes (13). There are now
satellites provide not only the net flux [net ecosystem exchange space-based observations of SIF (48), directly related to photo-
(NEE)] of CO2 but also one of the gross fluxes [photosynthesis of synthesis and hence GPP. Using SIF-derived estimates of GPP
gross primary production (GPP)]. Finally, satellite measurements of together with satellite inversions of XCO2 to infer the net terrestrial
CO, a tracer for fossil and biomass burning, have long been avail- carbon flux (NEE) and estimates of biomass burning constrained
able. The combination of XCO2, SIF, and CO allows carbon fluxes to by satellite-based concentrations of carbon monoxide (XCO), the
be analyzed in ways fundamentally different from earlier analyses of terrestrial carbon balance can be estimated from the equation:
the surface network. Fossil fuel emission estimates can also be
NEE − GPP + BB = Reco , [2]
improved using multitracer approaches, including the use of CO
and NO2 (10). Below, we provides examples from recent work that
where NEE is the net carbon exchange, GPP is gross primary
demonstrate the scientific impact of both the density of observa-
productivity, BB is biomass burning, and Reco is ecosystem
tions and the availability of NEE, GPP, and biomass burning fluxes.
respiration, which can be estimated as the residual. By com-
Inversions of atmospheric concentrations (or mixing ratios) of
bining satellite measurements of XCO2, SIF, and XCO, the pri-
CO2 to determine surface fluxes are hugely dependent upon rel- mary net and contributing gross fluxes of CO2 can be
atively dense satellite observations; this is particularly true in the estimated separately, which enhances the analysis of cli-
tropics where in situ measurements are very sparse (46). NASA’s mate effects on ecosystem processes. In addition, assessing
OCO-2 was launched just in time to observe the El Ni~ no of 2015 in the consistency or contradictions between independent ob-
detail, but the Japanese GOSAT instrument (Table 1), launched in servations of component and net fluxes provides another way
2009, provided a baseline that could be used to quantify flux of assessing the likelihood of detecting systematic error in one
changes between years with climatological temperature and rainfall or another of the measurements.
Table 1. Past, ongoing, and planned greenhouse gas missions 2002–2025
Mission (sponsoring agency) CO2 CH4 Orbit Start–finish
Past
ENVISAT SCIAMACHY (ESA) • • LEO 2002–2012
Ongoing
GOSAT TANSO-FTS (JAXA-MOE-NIES) • • LEO 2009–ongoing
OCO-2 (NASA) • LEO 2014–ongoing
TanSat ACGS (CAS-MOST-CMA) • LEO 2016–ongoing
Sentinel 5P TROPOMI (ESA) • LEO 2017–ongoing
Feng Yun 3D GAS (CMA-CNSA) • • LEO 2017–ongoing
Planned
Gaofen 5 GMI (CNSA) • • LEO 2018–2026
GOSAT-2 TANSO FTS-2 (JAXA/MOE/NIES) • • LEO 2018–2023
OCO-3 (NASA) • LEO-precessing (ISS) 2019–2022
MicroCarb (CNES-UKSA) • LEO 2020–2025
MERLIN (DLR-CNES) • LEO 2021–2024
MetOp-SG Sentinel 5 (Copernicus) • • LEO 2021–2025
GeoCarb (NASA) • • GEO 2022–2025
These missions use passive spectroscopic measurements of reflected sunlight as well as an active laser sensor
(MERLIN), deployed in differing orbital vantage points (LEO, GEO, and on the ISS), and provide diverse
measurements well out into the future, and require calibration and bias correction and intercalibration against each
other. ESA, European Space Agency; CAS, Chinese Academy of Sciences; CMA, Chinese Meteorological Agency;
CNSA, Chinese National Space Administration; CNES, Centre National d’Études Spatiales; DLR, Deutsches Zentrum
Downloaded by guest on December 25, 2021
für Luft-und Raumfahrt; GEO, geostationary orbit; ISS, International Space Station; JAXA, Japan Aerospace Explora-
tion Agency; LEO, low Earth orbit; MOE, Ministry of the Environment, Japan; NASA, National Aeronautics and Space
Administration; NIES, National Institute for Environmental Studies, Japan; UKSA, United Kingdom Space Agency.
7864 | www.pnas.org/cgi/doi/10.1073/pnas.1716613115 Sellers et al.The increased continental-scale resolution of flux and un-
A 2
derlying processes (fire, respiration, photosynthesis) provided an
entirely new level of detail about carbon cycle responses to cli- 1
GtC year -1
mate, foreshadowing the potential of a mature space-based ob-
serving system. Focusing on the El Ni~ no droughts of 2015, the 0
increased resolution at subcontinental scales showed that carbon
-1
emissions overall increased in tropical forest regions (13) and not
primarily in semiarid regions as may have occurred in previous -2
droughts (43). The 2015 El Ni~ no impacts on local climates differed
in each tropical forest region, with high temperatures in tropical -3
Africa but near-normal rainfall; whereas in Asia and tropical South 2010 2011 2012 2013 2014 2015
America conditions were both hot and dry. The primary bio- year
geochemical responses were revealed by the satellite’s combi-
nation of spatial and process resolution and were different on B 2
each continent as well. All three continents showed release of
CO2, but fire dominated emissions in Asia, based on CO:CO2 1
GtC year -1
ratios (13). In Amazonia, SIF dropped, reflecting reduced photo-
0
synthesis, while in Africa, net carbon uptake declined, but without
concomitant reductions in SIF or increases in CO, implying that -1
Reco increased (13).
The strong interannual correlation between tropical climate -2
variability and CO2 concentration anomalies has been used to
provide a simple global constraint on carbon–climate feedbacks
-3
(23, 25). By assuming that CO2 concentration variability reflects 2010 2011 2012 2013 2014 2015
global mean tropical climate anomalies, interannual variability of year
global mean CO2 concentration provides an observational con-
straint on carbon cycle model sensitivities to climate, reducing
C 2
uncertainty about predicted future carbon–climate feedbacks (23).
1
Satellite results show that each tropical continent’s El Ni~no weather
GtC year -1
could be characterized as drought, but with varying changes to 0
temperature and rainfall. The carbon cycle changes reflect regional
extremes and ecological responses that may depend on region, -1
rather than widespread, uniform tropical average changes.
-2 Global Growth Rate NH NEE
Partitioning net carbon flux into its component fluxes can add
SH NEE GPP
insight to variations even at very large scales. The tropics domi- -3
nated interannual variability in the growth rate of CO2 over the 5 y 2010 2011 2012 2013 2014 2015
previous to the 2015 El Ni~ no (Fig. 4A). The longer XCO2 and SIF year
time series, recently published (49), shows that GPP (estimated
from SIF) does not fully explain tropical net flux changes over the Fig. 4. Net carbon exchange and photosynthesis anomalies over the
satellite record for southern and northern land areas. Photosynthesis
period 2010–2015 (Fig. 4B), as the increases estimated from SIF does not fully explain variation in carbon exchange. (A) Tropical
were only one-third as large as the variation in net exchange, variability in NEE (red) dominates interannual variation in the global
while GPP did not explain extratropical exchange either (Fig. 4C). growth rate of atmospheric CO2 (blue), with northern (NH) land
The importance of respiration and fire over GPP in terrestrial flux (green) showing lower and uncorrelated variation. (B) Interannual
variation in GPP does not explain tropical variability in NEE,
variability may be a general pattern and not specific to the
suggesting strong roles for fire and/or respiration. (C) NH GPP
2015 tropical response. remains relatively constant through the 2010–2015 period, while
While the satellite record is still too short to derive a formal, beginning in 2013, NEE declines by nearly 50%. By convention, +GPP
probabilistic measure of carbon–climate sensitivity, the initial indicates uptake, while –net flux (NEE) indicates uptake. Anomalies
studies described above suggest it will be a powerful tool. Im- are calculated by subtracting the long-term mean to highlight
interannual changes and reduce sensitivity to transport and data bias
portantly, satellite data do not require collapsing carbon–climate errors.
sensitivity into a one-dimensional metric but allow for regions
such as the tropics and Arctic–Boreal zone to be assessed sepa-
rately. In addition, in contrast to flux estimates from the in situ (e.g., ref. 51) and the sparse observing network (e.g., refs. 52 and
networks, satellite observations allow partitioning of the net CO2 53). Current and future satellite observations may allow progress
flux into its constituent process-level fluxes. Initial results suggest (8) in resolving these different contributions to the methane
strong carbon flux correlations with climate and imply that positive budget. In particular, there is significant although not unequivocal
carbon-cycle–climate feedbacks may be more prevalent than evidence that tropical wetlands have played an important role in
anticipated by modeling studies (50). driving methane trends over the past two decades (e.g., refs. 52
and 54) as a result of their large contribution to the methane budget
Methane–Climate Feedbacks coupled to substantial variability in tropical precipitation. If true, this
Determining the relative contributions of anthropogenic and suggests significant sensitivity of wetland fluxes to climate, but
Downloaded by guest on December 25, 2021
Earth system drivers to the CH4 trends has been challenging due testing this hypothesis is challenging given the substantial un-
to the uncertainties in all components of the methane budget certainty in global wetland fluxes (Fig. 1). Fossil and agricultural
Sellers et al. PNAS | July 31, 2018 | vol. 115 | no. 31 | 7865sources may also have contributed to the methane trends (e.g., refs. been expended, our first author reminds us that Winston Churchill
53 and 55), as have changes in the hydroxyl radical (OH) sink (56). A once said, “We have run out of money, now we must think.”
recent inverse model study (57) showed that the current global With diverse and conflicting requirements and at any fixed
suborbital observation system for atmospheric methane (including cost, either carbon–climate feedback questions must be priori-
isotopes) cannot unambiguously attribute methane trends to spe- tized, leaving some regions and processes less adequately ob-
cific source sectors vs. removal by OH; sustained and improved served, or a constellation of instruments must be developed. The
measurements are essential. Continuing as well as new, spatially most cost-effective approach to this is not self-evident. Addi-
denser satellite measurements of CH4 are likely to play an in- tionally, because of the mass balance constraint on fluxes (be-
creasing role in understanding CH4 (Table 1). cause the global budget is relatively well known), there is
synergism between observing systems that produces added in-
Observing System Challenges formation; but realizing this requires addressing calibration and
To diagnose and quantify feedback processes, extremely valuable bias correction that depends on the robust network of surface
and observable geophysical quantities, CO2 and CH4 concentra- concentration TCCON XCO2 (59) measurements.
tions, can be used to estimate surface fluxes (58). Different processes
and regions each present different challenges to obtaining sufficient The Way Forward
density and duration of concentration measurements in time and Thinking today, as in the Churchill quotation above, requires more
space, reflecting seasonal cycles, cloud climatologies, interferences than just cogitation; it now depends on computation as well.
such as aerosol and albedo, and the sizes of characteristic concen- Carbon scientists, recognizing the challenge of a carbon and cli-
tration gradients. Long time series are needed to observe carbon– mate observing system, have long used simulation, sometimes
climate feedbacks as they emerge and to quantify the relationships borrowing a concept from meteorology—observing system sim-
between climate and anomalous fluxes, requiring a sustained ob- ulation experiments (OSSEs)—to design optimal observing strat-
serving system and the ability to intercalibrate successive sensors. egies. The first such study examining the carbon cycle was Rayner
All of the known remote measurement techniques, whether et al. (38), which focused on CO2 and enhancing the surface ob-
using reflected sunlight or active laser illumination, are subject to serving network. That study identified one site in the Amazon as
bias errors, where the true signal is modified by other atmospheric providing the largest marginal reduction in uncertainty. Carbon-
and surface effects and these systematic errors may have regional cycle OSSEs begin by assuming or simulating a set of surface
variation. Systematic error may result from surface albedo, at- fluxes, the “truth” (often referred to as a ‘nature run’) to create a
mospheric aerosols and their height distribution, thin clouds, and simulated global pattern of concentrations using an atmospheric
other challenging but correctable effects (59). Active (LIDAR) transport model to translate fluxes into concentrations. Those
greenhouse gas measurements may be less susceptible to these concentrations are then translated into observations using a
biases, but this has not yet been demonstrated in the field. model of the proposed instrument and its interaction not only with
While today’s greenhouse gas instruments were designed CO2 but also with factors that interfere with the observation, such
to meet standards for accuracy and precision determined by as clouds, aerosols, surface albedo, and viewing geometry. The
global-scale gradients of CO2 and CH4 (60), next-generation ap- set of simulated observations is used to estimate fluxes, and the
proaches will have to target regional and even subcontinental estimated fluxes are compared with the nature run.
carbon-cycle processes. Systems including passive spectroscopy OSSEs allow quantification of the uncertainty of the observing
for wide coverage and active sensors capable of winter mea- system. Since the release of Rayner et al.’s (38) original paper,
surements for high latitudes, as well as constellations of satellites OSSEs have played a significant role in the design of NASA’s
contributed by multiple spacefaring nations, are attractive in- orbiting carbon observatory mission (60, 62), have aided NASA
tuitively, but calibration of each sensor against the others must be and the European Space Agency (ESA) in designing follow-up
a part of an overall strategy, requiring maintenance and expansion missions (63), and were critical to NASA’s decision to select a
of the in situ and Total Column Carbon Observing Network geostationary (GEO) carbon observatory for XCO2 and XCH4. Re-
(TCCON) networks. There is also the emerging possibility of land- cent OSSE documents, for example, outline the advantages of
focused geostationary satellites such as GeoCarb (61). Global persistent observations from GEO [potentially multiple observa-
terrestrial coverage could be provided by three to four geosta- tions per day compared with ∼1/mo for similar low-Earth orbiting
tionary platforms (e.g., roughly 110°W, 70°W, 85°E, and perhaps (LEO) approaches] for resolving both small-scale biogeochemical
on the prime meridian), but would not observe oceans and and regional urban processes (2, 64). Other studies identify the
high latitudes. need for winter measurements at high latitudes where low solar
Building an optimal (or reasonably optimal) carbon–climate angles and short days limit the use of reflected sunlight spectro-
observing system from the existing and planned sensors (Table 1), scopic measurements, and either airborne in situ or active remote
likely launched by at least seven space agencies, plus new invest- sensing using laser measurements is required (63).
ments in missions and technology yet to be made, requires careful Planning greenhouse gas missions and their scientific exploi-
analysis of the science and how it is affected by the variables tation is especially challenging as the actual retrieval, the vertically
measured by the observing system (XCO2, XCH4, CO, SIF, etc.) and integrated amount of the gas in question, is, for the most part, not
their sampling in time and space, accuracy, and precision. The the quantity of scientific interest. Instead, the surface fluxes, de-
specific observing challenges (clouds, sunlight, observing mode, duced from the time–space patterns of concentration in combi-
expected signal size, and bias error) must be incorporated into nation with atmospheric transport, are the focus of research (44,
analysis tools. Once these factors are quantified, then the uncertainty 62). This requires advancing the capability for mission simulation
of the derived flux estimate from simulated concentration (mixing and extending it to multiple tracers beyond the current state of
ratios) measurements of CO2 and CH4 (XCO2 and XCH4) can be esti- the art; this is a scientific undertaking in and of itself, in the spirit of
Downloaded by guest on December 25, 2021
mated and quantified. Since massive investments are required for a the very first OSSE study by Charney et al. (65) in 1969 as part of the
global carbon observing system, and substantial sums have already Global Atmospheric Observing Program.
7866 | www.pnas.org/cgi/doi/10.1073/pnas.1716613115 Sellers et al.Conclusions scientists to probe the carbon cycle by partitioning the net ex-
The carbon cycle, a focus of sustained research since the 1950s, change of CO2 into some of its key component gross fluxes. These
contains a mystery that grows more and more perplexing over component fluxes each respond to the environment independently
time. How does the mean AF of CO2 remain so constant for such a and the apparent climate response of their sum, NEE, is difficult to
sustained period of time, while at the same time varying so sub- attribute unambiguously to particular mechanisms. As a result, the
stantially year to year? We have no robust quantitative or pre- suite of space-based measurements of net and component fluxes
dictive explanation for this or for the variation in the growth rate of will provide additional insight into how climate affects the carbon
CH4; although models have been tuned to reproduce observed cycle. Advancing these capabilities requires continued effort on the
behaviors, these same models predict wildly varying greenhouse
development of missions, the maturation of algorithms, calibration
gas concentrations in the future.
and validation procedures, and improved inverse and assimilation
The sparsity of data on carbon fluxes over regions corre-
models, as well as the integration of multiple tracers of both Earth
sponding to today’s major climate anomalies (42, 66) has limited
system and anthropogenic processes.
our ability to quantify the strength of carbon–climate system
The challenge is of more than just scientific importance. Carbon–
feedbacks, since the majority of the in situ observing effort is in the
midlatitudes, while the potential feedbacks are largest at high and climate feedbacks influence future climate uncertainty and could
low latitudes where the majority of terrestrial carbon storage re- confuse emission reduction targets. Proposed and agreed-to miti-
sides. Synthesis of existing observational studies, including new gations of emissions assume a relationship between emissions,
satellite results, demonstrates strong coupling between the car- concentrations, and, ultimately, climate, but perhaps as a result of
bon cycle and the climate system and, as records lengthen, should model uncertainty, future changes to the AF have not been trans-
increasingly inform us about carbon-cycle feedbacks. parently integrated into negotiating frameworks. Carbon–climate
As Pierre Friedlingstein observed in a presentation at a March feedbacks affect the emission–concentration–climate relationship
2015 workshop (67), in situ networks alone have “no hope of and control the magnitude of reductions required to achieve any
being a strong constraint over carbon–climate feedbacks,” while given temperature target (15). For example, 2015–2016 El Ni~ no
measurements of atmospheric concentrations of CO2 and CH4 carbon-cycle carbon anomalies added nearly 30% to the annual
from space have “clear potential to constrain carbon cycle feed- growth rate of CO2. That increase, sustained, would have major im-
back uncertainty.” Phillipe Ciais, at that same workshop (67), plications for mitigation. The anticipated global challenges and costs
amplified Friedlingstein’s comment by noting that to quantify of mitigation are high enough that reducing carbon-cycle–climate
carbon–climate feedbacks, it was essential “to characterize carbon feedback uncertainty will significantly aid in planning efficient and
flux anomalies at the spatial scale of climate anomalies,” scales effective action and reduce surprises that could disrupt agreements.
which surface networks simply cannot resolve, but for which space-
based methods are proving well suited (13). As satellite records Acknowledgments
lengthen the quality of data products improves; in addition, the D.S.S., B.M., J.L., and A.E. dedicate this paper to P.J.S., and acknowledge his
coverage from multiple missions (Table 1) further increases the inspiring leadership and the creative energy he brought to carbon science during
density of observations. As this happens, the utility of the satellite his recent tenure at Goddard Space Flight Center. During the early drafting of this
paper, the late P.J.S. left a voicemail about this paper: “Schimel, don’t be coy!”.
observations of NEE, GPP, ecosystem respiration, and biomass
We have endeavored to follow that exhortation. P.J.S. approached the challenge
burning for constraining global and longer-term carbon–climate of carbon science in the spirt of a favorite Churchill quote, “Difficulties mastered
feedbacks will increase. are opportunities won,” and he aimed to resolve the carbon–climate problem by
Satellite observations add a significant tool for capturing fluxes rising to the difficulties and seizing the opportunities. We thank the many in-
at crucial scales intermediate between the global and the local and person and remote participants in the NASA Carbon Cycle and Ecosystems Focus
Area workshop at the University of Oklahoma in March 2015. This research, carried
allowing the observation of the processes that link climate anom- out at the Jet Propulsion Laboratory, California Institute of Technology, was under
alies and carbon fluxes that affect the global budget. Satellites not a contract with the National Aeronautics and Space Administration, copyright
only add density of observations, but also deepen the ability of 2018 California Institute of Technology.
1 Marland G, Hamal K, Jonas M (2009) How uncertain are estimates of CO2 emissions? J Ind Ecol 13:4–7.
2 Moore B, Braswell B (1994) The lifetime of excess atmospheric carbon dioxide. Global Biogeochem Cycles 8:23–38.
3 Archer D, et al. (2009) Atmospheric lifetime of fossil fuel carbon dioxide. Annu Rev Earth Planet Sci 37:117–134.
4 Houghton R, et al. (1983) Changes in the carbon content of terrestrial biota and soils between 1860 and 1980: A net release of CO2 to the atmosphere. Ecol
Monogr 53:235–262.
5 Birdsey R, Pan Y (2015) Trends in management of the world’s forests and impacts on carbon stocks. For Ecol Manage 355:83–90.
6 Pan Y, et al. (2011) A large and persistent carbon sink in the world’s forests. Science 333:988–993.
7 Harris NL, et al. (2012) Baseline map of carbon emissions from deforestation in tropical regions. Science 336:1573–1576.
8 Jacob DJ, et al. (2016) Satellite observations of atmospheric methane and their value for quantifying methane emissions. Atmos Chem Phys 16:14371–14396.
9 Duren RM, Miller CE (2012) Measuring the carbon emissions of megacities. Nat Clim Chang 2:560–562.
10 Hakkarainen J, Ialongo I, Tamminen J (2016) Direct space‐based observations of anthropogenic CO2 emission areas from OCO‐2. Geophys Res Lett
43:11400–11406.
11 Schwandner FM, et al. (2017) Spaceborne detection of localized carbon dioxide sources. Science 358:eaam5782.
12 Bodman RW, Rayner PJ, Karoly DJ (2013) Uncertainty in temperature projections reduced using carbon cycle and climate observations. Nat Clim Chang
3:725–729.
13 Liu J, et al. (2017) Contrasting carbon cycle responses of the tropical continents to the 2015–2016 El Ni~no. Science 358:eaam5690.
14 Patra PK, et al. (2017) The orbiting carbon observatory (OCO-2) tracks 2-3 peta-gram increase in carbon release to the atmosphere during the 2014-2016 El Ni~
no.
Sci Rep 7:13567.
15 Schimel D, et al. (1997) Stabilization of Atmospheric Greenhouse Gases: Physical, Biological and Socio-Economic Implications (IPCC, Geneva).
Downloaded by guest on December 25, 2021
16 Meinshausen M, et al. (2009) Greenhouse-gas emission targets for limiting global warming to 2 °C. Nature 458:1158–1162.
17 Le Quéré C, et al. (2015) Global carbon budget 2015. Earth Syst Sci Data 7:349–396.
Sellers et al. PNAS | July 31, 2018 | vol. 115 | no. 31 | 786718 Raupach M, Canadell J, Quéré CL (2008) Anthropogenic and biophysical contributions to increasing atmospheric CO2 growth rate and airborne fraction.
Biogeosciences 5:1601–1613.
19 Woodwell GM, et al. (1998) Biotic feedbacks in the warming of the Earth. Clim Change 40:495–518.
20 Rigby M, et al. (2008) Renewed growth of atmospheric methane. Geophys Res Lett 35:L22805.
21 Heimann M (2011) Atmospheric science: Enigma of the recent methane budget. Nature 476:157–158.
22 Gloor M, et al. (2013) Intensification of the Amazon hydrological cycle over the last two decades. Geophys Res Lett 40:1729–1733.
23 Cox PM, et al. (2013) Sensitivity of tropical carbon to climate change constrained by carbon dioxide variability. Nature 494:341–344.
24 Hu H, et al. (2018) Toward global mapping of methane with TROPOMI: First results and intersatellite comparison to GOSAT. Geophys Res Lett 45:3682–3689.
25 Friedlingstein P, et al. (2006) Climate–carbon cycle feedback analysis: Results from the C4MIP model intercomparison. J Clim 19:3337–3353.
26 Friedlingstein P, et al. (2010) Update on CO2 emissions. Nat Geosci 3:811–812.
27 Lovenduski NS, Fay AR, McKinley GA (2015) Observing multidecadal trends in Southern Ocean CO2 uptake: What can we learn from an ocean model? Global
Biogeochem Cycles 29:416–426.
28 Körner C (2009) Responses of humid tropical trees to rising CO2. Annu Rev Ecol Evol Syst 40:61–79.
29 Schimel D, Stephens BB, Fisher JB (2015) Effect of increasing CO2 on the terrestrial carbon cycle. Proc Natl Acad Sci USA 112:436–441.
30 Van Halen E (1982) Diver Down (Warner Bros, Burbank, CA).
31 Le Quéré C, et al. (2016) Global carbon budget 2016. Earth Syst Sci Data 8:605–649.
32 Keenan TF, et al. (2016) Recent pause in the growth rate of atmospheric CO2 due to enhanced terrestrial carbon uptake. Nat Commun 7:13428.
33 Ballantyne A, et al. (2017) Accelerating net terrestrial carbon uptake during the warming hiatus due to reduced respiration. Nat Clim Chang 7:148–152.
34 Lucht W, et al. (2002) Climatic control of the high-latitude vegetation greening trend and Pinatubo effect. Science 296:1687–1689.
35 Piao S, Friedlingstein P, Ciais P, Zhou L, Chen A (2006) Effect of climate and CO2 changes on the greening of the Northern Hemisphere over the past two decades.
Geophys Res Lett 33:L13802.
36 Graven HD, et al. (2013) Enhanced seasonal exchange of CO2 by northern ecosystems since 1960. Science 341:1085–1089.
37 Bacastow RB, et al. (1980) Atmospheric carbon dioxide, the southern oscillation, and the weak 1975 El Nino. Science 210:66–68.
38 Rayner PJ, Law RM, Dargaville R (1999) The relationship between tropical CO2 fluxes and the El Ni~ no‐southern oscillation. Geophys Res Lett 26:493–496.
39 Feely RA, Wanninkhof R, Takahashi T, Tans P (1999) Influence of El Ni~ no on the equatorial Pacific contribution to atmospheric CO2 accumulation. Nature
398:597–601.
40 Chatterjee A, et al. (2017) Influence of El Ni~no on atmospheric CO2 over the tropical Pacific Ocean: Findings from NASA’s OCO-2 mission. Science
358:eaam5776.
41 Espinoza Villar JC, et al. (2009) Spatio‐temporal rainfall variability in the Amazon basin countries (Brazil, Peru, Bolivia, Colombia, and Ecuador). Int J Climatol
29:1574–1594.
42 Gatti LV, et al. (2014) Drought sensitivity of Amazonian carbon balance revealed by atmospheric measurements. Nature 506:76–80.
43 Poulter B, et al. (2014) Contribution of semi-arid ecosystems to interannual variability of the global carbon cycle. Nature 509:600–603.
44 Baker DF, Doney SC, Schimel DS (2006) Variational data assimilation for atmospheric CO2. Tellus B Chem Phys Meterol 58:359–365.
45 Frankenberg C, Butz A, Toon G (2011) Disentangling chlorophyll fluorescence from atmospheric scattering effects in O2 A‐band spectra of reflected sun‐light.
Geophys Res Lett 38:L03801.
46 Schimel D, et al. (2015) Observing terrestrial ecosystems and the carbon cycle from space. Glob Change Biol 21:1762–1776.
47 Baker DF (2001) Sources and sinks of atmospheric CO2 estimated from batch least-squares inversions of CO2 concentration measurements. PhD thesis (Princeton
University, Princeton).
48 Frankenberg C, et al. (2011) New global observations of the terrestrial carbon cycle from GOSAT: Patterns of plant fluorescence with gross primary productivity.
Geophys Res Lett 38:L17706.
49 Bowman K, et al. (2017) Global and Brazilian carbon response to El Ni~ no Modoki 2011–2010. Earth Space Sci 4:637–660.
50 Fung IY, Doney SC, Lindsay K, John J (2005) Evolution of carbon sinks in a changing climate. Proc Natl Acad Sci USA 102:11201–11206.
51 Kirschke S, et al. (2013) Three decades of global methane sources and sinks. Nat Geosci 6:813–823.
52 Dlugokencky E, et al. (2009) Observational constraints on recent increases in the atmospheric CH4 burden. Geophys Res Lett 36:L18803.
53 Schaefer H, et al. (2016) A 21st-century shift from fossil-fuel to biogenic methane emissions indicated by 13CH4. Science 352:80–84.
54 Bergamaschi P, et al. (2013) Atmospheric CH4 in the first decade of the 21st century: Inverse modeling analysis using SCIAMACHY satellite retrievals and NOAA
surface measurements. J Geophys Res D Atmospheres 118:7350–7369.
55 Franco B, et al. (2016) Evaluating ethane and methane emissions associated with the development of oil and natural gas extraction in North America. Environ Res
Lett 11:044010.
56 McNorton J, et al. (2016) Role of OH variability in the stalling of the global atmospheric CH4 growth rate from 1999 to 2006. Atmos Chem Phys 16:7943–7956.
57 Turner AJ, et al. (2016) A large increase in US methane emissions over the past decade inferred from satellite data and surface observations. Geophys Res Lett
43:2218–2224.
58 Enting I (2000) Constraints on the atmospheric carbon budget from spatial distributions of CO2. The Carbon Cycle, eds Wigley TML, Schimel DS (Cambridge Univ
Press, Cambridge, UK).
59 Wunch D, et al. (2011) A method for evaluating bias in global measurements of CO2 total columns from space. Atmos Chem Phys 11:12317–12337.
60 Crisp D, et al. (2004) The orbiting carbon observatory (OCO) mission. Adv Space Res 34:700–709.
61 Buis A (2018) GeoCarb: A new view of carbon over the Americas. NASA Earth. Available at https://www.nasa.gov/feature/jpl/geocarb-a-new-view-of-carbon-over-
the-americas. Accessed June 27, 2018.
62 Baker DF, Bösch H, Doney SC, O’Brien D, Schimel DS (2010) Carbon source/sink information provided by column CO2 measurements from the orbiting carbon
observatory. Atmos Chem Phys 10:4145–4165.
63 Kawa S, et al. (2010) Simulation studies for a space‐based CO2 lidar mission. Tellus B Chem Phys Meterol 62:759–769.
64 Bloom AA, et al. (2016) What are the greenhouse gas observing system requirements for reducing fundamental biogeochemical process uncertainty? Amazon
wetland CH 4 emissions as a case study. Atmos Chem Phys 16:15199–15218.
65 Charney J, Halem M, Jastrow R (1969) Use of incomplete historical data to infer the present state of the atmosphere. J Atmos Sci 26:1160–1163.
66 Ciais P, et al. (2010) Can we reconcile atmospheric estimates of the Northern terrestrial carbon sink with land-based accounting? Curr Opin Environ Sustain
2:225–230.
67 Schimel D, et al. (2016) Observing the carbon-climate system. arXiv:1604.02106. Preprint, posted April 7, 2016.
68 NOAA (2018) Cold & warm episodes by season. Available at www.cpc.noaa.gov/products/analysis_monitoring/ensostuff/ensoyears.shtml. Accessed June 27, 2018.
Downloaded by guest on December 25, 2021
7868 | www.pnas.org/cgi/doi/10.1073/pnas.1716613115 Sellers et al.You can also read