Zero-Carbon for Shipping - Sailing carbon-free along North America's west coast - Ocean Conservancy
←
→
Page content transcription
If your browser does not render page correctly, please read the page content below
Zero-Carbon
for Shipping
Sailing carbon-free along North America’s west coast
Authors
Olivia Carpenter-Lomax
Ricardo Energy & Environment
Guy Wilkinson
Ricardo Energy & Environment
Victor Martinez
Ricardo Energy & Environment
Martin Georgiev
Ricardo Energy & Environment

Citation
Carpenter-Lomax, O., Wilkinson, G., Martinez, V. and Georgiev, M, 'Zero-Carbon for Shipping; Sailing carbon-free along
North America's west coast', Ocean Conservancy, Washington D.C., 2021

Acknowledgements
The authors are grateful to the following people for sharing their comments, insights and expertise in the preparation of this
paper: Dan Hubbell, Lydia Nelson, Sandra Chiri, Whit Sheard, Aoife O’Leary, Bryan Comer, Dan Rutherford and Tristan Smith.

© Ocean Conservancy Inc. 2021. All rights reserved.

Who is Ocean Conservancy?                                          Ricardo Energy & Environment
Ocean Conservancy is working to protect the ocean                  At Ricardo Energy & Environment, our vision is to
from today’s greatest global challenges. Together with             create a world where everyone can live sustainably:
our partners, we create science-based solutions for a              breathing clean air, using clean energy, travelling
healthy ocean and the wildlife and communities that                sustainably, accessing clean water and conserving
depend on it.                                                      resources. Adopting renewable electrofuels for
                                                                   shipping would bring the world closer to these aims.
Ocean Conservancy’s shipping emissions campaign
focuses on targeted policy changes and science-based               Since the 1950s, we have worked to deliver improvements
solutions with the goal of reducing carbon emissions               in air quality, pioneered the use of renewable energy
and bolstering protections for the marine environment,             technology and worked on the development and
its living marine resources and the communities that               implementation of The Paris Agreement on Climate
are part of and dependent on ocean ecosystems.                     Change, helping countries and organizations to
                                                                   mitigate climate change by reducing greenhouse gas
                                                                   emissions. ee.ricardo.com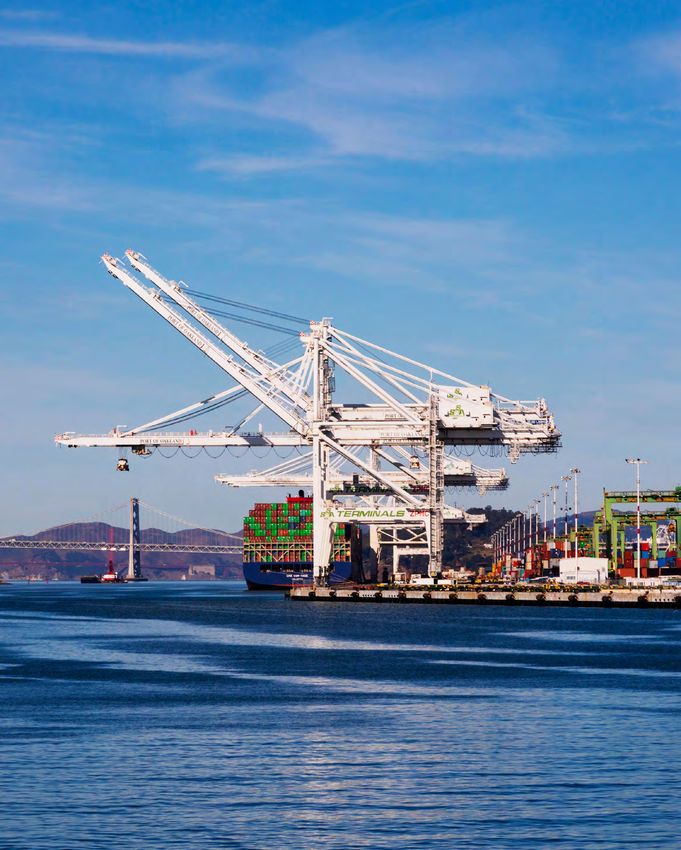
Contents
Executive summary 		1

Enabling a zero-carbon shipping lane on the North American
west coast can drive the shift towards a sustainable
shipping industry		4

Zero-carbon fuels can be made using renewable electricity
to decarbonize the shipping sector		                          5

Green electrofuels can be produced, handled, stored and
used safely		                                                 6

North America could kick-start the production and adoption of
electrofuels for shipping across the world		                  7

Ports on the west coast of North America are well suited to
adopt electrofuels and together could form a zero-carbon
shipping corridor		                                           8

Deploying renewable energy and zero-carbon
fuels infrastructure can enable electrofuel markets in
these five locations		10

North America has an abundance of renewable
energy potential that can be leveraged to support
zero-carbon fuel production		                                 12

Summary		13

Case Study: Port of Los Angeles		                             15

Case Study: Port of Oakland 		23

Case Study: Port of Tacoma		                                  31

Case Study: Port of Vancouver		                               39

Case Study: Port of Unalaska		                                47

References 		56

Appendices		59
Executive summary
The shipping sector presents a significant opportunity in the
transition from fossil fuels in North America. Often operating
out of sight and out of mind for the general public, the shipping
sector remains the backbone of the global supply chain.
It’s decarbonization presents some unique challenges including
long ship lifetimes, high energy demands and the consideration
of fuel infrastructure requirements in various regions. Yet the
solutions and scalable technological advancements that will
allow the sector to decarbonize have already been devised and
many are on the road to implementation.

Zero-carbon fuels have an important role to play in transitioning             Zero-carbon fuels have an
the shipping industry to a zero-carbon and emission free future,              important role to play in
alongside the adoption of improvements in vessel energy
consumption and operational efficiency.                                       transitioning the shipping
                                                                              industry to a zero-carbon
The west coast of North America is an important and valuable                  and emission free future.
route for the shipping industry. A significant proportion of the
trade between the United States, Canada, and Asia (especially
China and Japan) happens through or interacts with ports in this
route. Decarbonization of vessel traffic through this route would
therefore deliver tangible decarbonization benefits and could also
be a catalyst of wider decarbonization for the industry as a whole.

                                           OCEAN CONSERVANCY          |   1
This report explores the potential opportunity for five major ports on the west coast of North America, of adopting
zero-carbon electrofuels: green hydrogen and ammonia produced with renewable power with no associated
emissions from their production. Each Port has a considerable opportunity for adoption of zero-carbon electrofuels:
Los Angeles (California): Building on sustainability aspirations to decarbonize the busiest port in the
United States. Being able to offer zero-carbon fueling options to the huge numbers of vessels in the area could support
take-up of these fuels significantly.
Port of Oakland (California): Outstanding potential for renewable electricity generation can support a
green hydrogen economy beyond the shipping industry. Mixing renewable energy resources both near the port and
further afield can help decarbonize adjacent industries and rail operations in the future.
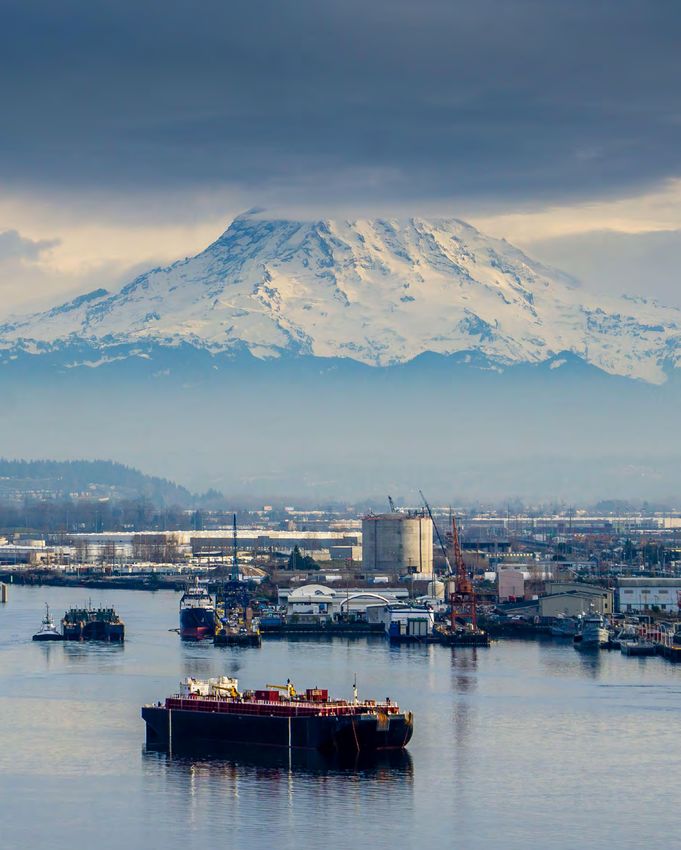
Port of Tacoma (Washington): Enabling electrofuel adoption while decarbonizing local passenger transport.
Zero-carbon power can be used to decarbonize local ships moving passengers and vehicles and produce electrofuels
to allow larger ships to switch fuels.
Port of Vancouver (British Columbia): Getting Canada’s largest port ready for a zero-carbon future.
Producing and supplying electrofuels can help fill the revenue gaps that fading coal imports will eventually leave behind.
Unalaska, Aleutian Islands (Alaska): Disruptive opportunities in a small and remote island.
The unique combination of untapped renewable energy resources and local needs can give birth to complete electrofuel
supply chains and even circular economies.
Together, these ports have the potential to form a zero-carbon shipping corridor up and down the west coast of
North America. This corridor would provide vessels with multiple refueling stops that would allow them to adopt
electrofuels without compromising their range. To take this step, vessels will need to be able to access these same
facilities and resources in their other regions of destination and are likely to require more frequent refueling than
fossil fuel-powered ships.
By developing and promoting zero-carbon fueling infrastructure along this route, there is a further opportunity
to drive the change across the shipping industry, leveraging the influence that these ports and the associated
stakeholders have. The characteristics and opportunities shown by these case studies could act as a blueprint for
other ports – both in North America and beyond.
ZERO-CARBON FOR SHIPPING | 2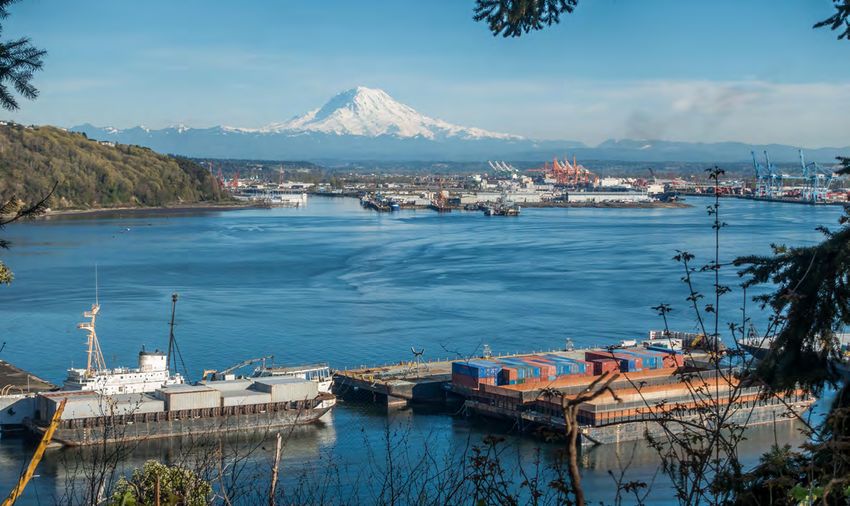
Adoption of zero-carbon shipping fuels such as hydrogen and ammonia can have benefits far beyond the shipping sector.
These spill-over benefits can benefit the community and region around the port, and the country beyond:

  Creating new and future proof          A commercial, competitive benefit       Lowering barriers for
  sources of income for local            in domestic and international           establishing renewables at scale
  economies by seizing the               markets which will increasingly         to provide general power supply
  opportunity to attract and service     demand zero-carbon shipping for         through economies of scale,
  a low-carbon shipping fleet.           products and materials.                 establishing supply chains and
                                                                                 developing capability and skills.

  Increasing opportunities to            Supporting the business case            Reducing reliance on fossil fuels
  deploy renewables at scale             for renewables through                  which not only brings carbon
  through economies of scale,            operating production infrastructure     benefits, but also a reduced
  establishing supply chains and         flexibly to use renewable               vulnerability to price shocks in
  developing local capability.           generation at peak times when it        the future.
                                         otherwise might be curtailed.

  Green hydrogen and ammonia             Real potential in job creation in       Potential to build investable
  can support decarbonization            the new renewable energy and            projects that attract funding from
  of other sectors, for example          zero-carbon fuels sectors, which        the private sector and increase
  being used in transport,               is an important aspect in a just        international climate funding.
  agriculture or industry.               transition.

                                          OCEAN CONSERVANCY            |     3
Enabling a zero-carbon shipping lane on the North
American west coast can drive the shift towards a
sustainable shipping industry
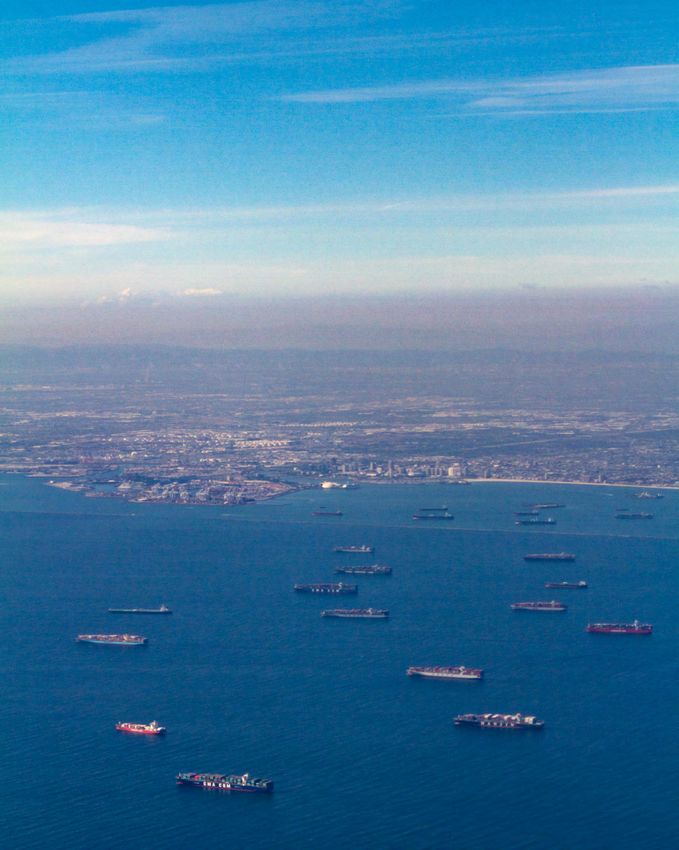
Global trade has seen sustained growth for decades and is expected to progressively increase as the world moves
past the effects of COVID-19 and lockdowns [1]. The shipping industry accounts for upwards of 90% of global trade
and continues to reap the benefits economically. Even during COVID-19 there were backlogs of ships anchored outside
of Ports along the west coast of North America, trying to keep up with consumer demand. The environmental cost of
this booming trade market is that the shipping industry is responsible for close to a billion tons of CO2e per year [2],
nearly the same emissions of Texas and California combined [3].
The International Maritime Organization (IMO) has set a target to reduce emissions by at least 50% by 2050 (relative
to 2008). The United States’ Climate Envoy John Kerry has also called for adopting a target of full decarbonization
for shipping in the same time frame, in line with the temperature goals of the Paris Agreement. These commitments
are good, but tangible action must follow to remain below a 1.5 degree global temperature rise. Given that shipping’s
GHG emissions have increased about 10% from 2012-2018 [4], reaching this reduced emissions goal is becoming an
increasing challenge for the industry. Electrofuels – fuels produced using renewables and that have zero emissions
through their lifecycle – can be part of the solution.
Local action can play a key role in overcoming these challenges, especially considering that domestic shipping emissions,
as the 4th Greenhouse Gases (GHG) study of the IMO revealed, are much higher than initially thought; making up to
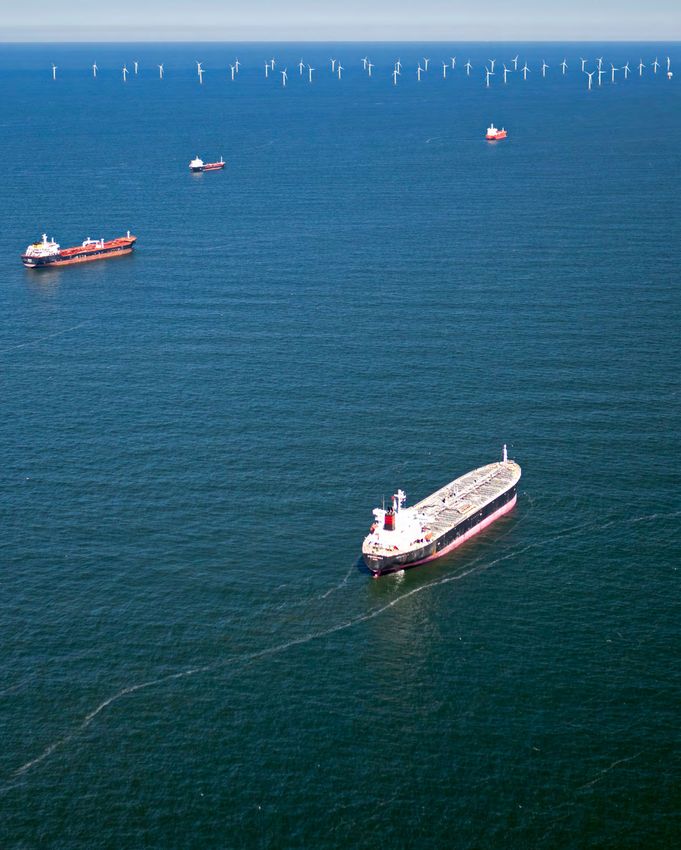
40% of yearly emissions for some vessels [4]. The recently announced commitments of the United States, which is seeking
to deploy 30 GW of offshore wind by the end of this decade in addition to their zero emission target for shipping by
2050 [5], can serve as a catalyst. This creates a unique opportunity for ports, local actors, and industry players to take
initiative and lead through action and example.
This report looks at the potential opportunity of adopting zero-carbon electrofuels in ports along the west coast of
North America. Together, these ports have the potential to form a zero-carbon shipping corridor on the west coast of
North America, enabling local zero-carbon shipping routes and bunkering for zero-carbon vessels headed further afield.
This would not only reduce shipping emissions significantly but would pave the way and serve as a blueprint for future
initiatives, helping to drive the global industry towards a zero emissions future.
This report is the second in the Ocean Conservancy’s report series Zero-Carbon for Shipping, a sequel to Zero-Carbon
for Shipping: Propelling investment in South and Central America with hydrogen-based shipping fuels [1]. This series
was created as a natural progression from the previous works by Ocean Conservancy, Environmental Defense Fund
(EDF) and GtZ, including Sailing on Solar – Could green ammonia decarbonize international shipping? [2] Electrofuels
for shipping: How synthetic fuels from renewable electricity could unlock sustainable investment in countries like Chile
[3] and South Africa: fueling the future of shipping, South Africa’s role in the transformation of global shipping through
green hydrogen-derived fuels [4]. Other related work in this area includes the ICCT study "Liquid hydrogen refueling
infrastructure to support a zero-emission U.S.–China container shipping corridor [5]"
ZERO-CARBON FOR SHIPPING | 4
Zero-carbon fuels can be made using renewable
electricity to decarbonize the shipping sector

Carbon-containing electrofuels
 Carbon-containing electrofuels (such as e-diesel and e-methanol) require carbon dioxide as an input. This needs to
 be extracted from an external source (air, seawater or biomass) for the fuel to be carbon-neutral over its lifecycle
 because the carbon dioxide ultimately returns to the atmosphere when the fuel is burned. Direct air capture is a
 technology that requires significant amounts of electricity and is not currently commercially available at the scale
 required to produce shipping fuels.

Blue hydrogen-based fuels derived from fossil sources
 Currently, the most common method of producing hydrogen is through a process known as steam methane
 reforming (SMR), with fossil fuels used as the main input. Hydrogen produced in this way, coupled with carbon
 capture and storage (CCS), is known as ‘blue hydrogen’ and can be combined with other molecules to produce a
 range of blue fuels. CCS is required to capture carbon dioxide created in the process of producing the hydrogen.
 Blue hydrogen is considered low carbon, but not zero emissions, as CCS is not able to capture and store 100%
 of the carbon emissions. There are also greenhouse gas emissions associated with the process of extracting,
 transporting and storing the required fossil fuel.

Fuels derived from biomass
 Fuels derived from biomass sources are often considered carbon-neutral because the carbon they release when
 burned was absorbed from the air as they grow. However, converting fertile land to grow biomass crops can be
 problematic and unsustainable especially if it replaces food production or natural habitats. Diverting existing crops
 to fuel production, moreover, can trigger new GHG emissions from tropical deforestation (indirect land-use change)
 by raising the price of agricultural commodities [6]. Biofuels can also be produced from waste products, however
 location of these resources and distribution adds an element of complexity to its production.

Why green hydrogen and green ammonia were chosen for this report
Green hydrogen and ammonia do not contain carbon and do not emit carbon dioxide or black carbon at any point
in their lifecycle (as they are produced using renewable electricity). If the Nitrogen used for producing ammonia
is extracted from the environment, the total net Nitrogen emissions released from using the fuel would be zero.
This report focuses on green hydrogen and green ammonia because the USA is in a good position to capitalize on
its abundant renewable electricity potential to produce them at industrial scale.
As this report shows, development of infrastructure to produce green hydrogen and green ammonia will increase
demand for renewable electricity plants, strengthen supply chains, create clean jobs and reduce costs of renewable
technologies in the region. Electrofuel production, however, should not compete with the power grid for renewable
resources. Renewable power requirements for electrofuel production should be installed over and above what is
required to decarbonize the electricity mix, including industrial and agricultural applications.

                                           OCEAN CONSERVANCY             |   5
Green electrofuels can be produced, handled, stored
and used safely
Like all fuels, there are safety risks and handling requirements associated with the use of green hydrogen and ammonia.
This will need to be addressed by the industry moving forward. However, this should not be seen as a major barrier for
adoption of these fuels; fuels used today are subject to codes, best practices and standards that have been developed
over years of expertise, which have allowed them to be used widely and safely in a variety of applications, environments,
and conditions [7]. The same can be done for electrofuels.

The main risks associated with both electrofuels and the most commonly used fuels in the shipping industry are
summarized below [8]:

          Marine                                                         Green                           Green
                                            LNG
          gas oil                                                       hydrogen                        ammonia

                                        Explosive and               Extremely flammable                  Flammable
         Extremely
                                         extremely                     (invisible flame)                and explosive
         flammable
                                         flammable                      and explosive                (when compressed)

                                                                           Risk of                    Toxic to humans
          Toxic to                        Risk of
                                                                       cryogenic burns                   and aquatic
         aquatic life                 cryogenic burns
                                                                          (if liquid)                   environments

Hydrogen has been used for decades in chemical refining, oil rigs, ammonia production and even spaceship propulsion.
Ammonia is already an important chemical used readily as a key ingredient in the nitrogen fertilizer for agriculture,
and for this reason the USA is one of the world’s leading producers and consumers of ammonia. In 2020, the US was
estimated to have produced 14 million metric tons of ammonia [9].

To support this activity, the American National Standards Institute already have regulations for the handling, transfer and
transport of ammonia. Further guidelines are provided for the design, construction, repair, alteration, location, installation
and operation of ammonia systems in the USA [10]. Similarly, Fertilizer Canada have the Ammonia Code of Practice for
ammonia distribution, storage and handling of ammonia to ensure safety and security [11].

Addressing safety will be a necessary step in adopting electrofuels, yet it should not stifle efforts to both continue to
advance their adoption or to simultaneously continue implementing a variety of other decarbonization options, such as
energy efficiency, optimization of operational practices and electrification. Successfully meeting the decarbonization
challenge for the industry will call for timely and sustained action from the industry on multiple fronts.

                                        ZERO-CARBON FOR SHIPPING                 |   6
North America could kick-start the production and
adoption of electrofuels for shipping across the world
The United States and Canada are key trading partners for major economies around the world. Its west coast serves as the
cornerstone for its vast trade with Asia (mainly China and Japan). Its high traffic density and trading volumes, coupled with
its vast resources and expertise, can make the region an important piece in the decarbonization of the shipping industry.

Political momentum also adds to the potential key role that the region can play, putting North America in a good position to
become a pioneer in shipping decarbonization. The United States government has also sent strong signals in this regard,
as they announced recently that they will be working with the IMO, and taking domestic actions, to reach zero emissions for
international shipping by 2050 – a major step up from the current 50% reduction target. This could be an important turning
point and could provide significant momentum to the growing efforts of adopting electrofuels in the shipping industry.

Supplying these electrofuels and deploying the renewable capacity needed to produce them, would also allow the local
economy to leverage on its competitive advantages and expertise to seize additional benefits:

Creating new and future-proof sources of income for local economies: Current reliance on fossil fuels is forecast to
decline, which is a risk to the communities and economies that rely on these industries. Zero-carbon fuels can provide
an alternative, future-proofed industry, and can be leveraged to attract and service a low-carbon shipping fleet, securing
a market for the future.

A commercial, competitive benefit in domestic and international markets: Businesses and their customers will
increasingly demand zero-carbon shipping for products and materials. Being able to offer new zero-carbon fuels for
commercial vessels will provide a competitive advantage for the goods traded through these ports.

Increasing opportunities to deploy renewables at scale: Significant volumes of renewable electricity generation
infrastructure will be required to supply the production of zero-carbon electrofuels. This could reduce practical, financial
and political barriers for the wider adoption of renewable technologies, through economies of scale, establishing supply
chains and developing local capabilities and acceptance.

Supporting business cases for renewables: Zero-carbon electrofuels production can provide a reliable, flexible and
valuable use for renewable generation, supporting the business case for its development. At peak generation times,
renewable generation that might otherwise be curtailed, could be used to produce zero-carbon electrofuels.

Reducing reliance on fossil fuels: Adopting zero-carbon electro fuels not only brings carbon benefits, but also a
reduced vulnerability to price shocks in the future from fossil fuels which are imported to the port.

Decarbonisation and synergies with other industries: Green hydrogen and ammonia can support decarbonization of
other sectors. For example, hydrogen can be used as a part of low carbon steel production, green ammonia can be used in
agriculture, and zero-carbon fuels can be used in heavy transport or machinery. This means that the development of
a zero-carbon fuel sector around these ports could also provide opportunities for decarbonization in other sectors.

Real potential in job creation: There is the potential for the creation of a wide range of jobs created the new renewable
energy and zero-carbon fuels sectors. This is an important aspect in a just transition that positively impacts not only the
environment and delivers social and economic benefits for communities and local economies.

Potential to build investable projects: There is the opportunity to build project that are economically attractive and that
can attract funding from the private sector and increase international climate funding.

                                             OCEAN CONSERVANCY              |   7
Ports on the west coast of North America are well
suited to adopt electrofuels and together could form
a zero-carbon shipping corridor
Noting North America’s advantageous position and the strategic opportunity to drive shipping decarbonization, this study
focuses on five representative ports along the west coast of the region, and shows how they could become the building
blocks of a zero-carbon shipping route that stretches from the south of the United States to the Bering Sea. Together, these
ports accounted for over 300 billion US dollars of trade in 2018.
With the high traffic experienced in this route and the resources and opportunities identified, there is a clear and tangible
opportunity to achieve significant decarbonization by producing and supplying electrofuels in these ports. These locations, or
others like them, could position themselves at the forefront of the electrofuel economy, helping build a path for decarbonizing
the rest of the industry, while capitalizing on the significant spill-over benefits that this could unlock for its local economies.
VALUE TRADED WITH MAIN PARTNERS
180 FOR THE FIVE CASE STUDY PORTS
(BILLION USD)
160
140
120
Billion USD
100
80
60
40
20
0
China Japan Vietnam Taiwan South Korea
Source: [12] – Excludes Unalaska (no information available)
ZERO-CARBON FOR SHIPPING | 8Mexico
Unalaska:
Located in a remote island
in Alaska, the Unalaska Port
serves as an operation center
for commercial fishing in the Unalaska
Bering Sea and is a major oil Alaska
transshipping point [13].
Vancouver: GULF OF ALASKA
The largest port in Canada in
terms of tons of cargo [15].
Already deploying infrastructure
for alternative fuels that,
coupled with local resource and
environmental incentives, could
also pave the way for supplying
electrofuels.
Tacoma:
Emissions from the local grid
are low [14] and opportunities
for decarbonizing the fleet that
the port serves are abundant.
Oakland: British
Ambitious environmental plans Columbia
and abundant local resources
Alberta
mean that the port is well placed
for producing, supplying, and PACIFIC OCEAN
using electrofuels.
Washington
Montana
Oregon
LA/Long Beach: Idaho
Busiest port of the United Wyoming
States [12] and a pioneer in Nevada
decarbonization, with efficiency, California
Utah
Colarado
electrification and even
hydrogen initiatives already in
Arizona
place.
OCEAN CONSERVANCY | 9Deploying renewable energy and zero-carbon
fuels infrastructure can enable electrofuel markets in
these five locations
The five case study ports included in this report serve a high volume of a wide variety of ships. Decarbonizing at least
a fraction of this traffic could significantly reduce emissions from shipping traffic, and could be the first step towards driving
the widespread deployment of electrofuel production capacity and infrastructure for domestic and international ports.
Local economies around these ports could benefit from the development of a zero-carbon fuels sector, as they would be supplying
a significant volume of electrofuels to these ships, and benefitting from the associated trade. The demand for zero-carbon
fuels may start modest, but it is likely to progressively increase through to 2050 as more and more zero-carbon vessels are adopted.
DEPARTING SHIPS AT EACH PORT
Fishing Bulk carriers Containers Tankers People and Offshore and
7000 vehicle carriers services
6000
Millions of vessels
5000
4000
3000
2000
1000
0
Port of Los Angeles/ Port of Oakland Port of Tacoma Port of Vancouver Unalaska
Long Beach
Vessel categories are defined in Appendix 1
ZERO-CARBON FOR SHIPPING | 10The significant expertise and wide collaboration networks found in these ports, coupled with the high renewable resource
potential in the region, could become key strategic advantages that allow them to seize the opportunity, create these markets
and position themselves as its centerpieces.
The total fuel energy demand for vessels visiting all five case study ports is 188.5 TWh per year. However, the adoption
of zero-carbon fuels by shipping vessels will be gradual over time. If fuel demand for 5% of international shipping and 15%
of domestic shipping is met by zero-carbon fuels by 2030 (see call out box below), the aggregated fuel energy demand from
these ports is estimated to be 37.6 TWh per year.
This demand would then grow over time as adoption increases, supported by technological advancements, additional
political momentum or stronger regulations and incentives. This will add to the size of this potential opportunity for ports to
establish future-proof and truly sustainable sources of income.
FUEL ENERGY DEMAND OF WEST COAST PORTS BY INTERNATIONAL AND
DOMESTIC DEPARTURES
70
Domestic departures International departures
60
Fuel energy demand TWh/year
50
40
30
20
10
0
Port of Los Angeles/ Port of Oakland Port of Tacoma Port of Vancouver Unalaska
Long Beach
Adoption assumptions for international and domestic vessels
Zero-carbon fuel adoption of 5% by international shipping and 15% by domestic shipping by 2030 is used as
a representative example of a 2030 adoption for the purposes of providing context for this report, and is not
intended to be a forecast of actual adoption. The 5% adoption by international vessels aligns with work done by
the Global Maritime forum [14]. For domestic vessels, it can be expected that adoption of zero-carbon fuels will
be easier due to shorter journeys requiring less energy per journey, consistent policy and standards to support
and incentivize adoption, and the potential availability of zero-carbon fuels across the different case study ports
and beyond. A 15% adoption rate was selected for domestic vessels. The methodology used to estimate
electrofuel and renewable energy requirements is presented in Appendix 2.
OCEAN CONSERVANCY | 11North America has an abundance of renewable
energy potential that can be leveraged to support
zero-carbon fuel production
The development of renewable energy infrastructure to provide zero-carbon fuels must be considered in addition to that
needed to decarbonize the domestic demand.
The United States total electrical consumption is nearly 4,000 The United States
TWh per year (2019) [16]. It is estimated that supplying 100% of America has
of the vessels visiting the case study ports in the U.S. with
hydrogen would require the 206 TWh per year of renewable
an estimated
325,000
electricity, and if ammonia was used, renewable electricity
requirement would be 308 TWh per year (see Appendix 2 for
TWh per year
calculation methodologies used for these values).
A report published by National Renewable Energy Laboratory
(NREL) in 2020 [13] predicts that the United States holds
more than 325,000 TWh per year of technical renewable of technical renewable energy
energy potential. This figure includes achievable generation potential [15].
considering technology performance, topography limitations
and environmental and land-use constraints, but not
considering economic feasibility. While feasible potential will
be considerably lower than this total, this value indicates the
significant scale of the renewable energy potential covering
Which compares to an
solar, offshore and onshore wind, geothermal and hydropower. electricity grid consumption
of nearly
In Canada it is a similar story; in total Canada consumes nearly
4,000
550 TWh per year of electricity (2019) [17]. In order to supply
the vessels visiting the Port of Vancouver, Canada’s largest
TWh per year
port, with hydrogen fuel would require an estimated 61 TWh per
year of renewable electricity, or 96 TWh per year to supply the
vessels with ammonia.
It is estimated that Canada holds a total of over 3,000
TWh per year of feasible renewable energy potential [18].
Feasible potential considers physical constraints and economic This suggests ample
limitations for renewable development.
renewable energy potential
This shows that production of zero-carbon fuels for shipping to produce green hydrogen
will not constrain renewables for other supply. and ammonia for shipping.
ZERO-CARBON FOR SHIPPING | 12Summary
Decarbonization of the shipping sector is essential in the face of the ongoing impacts of climate change.
Establishing a zero-carbon shipping lane along the west coast of North America would simultaneously
reduce emissions from the multitude of vessels transiting that route and potentially be influential in driving
decarbonization of the shipping industry in other ports and regions.
Many of these ports are already in the process of considering or adopting sustainability and decarbonization
strategies, which creates a fertile environment in which zero-carbon fuel adoption can flourish. Meeting
the ambition outlined in this report would call for even stronger efforts and closer collaborations between
stakeholders. The continued momentum can be supported by appropriate market signals and incentives
which will help drive zero-carbon fuel adoption - resulting in the realization of all the environmental and
economic benefits they have to offer.
Taking local initiative in these ports can establish a strong reference for future projects both locally and
abroad. If zero-carbon fuels can be deployed in very busy ports such as the port of Los Angeles; as well as
very remote ones like the port of Unalaska; then opportunities for wider deployment worldwide are abundant
and could set the shipping industry well on track to meet its current and future decarbonization goals.
Establishing zero-carbon fuel markets in these ports and others like them can nurture and future-proof
local economies. Ports included in this study, just as many others around the world, could see their activity
impacted by market shifts due to climate change. Production and supply of green zero-carbon fuels could
provide them with new and stable sources of income from exporting and selling fuels, promote knowledge
transfer, create green jobs, and support decarbonization of the wider economy.
OCEAN CONSERVANCY | 13ZERO-CARBON FOR SHIPPING | 14
Case Study: Port of Los Angeles
Building on sustainability aspirations to
decarbonize the busiest port in the United States

                   OCEAN CONSERVANCY   |   15
The Port of Los Angeles has ambitious goals and
activities towards more sustainable practices
Located on the south western coast of the United States, the Port of Los Angeles is the busiest port in the country and
moved over 9.2 million twenty-foot equivalent units (MTEUs) and over 250 billion US dollars in cargo value in 2020 [19].
The Port is surrounded by dense urban areas with extensive industrial, power and rail infrastructure. Despite limited
available space, there are ten solar photovoltaic (PV) plants in the vicinity of the port.
The port is a leader in decarbonization measures of both its own operations and the fleet it serves. It currently has
79 shore power stations, the most of any port in the world [20]. These stations allow ships to run their equipment on
electricity rather than diesel power while at berth, reducing noise and pollution [21]. Through various initiatives, the port
has already reduced particulate matter emissions from port operations by over 85%, and nitrogen and sulfur oxides
emissions by 50% and 95% respectively (relative to 2005-levels) [22].
Collaborative efforts like the World Port Climate Action Program and the Port of Long Beach’s Green Port Policy, as
well as international research and development collaborations [20] [23] have been instrumental in driving this change.
These programs have helped implement energy efficiency and propulsion electrification, decarbonize cargo-handling
operations, deploy renewables locally, and even support the adoption of sustainable low-carbon fuels by establishing
green terminals. They have a platform to educate and engage with local communities as they launch improvements for
the benefit of public health and the environment [24] [25]. Despite this, the Port of Los Angeles is still one of the largest
sources of air pollutants in LA and further work is required to reduce emissions further.
Transitioning to zero-carbon fuels would be a complex undertaking for the port, but the high level of vessel traffic means
that there is an equally rich opportunity to support new zero-carbon vessels as they are adopted. The Port of Los Angeles
would be ideal to serve as a blueprint showing that it is feasible for a busy, urban port to transition into a zero-carbon
future. Inaction, on the other hand, has a steep cost both to human health and could result in other ports becoming the
refueling point for zero-carbon fuel powered ships, representing a major opportunity cost for ports that stay behind.
ZERO-CARBON FOR SHIPPING | 16The Port of Los Angeles is the busiest in North
America, serving a wide variety of ships
LOS ANGELES'
TOP 5 EXPORT
LOS ANGELES'
COMMODITIES
TOP 5 IMPORT
International trade COMMODITIES
(Percentage of Cargo Pet/Animal Feed
Handled) Furniture Paper/Wastepaper
1. Northeast Asia: 72%
2. Southeast Asia: 21%
Auto Parts Soybeans
3. Indian sub-continent: 2% Apparel Scrap Metal
4. Middle East: 1%
Electronics Fabrics/Raw Cotton
Plastics
Source: [18]
The main goods arriving at the Port of Los Angeles BREAKDOWN OF ENERGY USAGE BY
(by volume) are furniture, automobile parts and VESSELS DEPARTING THE PORT OF
clothes, while most of the exports are made up of LOS ANGELES [60]
paper, animal feed and fabric. Almost half (44%) of
16 TWh
the traded value corresponds to trade with China and
Hong Kong, followed by Japan with 13%.
These figures highlight how important Asian trade is for Domestic
the port’s activities. This means that for the successful
adoption of zero-carbon fuels in this port by international
trade vessels, ships would also depend on the availability
of zero-carbon fuel supply and infrastructure in various
ports in Asia. Some nations are already on their way
to making this happen; Japan and China are already
investing in hydrogen as a shipping fuel.
46 TWh Calculated energy from voyages
departing Port of Los Angeles
International based on AIS data from 2018 [26]
OCEAN CONSERVANCY | 17The most common vessel type visiting the Port of Los Angeles is container vessels. The charts below demonstrate
the traffic and energy usage of vessels departing the Port of Los Angeles by vessel type.
Domestic container ships are the most common vessels departing the port; however, the highest energy usage is container
ships on international voyages. This implies that vessels on domestic voyages are making a higher number of small
journeys while international departures are making long voyages that use more fuel per journey, likely across the Pacific.
Domestic departures International departures
NUMBER OF VESSELS DEPARTING THE PORT OF LOS ANGELES
IN 2018 BY VESSEL CATEGORY [26]
537 2,063 1,020 602
Bulk carriers Container Tankers People and vehicle
918
Offshore and
37
Fishing
ships carriers services
3000
Number of vessels
2000
1000
0
Bulk carriers Containers Tankers People and vehicle Offshore Fishing
carriers and services
ENERGY USAGE OF VESSELS DEPARTING THE PORT OF LOS ANGELES
IN 2018 BY VESSEL CATEGORY [26]
Fuel energy demand, TWh/year
40.0
30.0
20.0
10.0
0
Bulk carriers Containers Tankers People and vehicle Offshore Fishing
carriers and services
See appendix 1 for vessel category definitions. Energy calculations based on AIS data from 2018
ZERO-CARBON FOR SHIPPING | 18The production of zero-carbon fuels can be
supported by renewable energy resources offshore
and further inland from the port
There is significant potential for renewable electricity generation in the state of California and nearby areas, including
strong resource for wind, solar and potentially viable geothermal energy. The area immediately adjacent to the Port of
Los Angeles is a built up open area with limited land available for wind or solar generation. Coupled with the high price
of land it means onshore generation will have to be some distance from the port. However, there is promising offshore
wind resource not far from the coastline, and recent government announcements provide optimism towards the
feasibility of deploying offshore wind assets both in this port and other areas in the United States.
SOLAR ELECTRICITY GENERATION POTENTIAL AROUND LOS ANGELES
San Francisco
San Jose
Las Vegas
Los Angeles
Phoenix
Port of Los Angeles
San Diego
Tijuana Mexicali
Solar PV electricity Long-term average of photovolaic power potential (PVOUT)
generation potential Daily totals: 2.0 2.4 2.8 3.2 3.6 4.0 4.4 4.8 5.2 5.6 6.0 6.4
from SolarGIS.com kWh/kWp
Yearly totals: 730 876 1022 1168 1314 1461 1607 1753 1899 2045 2191 2337
used with permission
WIND ELECTRICITY GENERATION POTENTIAL AROUND LOS ANGELES
m/s
10+
Port of Los Angeles
Mean wind speeds at
100 m hub height from
GlobalWindAtlas.info used
with permission [27]
0
This potential could be leveraged to support the production of zero-carbon fuels. Where the renewable generation
infrastructure is located a distance away from the production facilities, the wider grid could be used to deliver
renewable electricity, potentially through private supply relationships between the generator, the production facility and
the network operator. The benefit of situating renewable capacity away from the port will mean fewer constraints as to
where generation can be sited, meaning that locations can be found that have high energy potential and avoid land use
issues. Land used for renewable generation can also be used for other purposes, for example land used for wind farms
can still be used for crops, and land used for solar farms can be shared with grazing livestock.
OCEAN CONSERVANCY | 19The infrastructure needed for the adoption of zero-carbon
fuels up to 2030 can be scaled to the demand
The scale of the demand for zero-carbon fuels will depend on the speed of technology adoption. To provide a view
of scale, a representative 2030 adoption case is used, which assumes that zero-carbon fuel is adopted by 5% of
international vessels and 15% of domestic vessels. This assumption is used for the purposes of providing context for
this report, and is not intended to be a forecast of actual adoption. The methodology used to estimate zero-carbon
fuel and renewable energy requirements is presented in Appendix 2.
This case shows the renewable electricity generation requirements to produce sufficient green hydrogen or ammonia to
meet the fuel demand of the port of Los Angeles. The calculations for these figures takes into account the efficiencies
and losses of converting renewable electricity into zero-carbon fuel, and then using that fuel in the vessel.
RENEWABLE ENERGY REQUIRED TO MEET THE ZERO-CARBON FUEL
DEMAND IN THE 2030 ADOPTION CASE
Domestic departures International departures
12
10
Renewable energy requirement, TWh/year
8
6
4
2
0
Hydrogen Ammonia
ZERO-CARBON FOR SHIPPING | 20To meet the fueling demands of the representative 2030 adoption case through green hydrogen fuel, 6.7 TWh per year
of renewable electricity would be required. To meet the demand with green ammonia, 10 TWh per year of renewable
energy would be needed. It is possible that green hydrogen and green ammonia will be used in parallel, each being
used for the vessel types and use cases to which they are best suited. This means that the actual renewable generation
requirement will be somewhere between these figures.
The renewable electricity generation infrastructure that is required to meet these renewable electricity needs could
be met through a variety of ways, for example, if all the capability was provided through solar, 3.7 GWp to 5.5 GWp
of installed generation capacity would be required. If the needs are met through wind power, 2.2 GWp to 3.2 GWp of
installed onshore wind generation capacity is needed, or 1.2 GWp to 2.1 GWp of offshore wind.
Hydrogen Ammonia
PRODUCING ENOUGH FOR THE PRODUCING ENOUGH FOR THE
2030 ADOPTION CASE 2030 ADOPTION CASE
Installed generation Installed generation
capacity needed capacity needed
3.7 GW 5.5 GW
Solar Solar
or or
2.2 GW 3.2 GW
Onshore wind Onshore wind
or or
1.2 GW 2.1 GW
Offshore wind Offshore wind
THE SPACE NEEDED TO BUILD THIS INFRASTRUCTURE DEPENDS ON THE TECHNOLOGY:
1 GW of solar generation 1 GW of onshore wind generation 1 GW of offshore wind generation
infrastructure would cover about infrastructure would require about infrastructure would require
3,000 football fields 64,000 football fields of land about 26,000 football fields of
ocean space
But this space could also be used to But this land can also be used for
graze livestock growing crops and other agriculture
OCEAN CONSERVANCY | 21The Port of Los Angeles can build on the momentum
of sustainable activity and available renewable
resources to create a sustainable economy
The Port of Los Angeles is part of the World Ports Climate Action Program (WPCAP). The WPCAP includes 12 of the
world’s top leading ports and has implemented multiple initiatives thanks to international collaborations which include
ports in Mexico, China and even the Panama Canal [28]. There is an opportunity here to leverage on the capacities and
proactiveness that these actors and collaborative initiatives bring to not only drive the transition of this port, but also
many others in the region and abroad.
This has driven the deployment of extensive sustainable infrastructure, including shore power stations, electric cargo
handling equipment, both electric and fuel cell-powered trucks, and research towards the development of the world’s first
hydrogen-powered tugboat [29] [30]. Cargo handling equipment at the port is expected to reach net zero by 2030 and the
drayage truck fleet is expected to reach it by 2035.
This ongoing momentum can be an asset for deploying zero-carbon fuels at the port and renewables either at the port
or further inland, and to decarbonize the shipping fleet. There is an opportunity to build on the enormous sustainability
ambitions of the actors involved in these initiatives and networks to decarbonize the busiest port in all the United States.
Driving the creation of green jobs for a just energy transition
that not only safeguards the environment but also delivers
social and economic benefits
With the energy transition underway and the current push for decarbonization commitments and regulation in
the United States, the challenge of maintaining jobs and creating new future-proof capabilities is at the top of
mind of industry leaders and policymakers.
Opportunities like these can become a platform for transferring skills and create opportunities for the existing
workforce to be ready for the shift in demand towards green jobs and sustainability-related skills, all while
decarbonizing the busiest port in the United States.
ZERO-CARBON FOR SHIPPING | 22Case Study: Port of Oakland
Outstanding potential for renewable electricity
generation can support a green hydrogen economy
beyond the shipping industry
OCEAN CONSERVANCY | 23The port’s proactive approach to sustainability and
local resources can be a winning combination
The Port of Oakland is located in San Francisco in Northern California and is the 8th busiest port in the United States
with over 2.5 million TEUs moved through it annually [31]. The port is in the Bay of San Francisco and is surrounded by a
dense urban area, beyond which lies a mountainous area with a series of regional parks and preserves.
The Port of Oakland prides itself in its commitment to environmental stewardship. The measures that the port
incorporates are wide ranging and focus on air quality, climate change impact, water pollution, habitat restoration and
the local community [32]. Shore power is an example of an initiative with a significant impact. In 2019, 80% of the
1,419 vessel calls plugged into Shore power, thus cutting completely their emissions from auxiliary diesel engines [33].
Another example is the overall diesel emissions associated with port activities which have been reduced by 70%
between 2005 and 2012 [32]. These reductions have helped to address environmental justice concerns in Oakland,
adoption of zero-carbon fuels will aid this advancement further.
The ambitious net zero target in California, coupled with the excellent renewable energy resources and relatively clean
grid energy, present an opportunity for the port. The path to decarbonizing shipping likely lies in hydrogen and
hydrogen-derived fuels such as ammonia and the excellent renewable energy potential could help the port position
itself at the heart of this transition.
ZERO-CARBON FOR SHIPPING | 24Container ships and tankers are by far the largest fuel
consumers at the Port of Oakland
OAKLAND'S
TOP 5 EXPORT
OAKLAND'S
COMMODITIES
International trade TOP 5 IMPORT
COMMODITIES
(Percentage of Cargo Wood pulp
Handled)
Furniture Fruits & nuts
1. Asia: 76%
2. Europe: 14% Packaging Meat & fish
3. Hawaii: 5%
4. Australia: 3% Glass & glassware Beverages & spirits
5. Other: 2% Machinery Grains & seeds
Electrical machinery
Source: [29]
Contrasting to an extent with the number of vessels, BREAKDOWN OF ENERGY USAGE BY
the total energy requirements of the different types VESSELS DEPARTING THE PORT OF
of vessels shows that container ships are the largest OAKLAND [26]
energy consumers, accounting for over 80% of the
8 TWh
energy consumption, mostly aimed at international
shipping. Energy usage is calculated from the energy
use by all departing international and domestic voyages
to their destination. Domestic
This paints an optimistic picture for zero-carbon
fuel adoption, as fewer vessels would need to
be converted, and each conversion would shift a
significant amount of demand away from fossil fuels
and into the renewable energy space.
56 TWh Calculated energy from voyages
departing Port of Oakland based
International on AIS data from 2018 [26]
OCEAN CONSERVANCY | 25The charts below demonstrate the traffic and energy usage of vessels departing the Port of Oakland by vessel type.
Domestic offshore and services vessels are the most common vessels departing the port; this may include servicing
for offshore platforms, tugs and bunker vessels among others. However, by far the highest energy usage is by container
ships on international voyages. This implies that domestic offshore and services vessels have short journeys and
significantly lower energy requirement per journey than international container vessels.
Domestic departures International departures
NUMBER OF VESSELS DEPARTING THE PORT OF OAKLAND
IN 2018 BY VESSEL CATEGORY [26]
170 1,523 445
Bulk carriers Container Tankers
516 1,859
People and vehicle Offshore and
35
Fishing
ships carriers services
2000
Number of vessels
1500
1000
500
0
Bulk carriers Containers Tankers People and vehicle Offshore Fishing
carriers and services
ENERGY USAGE OF VESSELS DEPARTING THE PORT OF OAKLAND
IN 2018 BY VESSEL CATEGORY [26]
60.0
Fuel energy demand, TWh/year
50.0
40.0
30.0
20.0
10.0
0
Bulk carriers Containers Tankers People and vehicle Offshore Fishing
carriers and services
See appendix 1 for vessel category definitions. Energy calculations based on AIS data from 2018
ZERO-CARBON FOR SHIPPING | 26Offshore wind and PV could be used to produce
zero-carbon fuels
California is renowned for its excellent solar resource. While the solar irradiance in Northern California is not as high as in
the south of the state, the area around Oakland boasts 4.35 kWh/m2/day of average global horizontal irradiance, which
improves to the east and reaches 5.12 kWh/m2/day in Stockton [34]. There is also potential for offshore wind further out
at sea, although onshore wind resource seems limited [35].
SOLAR ELECTRICITY GENERATION POTENTIAL AROUND OAKLAND
Salt Lake City
Sacramento
San Francisco
Port of Oakland
San Jose
Las Vegas
Los Angeles Phoenix
Solar PV electricity
Long-term average of photovolaic power potential (PVOUT)
generation potential from
Daily totals: 2.0 2.4 2.8 3.2 3.6 4.0 4.4 4.8 5.2 5.6 6.0 6.4
SolarGIS.com used with kWh/kWp
permission Yearly totals: 730 876 1022 1168 1314 1461 1607 1753 1899 2045 2191 2337
WIND ELECTRICITY GENERATION POTENTIAL AROUND OAKLAND
m/s
10+
Port of Oakland
Mean wind speeds at
100 m hub height from
GlobalWindAtlas.info used
with permission [27]
0
Land availability for renewable energy developments in the San Francisco bay area is likely to be scarce, but there is
significant potential further east, where already existing land use can be tied with renewable generation.
There is also significant rooftop potential for solar PV installations that could increase local renewable output,
complementing inputs from the grid. Should the port adopt zero-carbon fuels, the existing fuel infrastructure could also
be repurposed, opening way for additional zero-carbon fuels and renewable installations.
OCEAN CONSERVANCY | 27The infrastructure needed for the adoption of zero-carbon
fuels up to 2030 can be scaled to the demand
The scale of the demand for zero-carbon fuels will depend on the speed of technology adoption. As with the other
case studies, a representative 2030 adoption case is used. This demonstrates the amount of energy needed to meet
the demand of green ammonia and green hydrogen on the assumption that 5% of international vessels and 15% of
domestic vessels will have transitioned to zero-carbon fuels. The methodology used to estimate zero-carbon fuel and
renewable energy requirements is presented in Appendix 2.
This case shows the renewable electricity generation requirements to produce sufficient green hydrogen or ammonia to
meet the fuel demand of the Port of Oakland. The calculations for these figures takes into account the efficiencies and
losses of converting renewable electricity into zero-carbon fuel, and then using that fuel in the vessel.
Due to The Port of Oakland’s frequent international vessels the energy demand from its international vessels is high.
By growing the adoption of domestic vessels to zero-carbon fuels in the port may act as a catalyst for international
vessels demonstrating the feasibility of production and bunkering using zero-carbon fuels.
RENEWABLE ENERGY REQUIRED TO MEET THE ZERO-CARBON FUEL
DEMAND IN THE 2030 ADOPTION CASE
Domestic departures International departures
9
8
Renewable energy requirement, TWh/year
7
6
5
4
3
2
1
0
Hydrogen Ammonia
ZERO-CARBON FOR SHIPPING | 28To meet the fueling demands of the representative 2030 adoption case through green hydrogen fuel, 4.6 TWh per
year of renewable electricity would be required. To meet the demand with green ammonia, 8.3 TWh/year of renewable
energy would be needed. It is possible that green hydrogen and green ammonia will be used in parallel, each being
used for the vessel types and use cases to which they are best suited. This means that the actual renewable generation
requirement will be somewhere between these figures.
Hydrogen Ammonia
PRODUCING ENOUGH FOR THE PRODUCING ENOUGH FOR THE
2030 ADOPTION CASE 2030 ADOPTION CASE
Installed generation Installed generation
capacity needed capacity needed
3.1 GW 4.6 GW
Solar Solar
or or
1.8 GW 2.7 GW
Onshore wind Onshore wind
or or
1.2 GW 1.7 GW
Offshore wind Offshore wind
THE SPACE NEEDED TO BUILD THIS INFRASTRUCTURE DEPENDS ON THE TECHNOLOGY:
1 GW of solar generation 1 GW of onshore wind generation 1 GW of offshore wind generation
infrastructure would cover about infrastructure would require about infrastructure would require
3,000 football fields 64,000 football fields of land about 26,000 football fields of
ocean space
But this space could also be used to But this land can also be used for
graze livestock growing crops and other agriculture
OCEAN CONSERVANCY | 29Initiatives at the Port of Oakland today can help
decarbonize adjacent industries and rail operations in
the future
Decarbonizing the shipping sector is a considerable challenge, and momentum is likely to build up slowly. There is
an important opportunity to drive and influence the uptake of zero-carbon fuels. Industries nearby can become early
adopters and zero-carbon fuels produced could even be used to power nearby rail operations.
Hydrogen-powered trains are already in operation in various countries and are being tested in many others [36].
Zero-carbon fuels produced at the port could be used in the future to power nearby railroad operations, and for
scaling up the hydrogen pilots that the port has already started implementing.
Long term planning and coordination can enable larger
initiatives
While surrounding industries and railways could have a role to play in the local hydrogen economy that could
spawn as a result of adopting zero-carbon fuels at the Port of Oakland, they are likely to join the movement at
different points in time. Long-term planning and strong stakeholder coordination would therefore be imperative
for achieving success.
Their incorporation can be key for creating a solid economic environment and maximizing the use of resources
and infrastructure, as well as enabling the bankability of its components, but to achieve this, cooperation and
coordination must start sooner rather than later.
ZERO-CARBON FOR SHIPPING | 30Case Study: Port of Tacoma
Enabling zero-carbon fuel adoption while
decarbonizing local passenger transport
OCEAN CONSERVANCY | 31The Port of Tacoma is striving for sustainability,
backed by both local and state-wide targets
Since 2014, the Port of Tacoma is part of the North West Seaport Alliance alongside the Port of Seattle. Both ports are
located in the Puget Sound and are surrounded by dense urban areas and hills beyond it. The Port of Tacoma is the 10th
largest in the US and in 2020 it received 1,684 vessels which translated in a total volume of nearly 3.3 million TEUs [37].
The North West Seaport Alliance actively pursues environmental programs to improve neighboring wildlife habitats
and reduce its contributions to air and water pollution. Currently about 50% of container ships calling at the two ports
are shore power equipped, but there are plans in place to equip the remaining large international container terminals by
2030 and cut diesel emissions from vessels further [38]. There are also efforts to reduce emissions from diesel trucks.
Storm water run-off is treated to remove industrial pollutants. The Port of Tacoma also invests in offset purchases to
support renewable energy projects.
The state of Washington has a net zero target for 2050 with two interim targets of 45% reduction from 2005 levels by
2030 and 70% reduction from 2005 levels by 2040 [39]. The Port of Tacoma has already embarked on a journey to cut
its emissions. By leveraging the renewable energy potential in the state and taking up hydrogen derived fuels, the port
has the opportunity to position itself at the forefront of the decarbonization of shipping.
ZERO-CARBON FOR SHIPPING | 32You can also read