An oceanic pathway for Madden-Julian Oscillation influence on Maritime Continent Tropical Cyclones
←
→
Page content transcription
If your browser does not render page correctly, please read the page content below
www.nature.com/npjclimatsci

                  ARTICLE                OPEN

                  An oceanic pathway for Madden–Julian Oscillation influence
                  on Maritime Continent Tropical Cyclones
                  Karthik Balaguru1 ✉, L. Ruby Leung            1
                                                                    , Samson M. Hagos1 and Sujith Krishnakumar           1

                      While the Madden–Julian Oscillation (MJO) has been shown to affect tropical cyclones (TCs) worldwide through its modulation of
                      large-scale circulation in the atmosphere, little or no role for the ocean has been identified to date in this influence of MJO on TCs.
                      Using observations and numerical model simulations, we demonstrate that MJO events substantially impact TCs over the Maritime
                      Continent (MC) region through an oceanic pathway. While propagating across the MC region, MJO events cause significant sea
                      surface cooling with an area-averaged value of about 0.35 ± 0.12 °C. Hence, TCs over the MC region immediately following the
                      passage of MJO events encounter considerably cooler sea surface temperatures. Consequently, the enthalpy fluxes under the
                      storms are reduced and the intensification rates decrease by more than 50% on average. These results highlight an important role
                      played by the ocean in facilitating MJO-induced sub-seasonal variability in TC activity over the MC region.
                      npj Climate and Atmospheric Science (2021) 4:52 ; https://doi.org/10.1038/s41612-021-00208-4
1234567890():,;

                  INTRODUCTION                                                                         RESULTS
                  The Madden–Julian Oscillation (MJO), a 30–60 days period                             Upper-ocean response to MJO
                  oscillation is a dominant mode of variability in the tropical                        The composite mean upper-ocean response to the active
                  atmosphere. It is one of the most important meteorological                           convective phase of the MJO is characterized by a broad region
                  phenomena at intraseasonal timescales with wide-ranging                              of SST cooling over the MC region, extending approximately
                  impacts on global weather and climate1–3. While the wet or                           between 105°E–150°E and 20°S–Equator (Fig. 1a). This pattern of
                  active phase of the MJO is associated with enhanced convection,                      SST cooling over the MC region stands out as a unique response of
                  the dry or suppressed phase is less conducive for convection3,4.                     the ocean to the MJO in the entire tropics (Supplementary Fig. 1).
                  Thus, when the active phase of the MJO happens over a region,                        The maximum SST cooling occurs to the northwest of Australia
                  the large-scale environment becomes more favorable for cyclo-                        and exceeds 1 °C. This composite is based on nearly 90 MJO
                  genesis, leading to the formation and intensification of tropical                     events between 1982 and 2019. MJO-induced SST cooling here is
                  cyclones (TCs) in that region5,6. It has been observed that TCs tend                 defined as the difference in SST between the end of phase 5 and
                  to form in clusters in different basins coinciding with the favorable                the beginning of phase 3, which roughly represents the period
                  or active phase of the MJO7. Reduction in vertical wind shear,                       during the MJO’s lifecycle when it crosses the MC region34,35. The
                  enhancement of low-level cyclonic vorticity and an increase in                       MJO phase and its amplitude correspond to its location and
                  mid-tropospheric humidity are found to be the main factors                           strength, respectively, as defined by the daily real-time multi-
                  behind the MJO’s positive influence on TCs in various regions8–19.                    variate MJO (RMM) index36. The tendency of the MJO to induce
                     While the MJO’s modulation of the atmosphere is well known,                       significant cooling over the MC region was also noted in previous
                  its impact on the upper-ocean has been less clear, and                               studies22,23. This composite is based on the National Oceanic and
                  consequently, the latter became one of the main focal points of                      Atmospheric Administration’s Optimum Interpolation SST (NOAA
                  the Dynamics of the Madden–Julian Oscillation (DYNAMO) field                          OI SST), which only assimilates infrared satellite data, and hence
                  campaign20. Besides changes in cloud cover and precipitation, the                    could be influenced by cloud-effects. To address this, we also
                                                                                                       computed the composite using Tropical Rainfall Measuring
                  MJO is also associated with strong surface wind variations. Their
                                                                                                       Mission (TRMM) SST that is based on microwave satellite data
                  joint impact on surface buoyancy and momentum fluxes triggers a
                                                                                                       (Fig. 1b). The signal, based on 41 MJO events over the period
                  significant response from the ocean mixed layer, and conse-
                                                                                                       1998–2014, is broadly consistent with that obtained earlier in
                  quently the sea surface temperature (SST)21–29. Several studies                      terms of the spatial pattern but is stronger in magnitude,
                  have shown that a prominent feature of the oceanic response to                       especially in certain areas to the south of Java and over the
                  MJO forcing during the active phase is a SST cooling and a                           Banda Sea, suggesting that the infrared satellite-based data likely
                  reduction in upper-ocean heat content over a broad area in the                       underestimates the SST response to MJO.
                  eastern equatorial and southeast Indian Ocean regions, which has                        The temporal evolution of MJO-induced SST cooling based on
                  particular relevance to TCs. Since TCs intensify by extracting heat                  NOAA OI SST, averaged over the region 110°E–130°E and 15°S–5°S,
                  energy from the ocean, SSTs play a critical role in their                            demonstrates the persistence of the oceanic response to MJO
                  development30–33. Despite this, the impact of MJO-induced SST                        forcing (Fig. 1c). Beginning on day 0, which represents the first day
                  cooling on TCs has not been explored to date. In this study, using                   of MJO phase 3, SST cools rapidly until around day 20 with the
                  a suite of observations and numerical model simulations, we                          magnitude of area-averaged cooling reaching a maximum value
                  demonstrate that TCs over the Maritime Continent (MC) region are                     of about 0.35 ± 0.12 °C. The time taken by the MJO event to
                  influenced significantly by MJO-induced SST cooling.                                   progress from the beginning of phase 3 to the end of phase 5 is

                  Pacific Northwest National Laboratory, Richland, WA, USA. ✉email: Karthik.Balaguru@pnnl.gov
                  1

                  Published in partnership with CECCR at King Abdulaziz University
K. Balaguru et al.
2
1234567890():,;
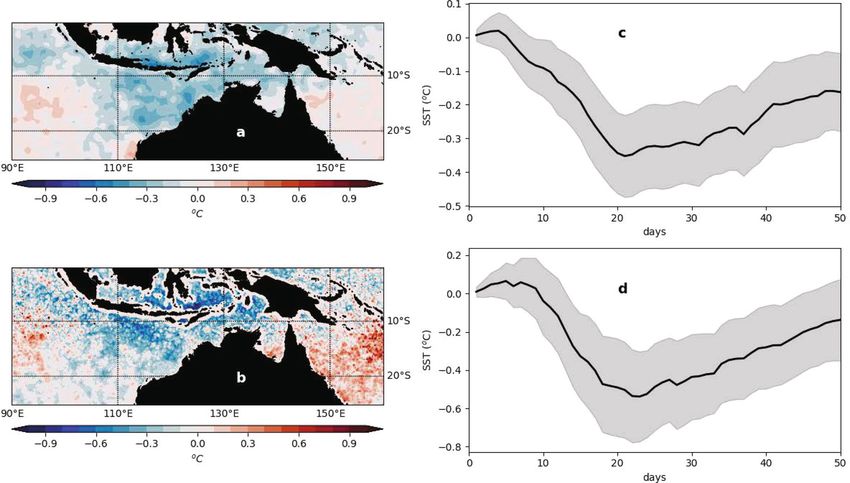
Fig. 1 SST response to MJO-forcing over the MC. a Composite mean upper-ocean response to the MJO based on NOAA OI SST (°C) for the
period 1982–2019. The composite is generated from 91 MJO events over the 38-year period. b Composite mean upper-ocean response to the
MJO based on TRMM SST (°C) for the period 1998–2014. The composite is generated from 41 MJO events over the 17-year period. c Composite
mean time evolution of SST (°C), based on NOAA OI SST and MJO events identified in (a). d Composite mean time evolution of SST (°C), based
on TRMM SST and MJO events identified in (b). In panels (c, d), the SST is averaged over the region 110°E–130°E and 15°S–5°S, and the gray
shading represents the 95% confidence intervals computed as 1.96 times the standard error.
15 ± 7 days, which is in good agreement with the timing of the MC region. Further, the TC season over this region extends from
peak SST cooling. Beyond day 20, the recovery of SST is a rather December to April42, coinciding with the seasonal peak of MJO
slow process. On day 50, nearly a month after the maximum activity over the MC region44. Thus, the natural question it leads us
cooling occurs, the average cooling is still nearly 0.2 °C below the to is whether the MJO-induced SST cooling can influence TCs to
pre-active phase MJO SST. The time evolution of MJO-induced SST the northwest of Australia. To answer this, we performed a
cooling based on TRMM microwave SST (Fig. 1d) is in good Lagrangian along-track composite analysis of the large-scale
agreement with that obtained using NOAA OI SST. Considering ocean-atmosphere environment affecting TCs for the 34-year
the composite mean, the maximum SST cooling occurs on day 22 period 1985–2018 (see “Methods”).
albeit with a stronger magnitude of about 0.54 ± 0.23 °C. Beyond Between days 5 and 24 after the beginning of the MJO event,
this, the SST anomaly recovers slowly and the cooling reaches a the atmosphere is highly favorable for TCs (Supplementary Table
value of about 0.30 ± 0.21 °C on day 50. 1). This roughly corresponds to phases 3–5 of the MJO and
To identify the role of various upper-ocean processes in the represents the time during which the active phase of the MJO
MJO-induced SST cooling over the MC region, a mixed layer heat passes through the MC region. Though the sea surface begins to
budget analysis was performed using an eddy-permitting ocean cool, the atmosphere is very conducive for TC development over
reanalysis that assimilates satellite SSTs and all available hydro- this period. On average, the vertical shear of zonal wind is more
graphic measurements, including data from Argo floats37. The easterly, the 700 hPa relative humidity increases by 4.5%, the low-
analysis, broadly consistent with previous studies38–40, reveals that level relative vorticity is more cyclonic, the outgoing longwave
both surface fluxes at the air–sea interface and vertical processes radiation is reduced by 15.65 W m−2 and the sea-level pressure
in the sub-surface ocean are responsible for the SST change under drops by nearly 200 Pa (Supplementary Table 1). Consequently,
the MJO, and that the shallow seas and climatological mean mixed the mean TC intensification rate increases by about 0.6 m s−1
layers in the MC region play an important role in its larger SST 6-hr−1, and more than 40% of all western Australian 6-hourly TC
response compared to other regions (see Supplementary Note 1). track locations are found during this period. These results are in
line with those from previous studies that have suggested the
MJO’s favorable influence on TCs in this region during phases
Impact on TCs 3–56,10. Note that data here have been sub-sampled so that
The region to the north of Australia over the MC region is home to distributions of TC initial intensity and translation speed are
nearly 15% of global TC activity41. Further, the region to the statistically similar between sample sets used for comparison to
northwest of Australia, between 110°E–130°E and 20°S–10°S, ensure that the results are not contaminated by variations in
happens to be the most TC-prone region in the entire Southern storm characteristics (see Supplementary Table 1).
Hemisphere with 75% of the most intense Australian TC landfalls Subsequently, between days 24 and 41, which roughly
occurring along the coast here42. Although this region is sparsely represents the period after the MJO-active phase has left the
populated, it has much commercial significance10, particularly oil MC region, the positive atmospheric influence of the MJO
and gas43 production. Earlier, we have seen how MJOs induce subsides to a large extent and significant sea surface cooling
substantial sea surface cooling over this region while crossing the prevails over this region (Fig. 1c, d). The number of 6-hourly TC
npj Climate and Atmospheric Science (2021) 52 Published in partnership with CECCR at King Abdulaziz University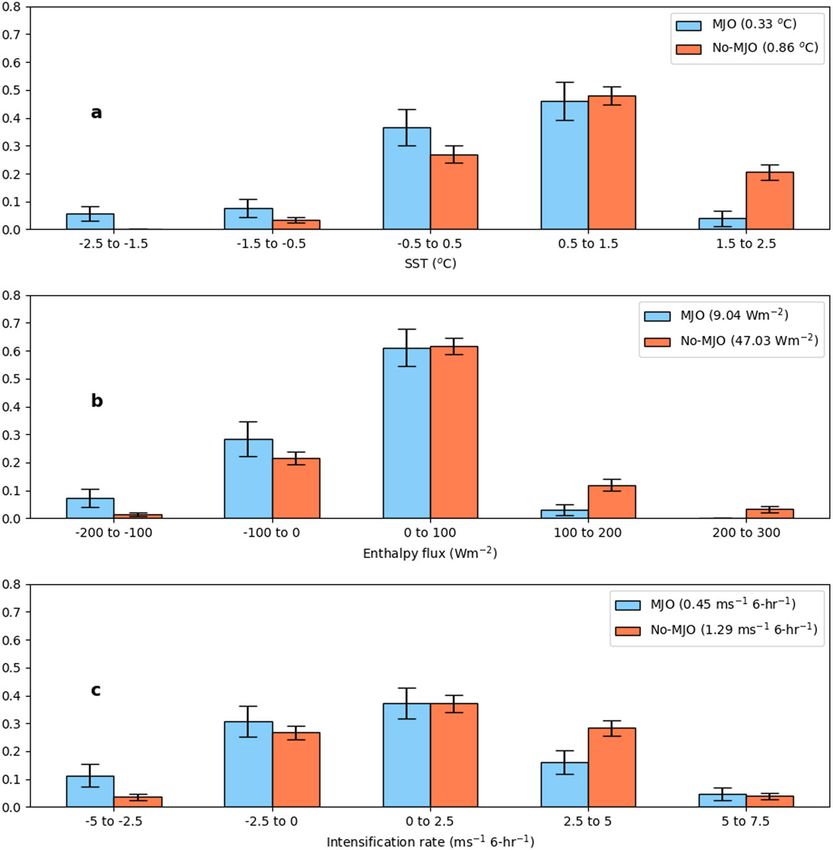
K. Balaguru et al.
                                                                                                                                                 3

Fig. 2 Observed impact of MJO on TCs. a Probability distribution functions (PDFs) of pre-storm SSTs (°C). b Enthalpy fluxes under TCs at the
air–sea interface (W m−2). c TC intensification rates (m s−1 6-hr−1. The PDFs in blue (denoted as “MJO”) correspond to those TC track locations
that fall within the MJO’s Window of Oceanic Influence (MWOI), and the PDFs in orange (denoted as “No-MJO”) correspond to those that fall
outside the MWOI. In each panel, the mean values are shown in the legend and the error bars representing the standard deviation
(s.d.), generated based on the Monte Carlo technique (see “Methods”), are indicated. The difference between mean values are statistically
significant at the 95% level for each parameter. The analysis is based on NOAA OI SST, Woods Hole Oceanographic Institution’s Objectively
Analyzed air–sea Fluxes for the Global Oceans (WHOI OAFlux), and TC best track data.

track locations during this period decreases to 20%, likely due to       further reinforce these results (Fig. 2). Compared to the PDFs for
the reduced MJO’s positive influence on cyclogenesis through the          TC locations outside the MWOI, the PDFs for TC track locations
atmospheric pathway. We denote this period as the MJO’s                  inside the MWOI are skewed to the left indicating relatively lower
Window of Oceanic Influence (MWOI). To clearly isolate the role           pre-storm SSTs (Fig. 2a) and air–sea enthalpy fluxes (Fig. 2b), and a
of MJO-induced oceanic cooling on TC intensification during this          reduction in TC intensification rates (Fig. 2c) for the latter. These
period, we sub-sample the data so that in addition to distributions      differences are statistically significant at the 95% level based on
of initial storm characteristics, distributions of pre-storm atmo-       the Student’s t-test for difference of the means. Although we
spheric parameters are also statistically similar between sample         attribute differences in enthalpy fluxes under TCs to those in pre-
sets used for comparison (see Supplementary Table 2). This is            storm SST differences, minor contributions are also possible from
necessary because a period of suppressed MJO convection                  differences in surface winds (see Supplementary Note 2). Some
typically follows the convectively active phase22, thus raising a        previous studies suggested that the potential intensity for a TC,
possibility for some potential atmospheric influence to act on top        and consequently its intensification, is more closely related to the
of that from the ocean. The pre-storm SST anomaly for TCs outside        relative SST or the absolute SST minus the tropical mean SST45. A
the MWOI is 0.86 °C, which reduces significantly to 0.33 °C inside        sensitivity test indicates that similar results are obtained when
the MWOI representing a decrease of 0.53 °C. In response to this         absolute SST is replaced with relative SST in our analysis. Although
cooling, the anomalous dry stability in the lower troposphere            these results strongly support the role of MJO-induced oceanic
(1000–850 hPa) increases by 0.0024 K Pa−1 and the anomalous              cooling in suppressing TC intensification inside the MWOI, we
enthalpy flux out of the ocean reduces from about 47 W m−2                acknowledge that the ocean’s negative impact on TCs may be
outside the MWOI to about 9 W m−2 inside the MWOI, indicating a          modulated by some lingering atmospheric effects of the MJO.
reduction of about 38 W m−2. Consequently, the TC intensification
rates are significantly reduced inside the window. While the mean         Model
intensification rate outside the MWOI is 1.29 m s−1 6-hr−1, it            While results presented thus far are based on observations,
reduces by more than 50% to 0.45 m s−1 6-hr−1 within the MWOI.           numerical simulations of Cyclone Olga using a high-resolution
   The probability distribution functions (PDFs) of pre-storm SSTs,      regional atmospheric model (see “Methods”) provide further
enthalpy fluxes under TCs and the 24 hr TC intensification rates           support. Olga, a tropical storm from the 1999–2000 Australian

Published in partnership with CECCR at King Abdulaziz University                                 npj Climate and Atmospheric Science (2021) 52
K. Balaguru et al.
4
Fig. 3 Simulating MJO’s impact on TC Olga (2000). a Track of TC Olga from observations (black) and model simulations (WAKE (green) and
NO-WAKE (orange)). While the “WAKE” case represents the set of simulations where the model is forced by observed SST, the “NO-WAKE” case
represents the set of simulations where the model is forced by SSTs from which the influence of MJO is removed. Both “WAKE” and “NO-
WAKE” each consist of 8 simulations and the ensemble mean tracks are shown. The color in the background represents the SST change
induced by prior MJO, just before Olga’s formation on 15 March 2000. Dates are shown near tracks to indicate the direction of Olga’s
movement. b Time evolution of Olga’s 10 m maximum winds (kt) from observations and model simulations. Time evolution of difference
between NO-WAKE and WAKE simulations for (c) 10 m maximum wind (kt, green) and minimum sea-level pressure (hPa, red), and (d) along-
track pre-storm SST (°C, brown) and enthalpy flux at the air–sea interface under the storm (W m−2, purple). As in panel (a), ensemble mean
values are shown in panels (b–d). The shading in panel (b), and the vertical bars in panels (c, d), indicate the ensemble spread as represented
by the s.d.
cyclone season formed in the Timor Sea on 15 March 2000 in the Similarly, it was found that strong MJO events weaken subsequent
aftermath of a MJO event that began on 1 March and appears to events that immediately follow them through their SST foot-
have traversed the SST cooling induced by the MJO (Fig. 3a). To prints28. The results from this study, where we demonstrate the
understand the impact of the upper-ocean response to MJO on cross-phenomena interaction between MJOs and TCs through the
Olga, we performed two sets of simulations with and without the ocean, represent a shift in the prevailing understanding that MJOs
MJO-induced SST cooling (see “Methods”). The tracks from the can primarily influence TCs through a modulation of the large-
simulations are in good agreement with the observed track of scale atmospheric circulation. Also, they point towards an
Olga and the storm follows a similar trajectory after formation (Fig. improvement in prediction skill through realistic representation
3a). In the control simulation (WAKE), the time evolution of Olga’s of air–sea coupled processes in models.
intensity agrees reasonably with the observed despite some Furthermore, the oceanic influence of the MJO on Australian
differences (Fig. 3b). For instance, the peak intensity for Olga is TCs presented here can also have longer-term consequences. For
higher by about 3 kt and is attained nearly a day earlier. Despite instance, stronger MJOs tend to induce more sea surface cooling
these, the model captures the salient features of Olga’s life-cycle as they pass over the MC region (Supplementary Fig. 2a). Also, the
and provides a good baseline for comparison. strength of MJOs while over the MC region appears to be on the
When the MJO-induced SST cooling is removed from the decline (Supplementary Fig. 2b) as a result of gradual eastward
forcing (NO-WAKE), the intensity of Olga increases considerably expansion of the background climatological warm pool47. Thus,
(Fig. 3b). While previously Olga remained a tropical storm with a changes in MJO characteristics over time can induce correspond-
peak intensity close to 45 kt, it now attains Category 1 strength ing changes in the MJO’s influence on TCs over this region. Finally,
with peak winds exceeding 60 kt. Thus, without the SST cooling of the MJO-induced SST cooling over the MC is tightly related to the
prior MJO, Olga’s maximum winds would have been nearly 15 kt upper-ocean stratification over that region (Supplementary Fig. 3).
higher and minimum sea-level pressure lower by about 13 hPa With the latter projected to change under global warming48, the
(Fig. 3c). Differences in along-track SST (Fig. 3d) reveal that the “braking” effect of MJOs on TC intensification over the MC region
pre-storm SSTs for Olga were reduced by nearly 1 °C by the MJO could be altered in future.
between 15 and 17 March. Without this cooling, the enthalpy flux
out of the ocean would have been considerably higher. Averaged
METHODS
over the course of 2 days, the enthalpy flux increases by 67% in
the “NO-WAKE” case with respect to its value of about 230 W m−2 Data
in the “WAKE” case, allowing Olga to strengthen into a Category 1 We obtain daily NOAA OI SST49 from https://psl.noaa.gov/data/gridded/
data.noaa.oisst.v2.highres.html for the period 1983–2019 to estimate MJO-
hurricane in the “NO-WAKE” case.
induced SST change. We also obtain TRMM Microwave Imager daily SST for
the period 1998–2014 from http://www.remss.com/missions/tmi/ to verify
the signal based on NOAA OI SST. Five-day mean vertical ocean
DISCUSSION temperature and salinity profiles, and surface ocean fluxes from SODA3
Past research has documented the negative effects of lingering (version 3.3.1)37 ocean reanalysis, obtained from https://www.soda.umd.
cold wakes of TCs on subsequent TCs that encounter them46. edu for the period 1980–2015, are used to understand the role of various
npj Climate and Atmospheric Science (2021) 52 Published in partnership with CECCR at King Abdulaziz UniversityK. Balaguru et al.
5
upper-ocean processes in MJO-induced SST change. To identify MJOs, we anomaly on 00 UTC 15 March 2000, calculated with respect to the 10-day
use time series of daily RMM36 index values, obtained for the period mean SST prior to phase 4 of the MJO, is added to the initial SST as
1980–2018 from the Australian Bureau of Meteorology (http://www.bom. perturbation in the NO-WAKE experiment. The initial perturbation is
gov.au/climate/mjo/graphics/rmm.74toRealtime.txt). reduced every 6 h using the composite mean evolution of SST cooling
TC track data for the period 1985–2018 are obtained from https:// averaged over the region 110°E–130°E and 15°S–5°S (Fig. 1c).
emanuel.mit.edu/products and used to estimate the values of various
atmospheric and oceanic parameters along TC tracks. WHOI OAFlux50 daily
latent and sensible heat fluxes, obtained from http://oaflux.whoi.edu are DATA AVAILABILITY
used to estimate the enthalpy flux transfer at the air–sea interface under Model output are available on request from K.B. All other datasets used in this study
TCs. Daily NCEP-DOE 2 atmospheric reanalysis data51, obtained from are freely available for download from the various links provided in “Methods”.
(https://psl.noaa.gov/data/gridded/data.ncep.reanalysis2.html), and daily
NOAA outgoing longwave radiation (OLR)52 obtained from https://www.
psl.noaa.gov/data/gridded/data.interp_OLR.html, are used to estimate CODE AVAILABILITY
various TC-relevant atmospheric parameters and outgoing longwave
The WRF-ARW model code is freely available for download from the link provided in
radiation anomalies along TC tracks.
“Methods”.
Calculations Received: 24 May 2021; Accepted: 29 September 2021;
MJO events are identified using the following procedure. First, a date is
identified in the RMM index time series on which the phase 3 amplitude is
larger than 1. The next 30 days are then examined to see if phases 4, 5, and
6 occur at least once irrespective of the amplitude. If these two conditions
are met, the MJO event is said to have propagated over the MC region and
selected for our analysis35. REFERENCES
The following parameters are estimated along TC tracks to understand the 1. Madden, R. A. & Julian, P. R. Description of global-scale circulation cells in the
pre-storm large-scale environment: vertical shear of zonal wind evaluated tropics with a 40–50 day period. J. Atmos. Sci. 29, 1109–1123 (1972).
between 200 and 850 hPa, relative humidity at 700 hPa, relative vorticity at 2. Wheeler, M. & Kiladis, G. N. Convectively coupled equatorial waves: analysis of
850 hPa, vertical velocity at 300 hPa, sea-level pressure, outgoing longwave clouds and temperature in the wavenumber–frequency domain. J. Atmos. Sci. 56,
radiation, and SST6. Specifically, we follow each MJO event and look for TC 374–399 (1999).
track locations that fall within a period. For each identified track location, we 3. Zhang, C. Madden–Julian Oscillation: bridging weather and climate. Bull. Am.
compute various pre-storm atmospheric parameters, pre-storm SST, the Meteorol. Soc. 94, 1849–1870 (2013).
enthalpy flux under the storm and the intensification rate. Next, we follow a 4. Kiladis, G. N., Straub, K. H. & Haertel, P. T. Zonal and vertical structure of the
similar procedure to compute the same environmental and storm parameters Madden–Julian Oscillation. J. Atmos. Sci. 62, 2790–2809 (2005).
for those TC track locations that fall outside that period. Finally, we examine 5. Camargo, S. J., Wheeler, M. C. & Sobel, A. H. Diagnosis of the MJO modulation of
the composite mean differences between the two sets of data and test for tropical cyclogenesis using an empirical index. J. Atmos. Sci. 66, 3061–3074 (2009).
statistical significance in various parameters. 6. Klotzbach, P. J. The Madden–Julian Oscillation’s impacts on worldwide tropical
While the atmospheric parameters are averaged over a 5° × 5° box cyclone activity. J. Clim. 27, 2317–2330 (2014).
centered over the storm, pre-storm SST and enthalpy fluxes are averaged 7. Gray, W. M. Hurricanes: their formation, structure and likely role in the tropical
over a 2° × 2° box centered over the storm. The atmospheric parameters circulation. In Meteorology Over the Tropical Oceans (ed. Shaw, D.B.) 155–218
and pre-storm SST are estimated 2 days before the arrival of the storm. The (Royal Meteorological Society, 1979).
enthalpy flux, on the other hand, is estimated on the day of the storm. The 8. Liebmann, B., Hendon, H. H. & Glick, J. D. The relationship between tropical
TC intensification rate at a location is estimated as the slope of the linear cyclones of the Western Pacific and Indian Oceans and the Madden–Julian
regression of the maximum wind speed over five successive 6-hourly track Oscillation. J. Meteorol. Soc. Jpn. 72, 401–412 (1994).
locations beginning with the current location. The dry stability of the 9. Maloney, E. D. & Hartmann, D. L. Modulation of hurricane activity in the Gulf of
atmosphere is estimated as ∂∂ θp where θ is the potential temperature and Mexico by the Madden–Julian Oscillation. Science 287, 2002–2004 (2000).
p is the pressure. Throughout the study for various analysis, the seasonal 10. Hall, J. D., Matthews, A. J. & Karoly, D. J. The modulation of tropical cyclone
cycle is removed from different parameters. We use the Monte Carlo activity in the Australian region by the Madden–Julian Oscillation. Mon. Weather
method of repeated random sampling to generate error bars for the PDFs. Rev. 129, 2970–2982 (2001).
From a given distribution, we randomly select half of the samples to 11. Bessafi, M. & Wheeler, M. C. Modulation of South Indian Ocean tropical cyclones
generate a PDF and repeat this process a hundred times. Following this, by the Madden–Julian Oscillation and convectively coupled equatorial waves.
the mean and standard deviation computed across the PDFs yield the Mon. Weather Rev. 134, 638–656 (2006).
mean PDF and error bars, respectively. 12. Ho, C.-H., Kim, J.-H., Jeong, J.-H., Kim, H.-S. & Chen, D. Variation of tropical cyclone
activity in the South Indian Ocean: El Niño–Southern Oscillation and Madden-Julian
Oscillation effects. J. Geophys. Res. 111, D22 (2006). https://doi.org/10.1029/
Numerical experiments 2006JD007289.
To illustrate the MJO’s oceanic influence on TCs, we performed numerical 13. Aiyyer, A. & Molinari, J. MJO and tropical cyclogenesis in the Gulf of Mexico and
simulations of tropical storm “Olga” (15–19 March 2000), which occurred Eastern Pacific: case study and idealized numerical modeling. J. Atmos. Sci. 65,
5 days after the end of a MJO’s phase 5, using the non-hydrostatic WRF- 2691–2704 (2008).
ARW version 4.053. The model domain covers the region between 14. Barrett, B. S. & Leslie, L. M. Links between tropical cyclone activity and Madden-
95E°–125°E and 30°S–Equator, with 4 km horizontal resolution and 35 Julian Oscillation phase in the North Atlantic and Northeast Pacific Basins. Mon.
terrain following vertical levels up to 50 hPa. The initial and boundary Weather Rev. 137, 727–744 (2009).
conditions, including SST, are from ERA5 reanalysis54 (https://www.ecmwf. 15. Chand, S. S. & Walsh, K. J. The influence of the Madden–Julian Oscillation on
int/en/forecasts/datasets/reanalysis-datasets/era5) with 31 km horizontal tropical cyclone activity in the Fiji region. J. Clim. 23, 868–886 (2010).
resolution, available from https://www2.mmm.ucar.edu/wrf/users/ 16. Kikuchi, K. & Wang, B. Formation of tropical cyclones in the Northern Indian
download/free_data.html. Boundary conditions are updated every 6 h. Ocean associated with two types of tropical intraseasonal oscillation modes. J.
The physical parameterizations used are detailed in Supplementary Table Meteorol. Soc. Jpn. 88, 475–496 (2010).
3. Eight ensemble members are created using combinations of four cloud 17. Ventrice, M. J., Thorncroft, C. D. & Roundy, P. E. The Madden-Julian Oscillation’s
microphysical schemes and two planetary boundary layer schemes. The influence on African Easterly Waves and downstream tropical cyclogenesis. Mon.
integration of the model is carried out from 00 UTC 15 March 2000 to 12 Weather Rev. 139, 2704–2722 (2011).
UTC 19 March 2000. Using aforementioned model design, two sets of 18. Klotzbach, P. J. El Niño-Southern Oscillation, the Madden-Julian Oscillation and
eight-member ensemble experiments are performed. Atlantic basin tropical cyclone rapid intensification. J. Geophys. Res. 117, D14
In the first set of experiments (WAKE), which represents the control case, (2012). https://doi.org/10.1029/2012JD017714.
TC Olga is forced with observed SST. In the second set of experiments (NO- 19. Krishnamohan, K., Mohanakumar, K. & Joseph, P. The influence of Madden–Julian
WAKE), TC Olga is forced with a SST from which the cooling induced by the Oscillation in the genesis of north Indian Ocean tropical cyclones. Theor. Appl.
prior MJO is removed. More specifically, the magnitude of negative SST Climatol. 109, 271–282 (2012).
Published in partnership with CECCR at King Abdulaziz University npj Climate and Atmospheric Science (2021) 52K. Balaguru et al.
6
20. Yoneyama, K., Zhang, C. & Long, C. N. Tracking pulses of the Madden–Julian 48. Kwiatkowski, L. et al. Twenty-first century ocean warming, acidification, deox-
Oscillation. Bull. Am. Meteorol. Soc. 94, 1871–1891 (2013). ygenation, and upper-ocean nutrient and primary production decline from
21. Waliser, D. E., Murtugudde, R. & Lucas, L. E. Indo–Pacific Ocean response to CMIP6 model projections. Biogeosciences 17, 3439–3470 (2020).
atmospheric intraseasonal variability: 1. Austral summer and the Madden–Julian 49. Reynolds, R. W. et al. Daily high–resolution–blended analyses for sea surface
Oscillation. J. Geophys. Res. 108, 3160 (2003). temperature. J. Clim. 20, 5473–5496 (2007).
22. Zhang, C. Madden–Julian Oscillation. Rev. Geophys. 43, RG2003 (2005). 50. Yu, L. & Weller, R. A. Objectively analyzed air–sea heat fluxes for the global
23. Woolnough, S., Vitart, F. & Balmaseda, M. The role of the ocean in the ice–free oceans (1981–2005). Bull. Am. Meteorol. Soc. 88, 527–540 (2007).
Madden–Julian Oscillation: implications for MJO prediction. Q. J. R. Meteorol. Soc. 51. Kanamitsu, M. et al. NCEP–DOE AMIP–II reanalysis (R–2). Bull. Am. Meteorol. Soc.
133, 117–128 (2007). 83, 1631–1644 (2002).
24. Drushka, K., Sprintall, J. & Gille, S. T. Subseasonal variations in salinity and barrier- 52. Liebmann, B. & Smith, C. A. Description of a complete (interpolated) outgoing
layer thickness in the eastern equatorial Indian Ocean. J. Geophys. Res. 119, longwave radiation dataset. Bull. Am. Meteorol. Soc. 77, 1275–1277 (1996).
805–823 (2014). 53. Skamarock, W. C. et al. A Description of the Advanced Research WRF Model Version
25. DeMott, C. A., Klingaman, N. P. & Woolnough, S. J. Atmosphere–ocean coupled 4, 145 (National Center for Atmospheric Research, 2019).
processes in the Madden-Julian Oscillation. Rev. Geophys. 53, 1099–1154 (2015). 54. Hersbach, H. et al. The ERA5 global reanalysis. Q. J. R. Meteorol. Soc. 146,
26. Jensen, T. G., Shinoda, T., Chen, S. & Flatau, M. Ocean response to CINDY/DYNAMO 1999–2049 (2020).
MJOs in air–sea-coupled COAMPS. J. Meteorol. Soc. Jpn. 93, 157–178 (2015).
27. De Szoeke, S. P., Edson, J. B., Marion, J. R., Fairall, C. W. & Bariteau, L. The MJO and
air–sea interaction in TOGA COARE and DYNAMO. J. Clim. 28, 597–622 (2015).
28. Moum, J. N., Pujiana, K., Lien, R.-C. & Smyth, W. D. Ocean feedback to pulses of the ACKNOWLEDGEMENTS
Madden–Julian Oscillation in the equatorial Indian Ocean. Nat. Commun. 7, 1–7 K.B., L.R.L., S.M.H. and S.K. are supported by the Office of Science (BER) of the U.S.
(2016). Department of Energy as part of the Regional & Global Model Analysis (RGMA)
29. Rydbeck, A. et al. Ocean heat content and the intraseasonal oscillation. Geophys. program area. The Pacific Northwest National Laboratory is operated for DOE by
Res. Lett. 46, 14558–14566 (2019). Battelle Memorial Institute under contract DE-AC05-76RL01830. The computations
30. Emanuel, K. A. An air–sea interaction theory for tropical cyclones. Part I. Steady- were mainly carried out using the computing resources at the National Energy
state maintenance. J. Atmos. Sci. 43, 585–605 (1986). Research Scientific Computing Center (NERSC), a U.S. Department of Energy Office of
31. Holland, G. J. The maximum potential intensity of tropical cyclones. J. Atmos. Sci. Science User Facility located at Lawrence Berkeley National Laboratory, operated
54, 2519–2541 (1997). under Contract No. DE-AC02-05CH11231.
32. Emanuel, K. A. Thermodynamic control of hurricane intensity. Nature 401,
665–669 (1999).
33. Knutson, T. R. et al. Tropical cyclones and climate change. Nat. Geosci. 3, 157–163 AUTHOR CONTRIBUTIONS
(2010). K.B., L.R.L. and S.M.H. developed the main idea. K.B. performed the analysis of
34. Lafleur, D. M., Barrett, B. S. & Henderson, G. R. Some climatological aspects of the observations. K.B., L.R.L. and S.M.H. wrote the paper. S.K. conducted model
Madden–Julian Oscillation (MJO). J. Clim. 28, 6039–6053 (2015). simulations and analyzed the output.
35. Burleyson, C. D., Hagos, S. M., Feng, Z., Kerns, B. W. & Kim, D. Large–scale
environmental characteristics of MJOs that strengthen and weaken over the
Maritime Continent. J. Clim. 31, 5731–5748 (2018).
36. Wheeler, M. C. & Hendon, H. H. An all–season real–time multivariate MJO index: COMPETING INTERESTS
development of an index for monitoring and prediction. Mon. Weather Rev. 132, The authors declare no competing interests.
1917–1932 (2004).
37. Carton, J. A., Chepurin, G. A. & Chen, L. SODA3: a new ocean climate reanalysis. J.
Clim. 31, 6967–6983 (2018). ADDITIONAL INFORMATION
38. Drushka, K., Sprintall, J., Gille, S. T. & Wijffels, S. In situ observations of Supplementary information The online version contains supplementary material
Madden–Julian Oscillation mixed layer dynamics in the Indian and Western available at https://doi.org/10.1038/s41612-021-00208-4.
Pacific Oceans. J. Clim. 25, 2306–2328 (2012).
39. Halkides, D., Waliser, D. E., Lee, T., Menemenlis, D. & Guan, B. Quantifying the Correspondence and requests for materials should be addressed to Karthik Balaguru.
processes controlling intraseasonal mixed-layer temperature variability in the
tropical Indian Ocean. J. Geophys. Res. 120, 692–715 (2015). Reprints and permission information is available at http://www.nature.com/
40. Pei, S., Shinoda, T., Steffen, J. & Seo, H. Substantial sea surface temperature reprints
cooling in the Banda Sea associated with the Madden-Julian Oscillation in the
boreal winter of 2015. J. Geophys. Res. 126, e2021JC017226 (2021). Publisher’s note Springer Nature remains neutral with regard to jurisdictional claims
41. Dare, R. A. & Davidson, N. E. Characteristics of tropical cyclones in the Australian in published maps and institutional affiliations.
region. Mon. Weather Rev. 132, 3049–3065 (2004).
42. Bureau of Meteorology, Australian Government. Climatology of Tropical Cyclones
in Western Australia. (Bureau of Meteorology, accessed 4 April 2021); http://www.
bom.gov.au/cyclone/climatology/wa.shtml. Open Access This article is licensed under a Creative Commons
43. Longley, I. et al. The North West Shelf of Australia – a Woodside perspective. In Attribution 4.0 International License, which permits use, sharing,
The Sedimentary Basins of Western Australia 3: Proc. Petroleum Exploration Society adaptation, distribution and reproduction in any medium or format, as long as you give
of Australia Symposium Vol. 27 (eds. Keep, M. & Moss, S.) 88 (Petroleum appropriate credit to the original author(s) and the source, provide a link to the Creative
Exploration Society of Australia, 2002). Commons license, and indicate if changes were made. The images or other third party
44. Zhang, C. & Dong, M. Seasonality in the Madden–Julian Oscillation. J. Clim. 17, material in this article are included in the article’s Creative Commons license, unless
3169–3180 (2004). indicated otherwise in a credit line to the material. If material is not included in the
45. Ramsay, H. A. & Sobel, A. H. Effects of relative and absolute sea surface tem- article’s Creative Commons license and your intended use is not permitted by statutory
perature on tropical cyclone potential intensity using a single–column model. J. regulation or exceeds the permitted use, you will need to obtain permission directly
Clim. 24, 183–193 (2011). from the copyright holder. To view a copy of this license, visit http://creativecommons.
46. Balaguru, K., Taraphdar, S., Leung, L. R., Foltz, G. R. & Knaff, J. A. Cyclone–cyclone org/licenses/by/4.0/.
interactions through the ocean pathway. Geophys. Res. Lett. 41, 6855–6862 (2014).
47. Roxy, M. et al. Twofold expansion of the Indo–Pacific warm pool warps the MJO
life cycle. Nature 575, 647–651 (2019). © The Author(s) 2021, corrected publication 2021
npj Climate and Atmospheric Science (2021) 52 Published in partnership with CECCR at King Abdulaziz UniversityYou can also read