An Overview of Police Work in Portland - Prepared by Shawn Campbell This document last updated: March 23, 2021
←
→
Page content transcription
If your browser does not render page correctly, please read the page content below
An Overview of Police Work in
          Portland

              Prepared by Shawn Campbell

       This document last updated: March 23, 2021
Overview

The following is not meant to be an overview of all pertinent information
regarding the PPB, it is simply meant to be a resource bringing together a
significant amount of regularly updated data and information. A significant
amount of additional reports, studies, and other sources of information
exist and should as well be consulted regarding the current effectiveness of
the PPB in meeting the needs of the communities of Portland.
A Quick Note on Demographics
   2018 5-Year ACS Survey Portland Demographics                   In several instances, demographic data is used to make relative
                                      Non                         comparisons to overall population and certain demographic groups. This
                                    Hispanic Hispanic Total       type of data is created via two different sources.
Total                               577,292 62,095 639,387
White                               450,711 42,253 492,964        Total population is measured using data put together by Portland State
Black                                35,895     906   36,801
Native American                       3,791     984    4,775
                                                                  University’s Population Research Center, which are regarded as the most
Asian                                50,993     550   51,543      accurate for measuring the city’s population growth over time.
Other Race                            6,602   11,449  18,051      https://www.pdx.edu/population-research/
Two or More Races Total              29,300    5,953  35,253
White and Black                                        7,802      Estimates of demographic representation in Portland are measured using
White and Native American                              6,913      the U.S. Census Bureau’s (USCB) 5-Year American Community Survey (ACS).
White and Asian                                       11,288
Black and Native American                               687
                                                                  The 5-Year ACS is used due to its relatively low margin of error and is the
Two or More Other Race Combinations                    8,563      most commonly used by the federal and state government. The previous
                                                                  years ACS is used due to estimates not being released until late in the year.
                                                                  https://data.census.gov/cedsci/all?q=portland,%20oregon
            Grouped Demographic Estimates
                                    2018 ACS Survey     PSU       Direct comparisons between USCB data and PPB data is difficult due to
                                      #         %     2019 Est.
                                                                  USCB data regarding race being based on self-identification while PPB data
Total                              639,387             657,100
White                              450,711 70.5%       463,197    is based upon officers’ perceptions. As well, USCB data recognizes Hispanic
Black                              45,290     7.1%     46,545     as an ethnicity rather than a race and includes a broader set of categories.
Hispanic                           59,655     9.3%     61,308
Native American                    11,688     1.8%     12,012     Due to this certain assumptions have to be made regarding how various
Asian                              62,831     9.8%     64,572     self-identified USCB groups are most likely to be perceived by others when
Other                               9,212     1.4%      9,467
                                                                  sorting them into a small set of categories. The assumptions made here are
                                                                  imperfect, but are a best faith effort given the availability of certain types
                                                                  of data. Note that in USCB data Middle Eastern is counted as White.
Portland – Who We Are
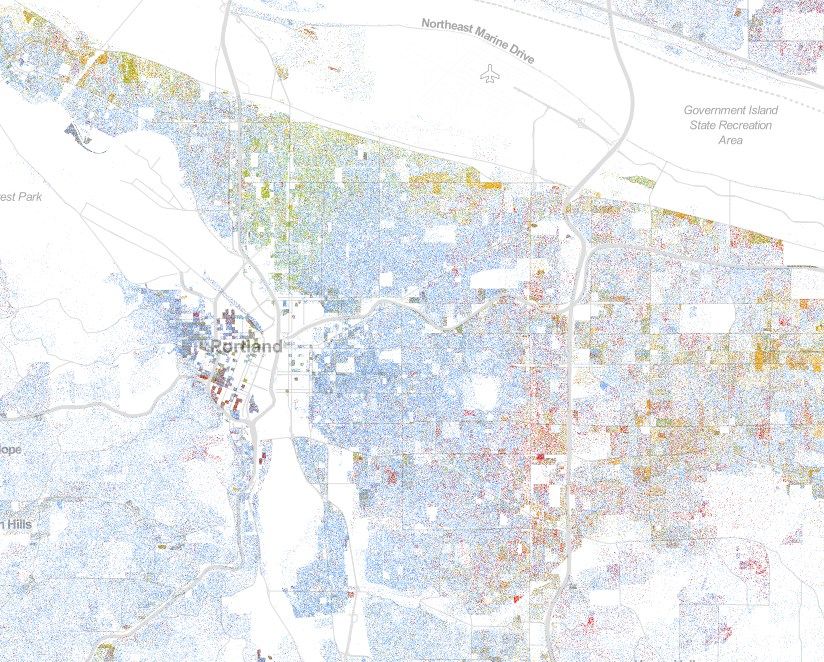
2010 Census Map
Home to 660,000 people, an increase of 17% Blue – White
compared to the population a decade ago. Green – Black
Pre-COVID, an additional 270,000 commuted into Yellow – Hispanic
the city for work, while 123,000 Portland residents Red – Asian
commuted out of the city for work. Given jobs data
and surrounding demographics, these inbound
commuters likely make the city less diverse than
what is suggested by population.
https://onthemap.ces.census.gov/
Pre-COVID, an additional 23,000 people on average
were present in Portland as tourists. In addition, at
any given time there is a significant number of
people visiting the city to do business. It is doubtful
that either of these significantly increase diversity.
14% of the population is foreign born, including
39% Asian, 28% White (mostly Slavic and Middle
Eastern), 20% Hispanic, 7% Black, and 6% Other.
19% of population speak a language other than
English at home and 8% speak English less than
very well.
Current Core Patrol Model
                                                     Bureau of Emergency Communications (BOEC)
          BOEC             BOEC
                                             BOEC handles emergency and non-emergency calls for public safety
        Emergency      Non-Emergen.          services from the general public. BOEC acts as both the primary intake for
        Calltakers       Calltakers          service requests and the dispatcher of emergency services.
                                             Calltakers: Members of the general public contact BOEC via either the 911
                  BOEC                       emergency system or via the non-emergency call or text system. Calltakers
                Resource                     collect information to gain a better understanding of the situation and the
                                             resources needed to handle it. Calltakers utilize this information to assign
               Dispatchers                   the call a type code and priority level. This information is shared with
                                             dispatchers via a computer system.
               Dispatch                      Dispatchers: BOEC dispatchers utilize the information provided by the
                                             calltakers to dispatch police, fire, medical, or utility services as needed.
  PPB              PPB            PPB        They utilize protocols to decide the type and number of units to dispatch,
 Traffic          Patrol       ECIT Patrol   and also provide relevant information, such as past calls to the same
                                             location or updates from the calltakers. They as well act as intermediaries
 Officers        Officers       Officers
                                             for requests from responding units for further, specific, or enhanced
                                             resources.
                Referral
                                             For the majority of police services, dispatchers do not assign specific units
                                             to a call. Rather, a list of calls ranked by priority are sent to units in the
   PPB             PPB            PPB        geographic area, who then respond to them based upon availability.
SERT & CNT        Crime        Prevention
  Teams        Investigators     Teams
Current Core Patrol Model
BOEC BOEC Dispatched Police Services
Non-Emergen. Approximately 72% of police calls for service are citizen-initiated, with the
Emergency
remainder the result of proactive policing, flag downs, and follow up. In the
Calltakers Calltakers public safety system, police handle the widest variety of calls for service.
Patrol Officers: PPB patrol officers are the primary responders to calls for
BOEC service involving the police. They patrol and respond to calls in a specific
Resource patrol areas, and provide support to neighboring patrol areas as needed. At
Dispatchers all times they must be ready to handle calls ranging from mild personal
disputes and concerns to active shooters.
Dispatch ECIT Patrol Officers: The Enhanced Crisis Intervention Team (ECIT) are
patrol officers who volunteer for further training in de-escalation and
behavioral health issues. They focus on calls involving these types of issues
PPB PPB PPB while also carrying out normal patrol duties. Approximately 30% of patrol
Traffic Patrol ECIT Patrol officers are ECIT trained. Part of the Behavioral Health Unit.
Officers Officers Officers Traffic Officers: PPB traffic officers focus on the enforcement of traffic laws
and tend to be deployed to areas where traffic accidents and injuries are
Referral common. While they do at times respond to dispatched calls regarding
traffic issues, the majority of their work involves proactive policing, such as
traffic stops. This division was cut significantly in early 2021 to make more
PPB PPB PPB officers available to be patrol officers.
SERT & CNT Crime Prevention
Teams Investigators TeamsCurrent Core Patrol Model
BOEC BOEC Referral and Follow Up Police Services
Emergency Non-Emergen. PPB core patrol services often refer calls and subjects to other units within
Calltakers Calltakers the PPB with specific areas of expertise. This includes for both an
immediate response as well as a follow up response depending upon the
situation.
BOEC
Resource Investigators: PPB detectives investigate major crimes and are specifically
trained to collect and analyze evidence for complex cases. Specialized units
Dispatchers are also trained to provide services to those impacted by major crimes and
aid in the prevention of violence.
Dispatch Prevention: PPB teams which are assigned to programs meant to curb and
reduce violence and other chronic issues related to public safety. The
PPB PPB PPB teams focus range from mental health, to houseless issues, to family
Traffic Patrol ECIT Patrol violence, to drug and addiction issues.
Officers Officers Officers SERT and CNT: The Special Emergency Reaction Team (SERT) and Crisis
Negotiation Team (CNT) are officers with specialized tactical equipment
and training which handle high risk and volatile situations involving a
Referral
significant threat to human life.
PPB PPB PPB
SERT & CNT Crime Prevention
Teams Investigators TeamsViolence Prevention Programs
BOEC BOEC
Behavioral Health Response Teams: Teams made up of an officer and a
Emergency Non-Emergen. mental health clinician who work with individuals with behavioral health
Calltakers Calltakers issues who have multiple contact with police to aid in connecting them
with appropriate services. Part of the Behavioral Health Unit.
BOEC Family Services Division: Works to prevent crime, violence, and
Resource victimization in families; with a special focus on domestic violence, child
abuse, and elder abuse; via investigations, law enforcement, victim
Dispatchers
assistance, and community partnerships.
Narcotics and Organized Crime Division: Works to disrupt and dismantle
Dispatch
mid- to high-level drug trafficking organizations, investigates drug overdose
deaths, and aids patrol officers in solving neighborhood livability issues.
PPB PPB PPB Neighborhood Response: Officers assigned to work with neighborhoods to
Traffic Patrol ECIT Patrol collaboratively create long-term solutions for complex and deeply rooted
Officers Officers Officers issues related to chronic crime, nuisance, and livability issues. This program
has seen drastic cuts over the past year.
Referral Service Coordination Team: Works with the criminal justice system and
social service agencies to provide housing and treatment opportunities for
PPB PPB PPB chronic offenders. Part of the Behavioral Health Unit. This program has
seen drastic cuts over the past year.
SERT & CNT Crime Prevention
Teams Investigators TeamsDefunded Groups
Transit Division: PPB formerly partnered with thirteen other Metro area
BOEC BOEC police departments to provide police services for TriMet public
Emergency Non-Emergen. transportation services. However, each department having its own
Calltakers Calltakers directives made oversight and accountability difficult and members of the
Black community were more likely to be fined, charged, and excluded, even
when taking into account relative ridership rates. The Transit Division was
BOEC defunded in June of 2020.
Resource Youth Services Division: PPB formerly had School Resource Officers
Dispatchers stationed at many local schools to provide direct services and community
engagement. However, there were concerns regarding utilizing the officers
Dispatch as a harsher type of discipline, including taking students into custody, and
members of the Black population were more likely to be affected. The
Youth Division was defunded in June of 2020.
PPB PPB PPB
Gun Violence Reduction Team: The GVRT was a team of detectives and
Traffic Patrol ECIT Patrol patrol officers assigned to investigate and mitigate gun violence. The GVRT
Officers Officers Officers included the direct investigation of crimes and patrol officers using traffic
stops as a reason to search subjects in the areas near shooting incidents.
Referral Questions regarding the team's effectiveness and the higher likelihood of
the Black population being stopped led to it being defunded in June of
2020. However, due to significant levels of gun violence in 2020, the PPB
PPB PPB PPB launched the Enhanced Community Safety Team (ECST) in February of
SERT & CNT Crime Prevention 2021, retaining the investigation portion of the GVRT while doing away
Teams Investigators Teams with the traffic stop aspect.City Pilot and Partner Programs
BOEC BOEC
Public Safety Support Specialists: Pilot program within the PPB involving
Emergency Non-Emergen.
unarmed specialists who do not have the ability to arrest or cite individuals,
Calltakers Calltakers but rather focus on low priority calls for service and other duties that do no
require a police officer, such as taking reports for low level crimes. Meant
to provide an unarmed and more cost-effective response to low priority
BOEC calls. Currently the PPB has 12 PS3s which operate throughout the city.
Resource
Dispatchers Portland Street Response: Housed in Portland Fire and Rescue, the PSR is
meant to be a non-police response for public safety issues involving mental
Dispatch health and/or the houseless. Teams consist of a firefighter EMT, a licensed
mental health crisis therapist, and two community health workers meant to
better connect people with available services. Currently one team operates
PPB PPB PPB in Lents, with plans to roll out a second team in Lents later in 2021 and
Traffic Patrol ECIT Patrol further teams throughout the city in 2022.
Officers Officers Officers
Office of Violence Prevention: Created in 2006, the OVP works to increase
public safety by coordinating with other service providers via providing
Referral grants for programs meant to reduce and prevent conflict and violence,
reducing the cycle of violent crime, and supporting the victims of violent
PPB PPB PPB crime.
SERT & CNT Crime Prevention
Teams Investigators TeamsOther Pilot and Partner Programs
BOEC BOEC Project Respond Crisis Teams: Mobile mental health crisis response teams
Emergency Non-Emergen. operated by Cascadia Health who respond 24/7 to mental health
Calltakers Calltakers emergencies across Multnomah County. They provide onsite mental health
assessments and can issue involuntary holds on individuals who present an
imminent danger to themselves or others. First partnering with police in
BOEC 1993, the PRCT was meant to provide an alternative to police in responding
to menta health cases. However, 82% of calls responded to by PRCT include
Resource
an officer present to ensure the teams safety or assist in involuntary
Dispatchers transport. Respond to 3,200 calls per year. Partner with PPB’s Behavioral
Health Response Teams.
Dispatch Enhanced Service Districts: Areas where the city collects money from
landowners and distributes it for services the district chooses. Clean and
PPB PPB PPB Safe in downtown uses a portion of the money to fund four PPB officers in
Traffic Patrol ECIT Patrol downtown as well as security patrols, and Central Eastside uses a portion
to fund security patrols. These, essentially private, security patrols are
Officers Officers Officers
meant to deter vandalism and deal with non-emergency issues, and
businesses are given phone numbers to directly request them as an
Referral alternative to the traditional methods of contacting police. However,
concerns have been raised about the lack of accountability, the existence of
private patrols in public spaces, and the likelihood of people within the
PPB PPB PPB
district being policed to levels above those outside the districts.
SERT & CNT Crime Prevention
Teams Investigators TeamsWhat Did 2019 Look Like for the PPB?
363,447 calls for service
72% dispatched via BOEC
28% officer initiated
17% resulted in reported crimes
79% of these were property crimes
6% resulted in custodies
23,504 custodies
0.2% resulted in a
use of force
795 cases and 803 subjects
94% of subjects taken into custody
0.05% resulted in force 0.02% resulted in the 0.002% resulted in a
with a weapon or vehicle pointing of a firearm use of deadly force
176 cases and 179 subjects 74 cases and 76 subjects 6 subjects, 5 killedWhat Did 2020 Look Like for the PPB?
308,883 calls for service
76% dispatched via BOEC
24% officer initiated
20% resulted in reported crimes
81% of these were property crimes
5% resulted in custodies
14,900 custodies
0.2% resulted in a
use of force
637 cases and 652 subjects
91% of subjects taken into custody
0.07% resulted in force 0.02% resulted in the 0.0006% resulted in
with a weapon or vehicle pointing of a firearm a use of deadly force
202 cases and 205 subjects 56 cases and 58 subjects 2 subjects, 0 killedPolice Calls For Service Over Time
PPB Call Data per 1,000 Population Call Categories
2015 2016 2017 2018 2019 2020 Civil: Calls related to non-criminal matters where police presence is
Total Calls for Service 608.4 542.0 563.2 556.0 556.1 464.8 requested to keep situation from escalating.
Officer Initiated Calls 213.6 155.5 157.3 152.9 155.8 109.0
Dispatched Calls 394.8 386.5 405.9 403.1 400.3 355.8 Crime: Calls related to activity that may be defined as a crime.
Dispatched Calls by Category
Civil 18.3 17.7 18.5 20.3 22.2 20.7 Disorder: Calls related to disturbances or other problems that
Crime 94.6 93.3 98.1 98.5 97.8 93.6 require police to assess and resolve the situation.
Disorder 195.7 190.7 205.3 204.6 199.9 173.8
Other 12.9 12.0 11.6 11.7 11.8 11.7 Other: Calls that do not fall under the above categories.
Assist 17.6 17.0 17.4 17.2 17.5 14.4
Community Policing 0.5 0.5 0.6 0.4 0.5 0.7 Assist: Calls to provide assistance to medical, fire, partner agencies,
Alarm 20.2 19.8 20.2 19.7 19.9 17.4 or other first responders.
Traffic 35.1 35.5 34.3 30.7 30.8 23.6
Dispatched Calls by Priority Community Policing: Contacts with community, such as dropping off
Low Priority 158.2 152.1 159.5 161.9 173.4 147.2 food baskets and attending school events or community meetings.
Medium Priority 110.6 109.4 117.3 116.5 109.9 92.4
High Priority 125.9 125.1 129.1 124.7 117.0 116.3 Alarm: Calls initiated by the activation of a monitored alarm.
Call Priorities Traffic: Calls related to motor vehicles.
Low: Events that may no longer be in progress, so immediate
response is not urgent. Generally requires a single unit.
Medium: In-progress events without an immediate danger to
persons or property. Multiple units may be necessary. PPB Dispatched Call Data:
https://www.portlandoregon.gov/police/76454
High: In-progress events where persons or high value property are in
immediate danger. Requires multiple units. PSU Population Estimates:
https://www.pdx.edu/population-research/population-estimate-reportsPolice Calls For Service Over Time
PPB Call Data per 1,000 Population The year 2020 is an outlier due to the effects of the COVID-19
2015 2016 2017 2018 2019 2020 pandemic. We cannot ascertain long-term effects on calls at this time.
Total Calls for Service 608.4 542.0 563.2 556.0 556.1 464.8
Officer Initiated Calls 213.6 155.5 157.3 152.9 155.8 109.0 Over the past five years dispatched call volumes have largely
Dispatched Calls 394.8 386.5 405.9 403.1 400.3 355.8 stabilized after significant growth over the 2010-2014 period.
Dispatched Calls by Category
Civil 18.3 17.7 18.5 20.3 22.2 20.7 Similarly, officer-initiated calls have stabilized after significant declines
Crime 94.6 93.3 98.1 98.5 97.8 93.6 in the 2010-2014 period, driven by resources having to be put
Disorder 195.7 190.7 205.3 204.6 199.9 173.8
Other 12.9 12.0 11.6 11.7 11.8 11.7
towards more time-consuming dispatched calls.
Assist 17.6 17.0 17.4 17.2 17.5 14.4
Though dispatched calls by category have remained stable over the
Community Policing 0.5 0.5 0.6 0.4 0.5 0.7
Alarm 20.2 19.8 20.2 19.7 19.9 17.4 past five years, the priority levels of calls have shifted, with growth in
Traffic 35.1 35.5 34.3 30.7 30.8 23.6 low priority calls and a decline in medium and high priority calls,
Dispatched Calls by Priority continuing a trend noted over the past ten years.
Low Priority 158.2 152.1 159.5 161.9 173.4 147.2
Medium Priority 110.6 109.4 117.3 116.5 109.9 92.4 Call types that have increased significantly over the past five years
High Priority 125.9 125.1 129.1 124.7 117.0 116.3 include Welfare Check, Stolen Vehicle, Unwanted Person, Behavioral
PPB Calls for Service by 1,000 Population Health, and Suspicious Behavior.
450
The growth in these types of calls can largely be attributed to broader
400
350
societal issues regarding houselessness, drug addiction, and mental
300
health services which especially affect vulnerable and lower income
250 communities.
200
Call types that have decreased significantly over the past five years
150
include Disturbance and Traffic Collisions.
100
2010 2011 2012 2013 2014 2015 2016 2017 2018 2019 2020
Dispatched Officer-Initiated
Information on call types can be found at:
https://www.portlandoregon.gov/police/article/676725Police Calls For Service Over Time
PPB Dispatched Call Data per 1,000 Population It is important to note that calls regarding Crime tend to be Low
2015 2016 2017 2018 2019 2020
priority, while Disorder calls tend to drive Medium and High priority.
Total Dispatched Calls 394.8 386.5 405.9 403.1 400.3 355.8
Low Priority Calls 158.2 152.1 159.5 161.9 173.4 147.2 The increase in low priority calls can largely be attributed to growth in
Civil 10.0 8.8 8.8 9.2 10.4 10.2 the call types Stolen Vehicle, Suspicious Behavior, Welfare Check,
Crime 63.2 62.9 66.0 66.6 70.4 64.1
Disorder 48.4 44.5 48.9 51.5 55.6 40.3 Unwanted Person, and Assist.
Other 11.0 10.0 9.7 9.8 9.9 9.6
Assist 1.3 1.6 1.7 2.2 3.0 2.8
The decrease in medium priority calls are driven mostly by drops in
Community Policing 0.4 0.4 0.5 0.4 0.4 0.7 the call types Suspicious Behavior, Theft, Assist, and Traffic Collision,
Alarm 15.5 15.2 15.4 15.0 15.4 13.0 somewhat offset by growth in Welfare Check and Unwanted Person.
Traffic 8.3 8.7 8.6 7.1 8.3 6.6
Medium Priority Calls 110.6 109.4 117.3 116.5 109.9 92.4 The increase in Suspicious Behavior, Welfare Check, Unwanted
Civil 1.0 1.0 0.9 1.1 1.2 0.9 Person, and Assist can all be attributed to broader issues regarding
Crime 14.5 13.8 14.5 14.6 11.9 10.5 houselessness, addiction, and mental health.
Disorder 66.0 66.2 74.4 75.4 72.0 62.2
Other 1.7 1.8 1.7 1.8 1.8 2.0 The increase in Stolen Vehicle can be attributed to an Oregon court
Assist 9.1 8.2 8.1 7.6 7.2 5.4
case making it more difficult to arrest and prosecute people caught
Community Policing 0.0 0.0 0.0 0.0 0.0 0.0
Alarm 0.1 0.1 0.1 0.1 0.1 0.1 driving stolen vehicles. The effects of addiction and houselessness
Traffic 18.2 18.3 17.5 16.0 15.6 11.2 also play a role.
High Priority Calls 125.9 125.1 129.1 124.7 117.0 116.3
Civil 7.3 8.0 8.7 10.1 10.7 9.6
High Priority calls have seen an increase in the call type Behavioral
Crime 16.9 16.6 17.6 17.2 15.4 19.0 Health and a decrease in Disturbance.
Disorder 81.3 79.9 82.1 77.8 72.2 71.2
Other 0.2 0.2 0.1 0.1 0.1 0.1 This shift in high priority call types is largely driven by a
Assist 7.1 7.3 7.6 7.5 7.2 6.2 reclassification of Disturbance calls to Behavioral Health calls, helping
Community Policing 0.0 0.0 0.0 0.0 0.0 0.0 ensure that properly trained officers are sent to calls involving a
Alarm 4.6 4.6 4.8 4.6 4.4 4.3
Traffic 8.6 8.5 8.2 7.5 6.9 5.8
mental health issue.Response Times for Dispatched Calls
PPB Dispatched Call Response Times (In Minutes)
2015 2016 2017 2018 2019 2020
Ave. Response Time 22.3 25.7 27.8 26.9 26.8 38.0
High Priority
Response Time 7.3 8.1 8.7 8.5 8.3 10.6
Time in Queue 1.5 1.8 2.1 2.0 1.9 3.8
Response times for calls for service climbed during the first half of the
Travel Time 5.8 6.3 6.6 6.6 6.4 7.0
Under 5 Minutes 41% 36% 32% 33% 34% 29% decade and have largely been stable for the period of 2016 through
5-10 Minutes 40% 41% 42% 42% 42% 40% 2019.
10-15 Minutes 12% 14% 15% 15% 15% 17%
15-30 Minutes 6% 8% 9% 8% 8% 10% Beginning in 2017, the PPB began a concerted effort to lower call
Over 30 minutes 1% 2% 2% 2% 2% 4% response times via putting in place a number of strategies, which led
Medium Priority
to some moderate success, especially with medium and low priority
Response Time 14.9 17.8 19.6 17.7 15.9 26.9
Time in Queue 7.6 10.2 11.6 9.9 8.8 20.6 dispatched calls.
Travel Time 7.5 7.9 8.2 8.0 7.3 7.7
Under 5 Minutes 21% 18% 15% 17% 21% 17%
Due to budget cuts, retirements, officers leaving to other police
5-10 Minutes 32% 29% 27% 30% 30% 27% departments, and ongoing protests response times became
10-15 Minutes 17% 17% 17% 17% 17% 16% significantly longer in 2020 with some low priority calls taking over 24
15-30 Minutes 19% 21% 23% 21% 19% 19%
hours to respond, or not getting responded to at all during the
Over 30 minutes 11% 15% 18% 15% 13% 22%
Low Priority summer and early fall.
Response Time 39.4 45.9 49.4 47.7 46.2 66.7
Time in Queue 29.4 35.5 39.1 37.5 37.2 60.0
Travel Time 10.4 10.7 10.7 10.5 9.5 8.9
Under 15 minutes 27% 24% 22% 24% 26% 24%
15-30 Minutes 27% 26% 24% 24% 24% 21%
30-45 minutes 17% 16% 16% 16% 15% 14%
45-60 minutes 10% 10% 11% 10% 10% 9%
More than 60 minutes 19% 24% 27% 26% 25% 32%Crimes Reported to Police Over Time
PPB Reported Crimes per 1,000 Population During the 2015-2019 period overall crime in Portland remained
2015 2016 2017 2018 2019 2020
relatively unchanged compared to population. However, shifts did
Person Crimes 13.37 13.14 13.92 14.75 15.13 14.12
Assault 12.22 12.00 12.60 13.45 13.86 13.08 occur in the types of crime committed.
Homicide 0.05 0.03 0.04 0.04 0.05 0.09
Human Trafficking 0.01 0.02 0.05 0.03 0.04 0.03 Person crimes increased during this period, driven by an increase in
Kidnapping/Abduction 0.12 0.11 0.12 0.13 0.07 0.10 Assaults, which can largely attributed to broader issues involving
Sex Offenses 0.91 0.95 1.06 1.08 1.06 0.78 houselessness, addiction, and mental health.
Sex Offenses, Nonforcible 0.06 0.03 0.04 0.03 0.05 0.03
Property Crimes 75.31 74.89 76.85 75.58 72.21 73.69 Property crimes decreased, with an increase in Motor Vehicle Theft
Arson 0.32 0.39 0.49 0.43 0.39 0.75
more than countered by decreases in Larceny and Fraud. Motor
Bribery 0.01 0.00 0.00 0.01 0.00 0.00
Burglary 6.02 6.22 6.83 6.69 6.38 8.17 Vehicle Theft has been on the rise since an Oregon court case made it
Counterfeiting/Embezzlement 1.37 1.12 1.20 1.12 1.24 0.73 more difficult to prosecute people found driving stolen cars.
Embezzlement 0.11 0.21 0.21 0.25 0.24 0.10
Extortion/Blackmail 0.02 0.04 0.04 0.04 0.05 0.03 The increase in Motor Vehicle Theft can be attributed to an Oregon
Fraud 7.93 8.17 5.41 6.71 5.29 5.36 court case making it more difficult to arrest and prosecute people
Larceny 40.30 39.25 39.43 38.20 37.42 34.03
caught driving stolen vehicles. The effects of addiction and
Motor Vehicle Theft 7.49 8.36 11.60 10.81 9.98 9.84
Robbery 1.44 1.61 1.66 1.66 1.51 1.48 houselessness also play a role.
Stolen Property 0.23 0.19 0.14 0.11 0.15 0.09
Vandalism 10.06 9.32 9.84 9.56 9.57 13.09 Society crimes have remained relatively unchanged.
Society Crimes 4.58 4.08 3.84 4.09 3.88 2.86
Animal Cruelty 0.06 0.06 0.03 0.05 0.05 0.04
Due to COVID-19 and civil unrest, 2020 is an outlier with most types
Drug/Narcotic 3.24 2.79 2.69 2.73 2.63 1.47 of reported crime decreasing, with the exception of Homicide, Arson,
Gambling 0.00 0.00 0.00 0.00 0.00 0.00 Burglary, and Vandalism. It will take time to ascertain the long-term
Pornography/Obscene Material 0.03 0.04 0.04 0.09 0.11 0.11
effects on crime of the events of 2020.
Prostitution 0.33 0.33 0.36 0.29 0.07 0.04
Weapon Law 0.91 0.87 0.72 0.92 1.02 1.19
Total Reported Crimes 93.26 92.11 94.62 94.42 91.22 90.66
Reported Crime data can be found at:
https://www.portlandoregon.gov/police/71978FBI Long-Term Crime Trends for Portland
2020 data is not yet available from the FBI, so only data up to 2019 is
shown in the tables.
Violent crime per capita dropped significantly between 1985 and
1999, followed by a steady decrease until largely stabilizing in 2009.
Violent crimes per capita have dropped some 77% since 1985,
following trends seen throughout the United States.
Property crime per capita dropped significantly between 1985 and
2009, with sharp drops between 1988 and 1990, 1997 and 2001, and
2004 and 2009.
Property crime per capita has dropped some 64% since 1985,
following trends seen throughout the United States.
FBI Crime data can be found at:
https://ucr.fbi.gov/crime-in-the-u.sCrime Victimization and Other Inequities
Black and Indigenous residents in Portland are more likely to be
the victims of major crimes (Homicide, Forcible Sexual Offense,
Robbery, and Aggravated Assault) compared to other racial and
ethnic groups.
2019 Demographics Share of Population by Race This is a function of socio-economic issues, with these groups
Native also being much more likely to be living in poverty and/or be
Asian Black Hispanic American White houseless.
PDX Population 9.8% 7.1% 9.3% 1.8% 70.5%
PDX Major Crime Victims 4.8% 18.5% 9.7% 1.2% 65.2% This is the result of long-standing societal issues related to
Multnomah Co. Houseless Population 1.4% 16.2% 10.2% 10.2% 58.8%
systemic racism which has limited the inter-generational
Multnomah Co. Median Income 62,191 31,286 47,908 41,835 70,402
PDX Injury Traffic Collisions 6.3% 11.1% 10.5% 0.1% 71.7% accumulation of wealth by these groups.
PDX Police Custodies 2.9% 22.2% 7.2% 2.1% 65.7%
Groups such as immigrants, the houseless, and those
experiencing mental heath issues are also more likely to be the
victims of crimes for reasons related to their relative
vulnerability, socio-economic issues, and political status.
Crime victimization rates are likely higher for all of these groups
given that studies show crimes affecting Black, Indigenous,
migrant, and houseless individuals are less likely to be reported
to police.Rise in Shootings and Homicides
PDX Shootings and Homicides Between 2020 and 2019 in Portland, shootings have increased
Total Shootings All
Homicides in Select Major U.S. Cities
127%, shootings resulting in injuries have increased 140%, and
Shootings Injuries Homicides
Jan-19 33 7 2 2020 2019 % Change homicides have increased 63%.
Feb-19 31 7 3 Milwaukee 193 98 97%
Mar-19 32 2 1 Minneapolis 81 48 69% Nearly half of homicide victims in 2020 have been Black.
Apr-19 26 5 6 Portland 57 35 63%
May-19 37 9 4 Seattle 50 31 61%
The increase in homicides is not isolated to Portland, with most
Jun-19 31 7 3 New Orleans 195 121 61% major U.S. cities reporting some level of increase, though
Jul-19 36 9 3 Atlanta 157 99 59% Portland is on the higher end.
Aug-19 41 12 5 Chicago 769 495 55%
Sep-19 32 8 2 Memphis 290 191 52% The exact cause of this increase is hotly debated, with people’s
Oct-19 28 6 3 Denver 95 63 51% arguments and conclusions dependent upon their views of the
Nov-19 33 6 1 New York 462 319 45%
Dec-19 33 10 2 Indianapolis 244 171 43%
defunding the police movement. Likely there are a number of
Jan-20 51 12 1 Houston 400 282 42% interconnected factors at play.
Feb-20 38 8 0 Los Angeles 349 253 38%
Mar-20 23 8 2 Tulsa 77 56 38% Early pre-June increases in shootings are likely largely
Apr-20 48 4 0 Las Vegas 195 149 31% attributable to rising tensions related to COVID. These tensions
May-20 42 13 2 San Jose 44 34 29% were further exacerbated by the George Floyd protests which
Jun-20 62 9 5 Cincinnati 94 73 29%
Jul-20 103 35 15 Dallas 251 210 20% began in late May.
Aug-20 122 36 7 Washington DC 198 166 19%
Sep-20 119 27 7 Detroit 327 275 19%
It is likely that some groups and individuals took advantage of
Oct-20 88 19 8 San Francisco 48 41 17% severely strained police resources during the protests to
Nov-20 98 17 3 Salt Lake City 15 14 7% violently deal with grudges, sparking a cycle of retribution. The
Dec-20 99 24 7 Baltimore 335 348 -4%
defunding of the Gun Violence Reduction Team without any
Shootings doesn't include suicide attempts
Homicides include those not involving guns viable replacement being put into place likely exacerbated this.
Shootings data can be found at:
https://www.portlandoregon.gov/police/81203Traffic Violations
Portland Traffic Enforcement Data per 1,000 Population Except for in 2018, deaths from traffic accidents involving motor
2016 2017 2018 2019 2020
vehicles, bicycles, and pedestrians have been rising over the past
Traffic Deaths 0.07 0.07 0.05 0.08 0.08
Traffic Deaths - Total Number 42 47 35 50 54 five years.
Received Traffic Calls 36.17 35.21 30.18 28.50 21.14
Crash - Non-injury 12.04 11.09 10.44 10.55 7.06 During the same period, received calls regarding traffic issues
Hit and Run - Past Occurrence 11.36 11.87 8.45 6.93 4.88 have fallen while traffic enforcement actions declined in 2017,
Crash - Injury 4.96 5.07 4.56 4.65 3.87 but have since remained stable.
Hit and Run - Active 3.73 3.42 3.23 2.91 2.68
Crash - Unknown Injury 2.75 2.32 2.05 2.08 1.52 Speeding is by far the most common traffic violation cited, with
DUII 1.34 1.41 1.42 1.40 1.10
30% of enforcement actions involving speeding in 2019.
Enforcement Actions 31.44 17.14 20.30 23.75 23.02
Speed 10.88 4.94 5.85 7.03 9.19 Enforcement actions remained largely unchanged in 2020,
Unauthorized Driving 2.80 1.75 2.13 2.52 2.83
Distracted 2.48 1.66 2.38 3.30 2.23
though with speeding violations increasing to 40% of
Driving Uninsured 2.36 1.37 1.73 2.02 2.03 enforcement actions.
Safety Belt 2.42 1.49 1.71 1.38 1.45
Plate Violation 1.79 0.93 1.32 1.85 1.43 In 2019, crashes involving injuries and no injuries accounted for
Traffic Control Devices 3.43 1.95 1.99 2.23 1.13 61% of traffic calls, while hit and run accounted for 35%.
Equipment 1.07 0.58 0.73 0.74 0.44
Stolen Vehicles 8.09 11.21 9.84 9.71 9.71 Traffic calls dropped further in 2020, with all traffic call types
Recovered within 30 days 79% 82% 82% 82% 77% declining significantly.
Recovered to date 93% 96% 95% 95% 89%
Traffic data can be found at:
https://www.portlandoregon.gov/police/76503
https://www.portlandoregon.gov/police/article/642890
https://www.portlandoregon.gov/police/74369Stops Data
PPB Stops per 1,000 Population
2015 2016 2017 2018 2019 2020
Stopped Drivers 66.7 51.8 34.9 45.2 50.3 40.0
Stopped drivers includes anyone stopped by PPB while operating
Traffic Division 39.0 30.2 16.7 20.2 22.1 23.0 a motor vehicle. Stopped drivers can include traffic law
Non-Traffic Divisions 27.7 21.6 18.2 25.0 28.2 17.0 enforcement as well as investigating suspicious behavior, stolen
Pedestrian Stops 0.5 0.4 0.3 0.9 1.7 0.4
vehicles and other crimes.
Traffic Division 0.1 0.2 0.1 0.1 0.1 0.1
Non-Traffic Divisions 0.3 0.2 0.2 0.8 1.6 0.3 Pedestrian stops are any interactions with pedestrians not
Total Stops 67.2 52.2 35.2 46.1 52.0 40.4
associated with a call for service and where the officer has
reasonable suspicion that an individual has or is about to commit
a crime.
Between 2015 and 2019, the number of stopped drivers per capita
fell 25%, this has been entirely due to a 43% drop in stops by the The Traffic Division is specially assigned to provide focused traffic
Traffic Division with non-traffic division stops remaining steady. enforcement in areas specifically identified as having high rates
of vehicle accidents, speeding, and other traffic issues.
During the same time period pedestrian stops have increased
240%, driven by growth in stops by non-traffic divisions, though Stops by other divisions include patrol officers initiating stops to
the number of these stops remains relatively limited. help prevent and reduce crime and respond to citizen concerns
and complaints. They can range from patrol officers enforcing
The year 2020 saw a drop in all types of stops due to COVID-19, traffic rules in their patrol area to detectives investigating
protests, and related resource issues, with the exception of the specific crimes. The data does not discern between patrol stops
Traffic Division. However, this is likely not to continue in 2020 and targeted stops.
given the Traffic Division was cut in early 2021 in order to fulfill
core patrol needs throughout the city.
Stops data can be found at:
https://www.portlandoregon.gov/police/65520Inequities in Stops Data
Stops Data by Race for 2019 (Not Including GVRT)
Stops Results of Search Result of Stop
The Traffic Division stops a higher portion of the Black population
Subject Contraband Drugs/Alco. Stolen Pr. Weapon Warning Citation relative to other groups, but this in line with the annual rate of
# % Searched Found Found Found Found Issued Issued Arrested
Traffic Division injury collisions, suggesting this is the result of socio-economic
Asian
Black
816
1,637 11%
6% 0.0%
1.8%
0.0%
0.7%
0.0%
0.5%
0.0%
0.1%
0.0%
0.2%
17.0% 81.9%
13.7% 81.8%
0.9%
3.7%
differences in where traffic violations occur, which influence where
Hispanic 1,431 10% 1.0% 0.6% 0.3% 0.0% 0.2% 11.0% 86.9% 1.8% Traffic Division officers are assigned.
Native American 31 0% 0.0% 0.0% 0.0% 0.0% 0.0% 12.9% 83.9% 3.2%
White
Other
10,441 71%
273 2%
0.6%
0.7%
0.3%
0.0%
0.2%
0.0%
0.0%
0.0%
0.0%
0.0%
14.7% 83.7%
17.2% 82.1%
1.3%
0.7%
While not more likely to be issued a warning or citation, Black and
Total 14,629 0.7% 0.3% 0.2% 0.0% 0.1% 14.4% 83.6% 1.6% Native American populations are more likely to be arrested by the
Non-Traffic Divisions
Asian 807 5% 2.4% 0.6% 0.4% 0.1% 0.2% 78.8% 15.1% 3.5% Traffic Division, though the overall number of arrests is limited.
Black 3,392 19% 8.0% 3.3% 2.5% 0.2% 0.6% 75.2% 13.1% 8.0%
Hispanic 1,753 10% 6.6% 2.6% 2.2% 0.1% 0.6% 73.0% 14.0% 7.0% Stops by non-traffic divisions are significantly higher for the Black
Native American 130 1% 6.9% 3.1% 1.5% 0.0% 0.0% 73.8% 15.4% 7.7%
White 11,414 64% 6.7% 3.3% 2.6% 0.3% 0.6% 75.7% 12.7% 7.4% population relative to other groups, similar to disparities seen in
Other 436 2% 2.3% 0.7% 0.7% 0.2% 0.0% 80.7% 14.4% 3.4% overall custody rates.
Total 17,932 6.6% 3.1% 2.3% 0.3% 0.5% 75.8% 13.1% 7.3%
All Stops
Asian 1,623 5% 1.2% 0.3% 0.2% 0.1% 0.1% 47.8% 48.7% 2.2% The Black population is not significantly more likely to be issued a
Black
Hispanic
5,029 15%
3,184 10%
6.0%
4.1%
2.5%
1.7%
1.9%
1.4%
0.2%
0.0%
0.5%
0.4%
55.2% 35.4%
45.1% 46.8%
6.6%
4.6%
warning, citation, or be arrested as a result of a stop involving non-
Native American 161 0% 5.6% 2.5% 1.2% 0.0% 0.0% 62.1% 28.6% 6.8% traffic divisions.
White 21,855 67% 3.8% 1.8% 1.4% 0.2% 0.3% 46.6% 46.6% 4.5%
Other
Total
709
32,561
2% 1.7%
4.0%
0.4%
1.6%
0.4%
1.3%
0.1%
0.1%
0.0%
0.3%
56.3% 40.5%
48.2% 44.8%
2.4%
4.7%
The Black population is more likely to be searched by the Traffic
Note: Stops Data includes vehicle and pedestrian stops, vehicle stops account for 97% of all stops. Division and the Black and Native American populations are more
Note: Search result data not available for separate Traffic and Non-Traffic Divisions
Note: GVRT is the Gun Violence Reduction Team. likely to be searched by non-traffic divisions.
2019 Portland Stops Benchmarks Arrests resulting from stops account for 5% to 7% of all arrests for
PDX PDX Major Injury Police
Population Crime Victims Collisions Custodies each group, with the exception of the Hispanic population where
Asian 10% 5% 6% 3%
Black 7% 19% 11% 22%
they account for 9%.
Hispanic 9% 10% 11% 7%
Native American 2% 1% 0% 2%
White 70% 65% 72% 66%Gun Violence Reduction Team Stops
Gun Violence Reduction Team Stops in 2019 24% of subjects stopped were searched, which 51% of the time
Stops Results of Search Result of Stop
Subject Contraband Drugs/Alco. Stolen Pr. Weapon Warning Citation
resulted in contraband being found. This included weapons 13%
# % Searched Found Found Found Found Issued Issued Arrested of the time and drugs/alcohol 43% of the time.
Asian 45 3% 13.3% 6.7% 4.4% 0.0% 2.2% 93.3% 0.0% 6.7%
Black 837 52% 29.9% 14.8% 13.0% 0.6% 3.5% 87.9% 1.1% 9.0% The Black population accounted for 52% of GVRT stops, though it
Hispanic 164 10% 29.3% 14.6% 14.6% 2.4% 4.3% 87.8% 0.6% 11.6%
Native American 18 1% 16.7% 0.0% 0.0% 0.0% 0.0% 94.4% 0.0% 5.6%
has been reported that the Black population accounted for a
White 517 32% 15.1% 8.5% 7.2% 1.0% 2.1% 88.8% 0.8% 8.9% similar share of shooting victims and suspects.
Other 24 1% 29.2% 20.8% 8.3% 4.2% 12.5% 79.2% 0.0% 20.8%
Total 1,605 24.4% 12.5% 10.8% 0.9% 3.2% 88.3% 0.9% 9.3% The Black and Hispanic population were significantly more likely
to be searched when stopped by the GVRT, more likely to be
The Gun Violence Reduction Team (GVRT) was a team of detectives found holding contraband, more likely to be found with drugs or
and patrol officers assigned to investigate and mitigate gun violence alcohol, but not more likely to be carrying a weapon.
in Portland. Prior to 2019 it was called the Gang Enforcement Unit. The Black and Hispanic population were not more likely to be
Responded to 54% of shooting incidents in 2019. Following a shooting arrested when stopped.
would canvass neighborhood for witnesses, security footage, and Data is not available regarding the reasoning behind stopping an
forensic evidence. individual, how many individuals were involved in multiple stops
While part of the GVRT’s focus was detectives investigating crimes, over the course of a year, and what crimes individuals were
another portion was patrol officers using traffic stops as a reason to charged with when taken into custody.
search subjects in the areas near shooting incidents. The GVRT was disbanded in July of 2020, though portions of it,
99% of GVRT stops involved a traffic violation with 55% occurring in specifically regarding investigations, was put back in place of
East Portland and 39% in North Portland. GVRT accounted for less February of 2021.
than 5% of total police stops.
GVRT data can be found at:
https://www.portlandoregon.gov/police/article/778670Custodies and Uses of Force
Force data does not include force used at crowd control events.
Between 2015 and 2019, custodies have fallen in relation to
PPB Custody and Use of Force Data actual numbers, per calls for service, and per capita.
2015 2016 2017 2018 2019 2020
Portland Population 613,355 627,395 639,100 648,740 657,100 664,605 Due to COVID-19 and limited patrol resources, custodies in 2020
Calls for Service 380,738 344,879 351,910 360,001 363,730 308,883
fell even more dramatically to possibly never before seen lows. It
Custodies 27,291 24,304 22,857 24,396 23,504 14,900
Custodies per 1,000 Population 44.5 38.7 35.8 37.6 35.8 22.4 has yet to be seen if these lower levels will continue.
Custodies per 1,000 Calls for Service 71.7 70.5 65.0 67.8 64.6 48.2
Uses of Force
Between 2015 and 2019, the number of subjects experiencing
Subjects of Force - Original Types 772 755 595 489 458 372 police force have fallen significantly, continuing a trend that
Subjects of Force - New Types 930 803 652 began over a decade ago. This decline includes actual numbers,
Uses of Force per 1,000 Custodies
per custody, per calls for service, and per capita.
Subjects of Force - Old Types 28.3 31.1 26.0 20.0 19.5 25.0
Subjects of Force - New Types 38.1 34.2 43.8 Over the past decade, the usage of most types of force have
Uses of Force per 1,000 Calls for Service
Subjects of Force - Original Types 2.03 2.19 1.69 1.36 1.26 1.20 dropped by 75% or more, with many types of force dropping
Subjects of Force - New Types 2.58 2.21 2.11 90% or more. This drop is due to enhanced de-escalation training
Uses of Force per 1,000 Population and directives put into place by the DOJ Settlement Agreement.
Subjects of Force - Original Types 1.26 1.20 0.93 0.75 0.70 0.56
Subjects of Force - New Types 1.43 1.22 0.98 In 2020, the use of force continued to decline in relation to calls
for service and per capita, but rose per custody. This is due to an
even sharper drop in custodies and the fact that police likely
focused on higher priority calls during this period that were more
likely to result in a use of force being required.
Custody and Use of Force Data can be found at:
https://www.portlandoregon.gov/police/76875
https://www.portlandoregon.gov/police/62708Use of Force by Type
Subjects Experiencing Police Force
2015 2016 2017 2018 2019 2020
Custodies 27,291 24,304 22,857 24,396 23,504 14,900 Force data does not include force used at crowd control events.
Subjects of Force - Original Types 772 755 595 489 458 372
Subjects of Force - All Types (1) 930 803 652
PPB broadened its definition of a reportable use of force in
Holds With Injury 27 19 13 1 2 2 Quarter 3 of 2017, making direct comparisons for the total use of
Strikes / Kicks 90 67 49 38 62 47 force difficult over time.
Original Force Types
Maximum Restraint (3) 29
Aerosol Restraint 29 23 18 18 12 21 Review of the original force types shows that the use of most
CEW 72 94 58 40 52 53 have declined since 2015, continuing trends that began as early
K-9 Bite 16 12 10 26 17 14
Pointing of Firearm 390 359 326 153 76 58
as 2008.
Takedown - Old (2) 310 303
Impact Weapon - Old (2) 12 6
One of the more significant of these declines has been in the use
Takedown - New (2) 175 236 171 of pointing of firearm, which fell from over 1,000 subjects in
Original Types
Sub-dividied
Controlled Takedown (2) 126 94 68 2008, to 310 in 2015, to 58 in 2020.
Impact Weapon - Strike (2) 0 1 0
Less Lethal (2) 16 11 28 The decline has largely been in thanks to improved de-escalation
Baton-Nonstrike (2) 3 2 2 training and directives put in place over the past decade, as well
Resisted Handcuffing 362 356 272
New Force Types
Hobble Restraint 26 42 18
as improved use of force data reporting starting in 2015. These
Controlled Against Resistance 448 427 303 reforms were largely put in place due to the 2012 DOJ
PIT 19 12 23 Settlement Agreement.
Vehicle Ramming 1 2 3
Box-in 49 32 47
(1) New types of force first measured in Quarter 3 of 2017
(2) Definitions changed when new types of force added in Quarter 3 of 2017
(3) Removed from usage in early 2015Use of Force Long Term Trends
Number of FDCR Force Cases
FDCR Force Cases Comparison
Pointing of Strikes/ Maximum Control Hold Aerosol Less Baton
FDCR Calls for FDCR per FDCR per
Total Firearm Takedown CEW Kicks Restraint w/Injury Restraint Lethal Strike
Cases Service Custodies 1000 Calls 1000 Custodies
2008 1,677 813 539 378 215 76 59 58 25 13
2008 1,677 398,761 35,476 4.2 47.3
2009 1,477 709 426 324 205 56 51 70 35 11
2009 1,477 406,408 33,204 3.6 44.5
2010 1,278 589 372 301 150 64 58 54 23 7
2010 1,278 402,343 29,806 3.2 42.9
2011 1,116 509 341 228 143 76 34 70 13 12
2011 1,116 389,777 28,919 2.9 38.6
2012 1,039 484 377 156 141 70 43 50 11 10
2012 1,039 365,391 31,488 2.8 33.0
2013 852 434 259 110 115 59 43 32 9 6
2013 852 365,859 33,201 2.3 25.7
2014 732 386 286 72 114 46 28 22 9 5
2014 732 382,028 32,951 1.9 22.2
2015 699 390 310 72 90 6 27 29 7 5
2015 699 380,738 27,291 1.8 25.6
2016 684 459 470 106 86 N/A 22 29 6 2
2016 684 344,879 24,304 2.0 28.1
2017 553 329 231 56 51 N/A 13 19 10 2
2017 553 351,910 22,857 1.6 24.2
2018 490 153 301 40 38 N/A 1 18 16 0
2018 490 358,626 24,426 1.4 20.1
2019 459 76 330 52 62 N/A 2 12 17 1
2019 459 365,717 23,561 1.3 19.5
2020 372 58 239 53 47 N/A 2 21 33 2
2020 372 309,215 14,910 1.2 24.9
Note: FDCR Force Cases can involve multiple subjects.
Note: Does not include new force types introduced in Quarter 3 of 2017
Note: Maximum Restraint discontinued in April of 2015.Attributes of Subjects Experiencing Force
Overall the use of force by the PPB has declined by a large
Attributes of Subjects Experiencing Original Force Types
degree for all groups of concern over the past five years.
2015 2016 2017 2018 2019 2020
Uses of force have declined for all racial groups. However,
Total 772 755 595 489 458 372
Gender inequities in the relative likelihood of some groups experiencing
Male 684 647 516 433 395 318 a use of force have largely remained unchanged.
Female 88 106 89 67 65 59
Race The use of force on individuals experiencing a mental health
Asian 21 11 22 18 7 7 crisis and individuals under the influence of drugs and alcohol
Black 211 227 170 131 123 105
have dropped significantly, as have the severity of the types of
Hispanic 56 58 63 53 38 32
Native American 13 14 7 6 5 9 force used. This is in large part thanks to the creation of the ECIT
White 467 440 337 288 286 222 and other reforms from the DOJ Settlement Agreement.
Other Attribute (1)
Mental Health Crisis 132 168 56 62 63 50 Uses of force involving subjects who are armed have also
Transient (2) 295 322 266 253 254 184 declined as the PPB has adopted enhanced de-escalation training
Drugs/Alcohol 313 310 251 225 192 184
and protocols.
Armed 242 249 180 197 167 163
(1) Subjects may exhibit more than one attribute. While uses of force involving transients (houseless and those
(2) Transient includes houseless and those refusing to provide an address.
refusing to give an address) have declined, the decline has been
less pronounced. This is likely due to police interactions with
transients increasing over the same period of time.Inequities in the Use of Force
2018 Comparison of Portland Custodies and Use of Force by Race
City Police Police Use Force per Cust. per Force per Inequities are driven by officer bias, biases of other parts of the
Demo. Custodies of Force 1000 Cust. 1000 popul. 1000 popul. legal system, biases of the public requesting police services, and
Total 648,740 23,504 796 38.1 37.6 1.4 socio-economic inequities driven by long-term systemic bias.
Asian 9.4% 2.8% 3.8% 45.3 10.7 0.5
Black 7.0% 23.6% 32.5% 46.7 120.5 5.6
These factors are inter-connected, making it difficult to ascertain
Hispanic 9.3% 7.8% 10.4% 45.4 29.9 1.4 a central driver of inequities in the public safety system.
Native American 1.9% 2.2% 0.5% 7.8 40.8 0.3
White 71.0% 66.7% 67.3% 34.2 33.6 1.1 By comparing use of force to custodies, a proxy measure for
police interactions, it is possible to remove all factors not related
2019 Comparison of Portland Custodies and Use of Force by Race to the actions of officers and the actions of the individuals who
City Police Police Use Force per Cust. per Force per
experience a use of force.
Demo. Custodies of Force 1000 Cust. 1000 popul. 1000 popul.
Total 657,100 23,504 803 34.2 35.8 1.2 Using this measure shows that though the overall use of force
Asian 9.8% 2.9% 1.7% 20.8 10.4 0.2
Black 7.1% 22.0% 29.0% 45.0 111.2 5.0
has declined over time, the Black population has consistently
Hispanic 9.3% 7.1% 8.0% 38.3 27.3 1.0 experienced a statistically significant higher level of force
Native American 1.8% 2.1% 1.6% 26.5 40.8 1.1 compared to the White population over the past five years.
White 70.5% 65.3% 58.7% 30.7 33.1 1.0
Higher levels of force noted for the Hispanic and Native
2020 Comparison of Portland Custodies and Use of Force by Race American populations are not statistically significant in most
City Police Police Use Force per Cust. per Force per
years due to the relatively low number of individuals
Demo. Custodies of Force 1000 Cust. 1000 popul. 1000 popul.
Total 664,605 14,900 652 43.8 22.4 1.0 experiencing a use of force.
Asian 9.9% 3.3% 2.5% 32.8 7.4 0.2
Black 7.1% 22.0% 27.1% 54.1 69.0 3.7
Hispanic 9.3% 7.9% 8.6% 47.6 19.0 0.9
Native American 1.9% 1.8% 2.5% 58.6 22.2 1.3
More detailed analysis on the use of force:
White 70.6% 64.1% 58.1% 39.7 20.4 0.8
https://www.portlandoregon.gov/police/article/763834
https://www.portlandoregon.gov/police/article/765706Inequities in Custodies and Interactions
2018 Comparison of Portland Custodies and Use of Force by Race While inequities in the subjects of force per custody ratio are
City Police Police Use Force per Cust. per Force per concerning, the data shows a much larger source of inequities
Demo. Custodies of Force 1000 Cust. 1000 popul. 1000 popul. are the relative rate of custodies to population, especially for the
Total 648,740 23,504 796 38.1 37.6 1.4
Asian 9.4% 2.8% 3.8% 45.3 10.7 0.5
Black and Native American populations.
Black 7.0% 23.6% 32.5% 46.7 120.5 5.6
This inequity has been especially significant for the Black
Hispanic 9.3% 7.8% 10.4% 45.4 29.9 1.4
Native American 1.9% 2.2% 0.5% 7.8 40.8 0.3 population, which over the past four years is an average of 240%
White 71.0% 66.7% 67.3% 34.2 33.6 1.1 more likely to be taken into custody than the White population.
This has a significant impact on the Black populations ability to
2019 Comparison of Portland Custodies and Use of Force by Race increase inter-generational wealth.
City Police Police Use Force per Cust. per Force per
Demo. Custodies of Force 1000 Cust. 1000 popul. 1000 popul. Inequities are driven by officer bias, biases of other parts of the
Total 657,100 23,504 803 34.2 35.8 1.2
Asian 9.8% 2.9% 1.7% 20.8 10.4 0.2
legal system, biases of the public requesting police services, and
Black 7.1% 22.0% 29.0% 45.0 111.2 5.0 socio-economic inequities driven by long-term systemic bias.
Hispanic 9.3% 7.1% 8.0% 38.3 27.3 1.0 These factors are inter-connected, making it difficult to ascertain
Native American 1.8% 2.1% 1.6% 26.5 40.8 1.1 a central driver of inequities in the public safety system.
White 70.5% 65.3% 58.7% 30.7 33.1 1.0
Inequities in custodies and police interactions significantly
2020 Comparison of Portland Custodies and Use of Force by Race amplify inequities in the use of force experienced by the Black
City Police Police Use Force per Cust. per Force per
Demo. Custodies of Force 1000 Cust. 1000 popul. 1000 popul.
population.
Total 664,605 14,900 652 43.8 22.4 1.0
Asian 9.9% 3.3% 2.5% 32.8 7.4 0.2
Though not directly tracked by available data, similar disparities
Black 7.1% 22.0% 27.1% 54.1 69.0 3.7 in custodies and police interactions are known to exist for
Hispanic 9.3% 7.9% 8.6% 47.6 19.0 0.9 transients and those experiencing mental health issues. An
Native American 1.9% 1.8% 2.5% 58.6 22.2 1.3 estimated 50% of custodies involve transients, of which half
White 70.6% 64.1% 58.1% 39.7 20.4 0.8
involve a subject being arrested for an outstanding warrant.Inequities in the Legal System
The inequity in police custodies is the starting point to inequities
2019 Multnomah County Safety and Justice Challenge Legal System Demographics seen throughout the justice system, with the Black population
Total White Black Hispanic Nat. Am. Asian representing a significantly larger portion of people moving
Adult Population (18+) 658,979 74.0% 5.8% 10.0% 0.9% 9.3%
Number of Jail Bookings 26,819 63.1% 22.8% 9.3% 1.9% 2.9%
through every step of the legal system compared to their relative
Cases Referred to DA's Office 20,095 62.4% 24.1% 10.2% 0.7% 2.6% population.
Cases Accepted for Prosecution 12,429 62.3% 23.5% 10.6% 0.7% 2.8%
Total Cases Arraigned 12,082 62.2% 23.7% 10.5% 0.7% 2.8% Black and Hispanic populations are slightly more likely to be
Number of Cases Convicted 4,075 63.6% 22.9% 10.5% 0.7% 2.3%
referred to the DA’s office after being jailed, but otherwise their
Cases Sentenced to Prison 256 62.5% 25.4% 10.5% 0.0% 1.6%
Cases Sentenced to Jail 1,122 61.1% 25.1% 10.6% 0.8% 2.3% relative rates moving through the next steps of legal system
Cases Sentenced to Probation 1,322 65.1% 20.4% 11.3% 0.5% 2.7% remain fairly consistent in terms of cases being accepted for
Cases Sentenced to Conditional Discharge 483 69.6% 19.9% 7.5% 1.4% 1.7%
Cases Sentenced to Monetary Judgment 658 61.7% 24.6% 10.5% 0.9% 2.3% prosecution, and convictions.
However, this data does not account for the larger fines and
longer prison sentences experienced by the Black population,
2019 Multnomah County Safety and Justice Challenge Legal System Rates with estimates showing the Black population in Multnomah
Total White Black Hispanic Nat. Am. Asian
Cases Referred to DA's Office 20,095 12,538 4,840 2,048 150 519 County paying fines 44% higher than the White population, with
Cases Accepted for Prosecution 61.9% 61.8% 60.4% 64.4% 60.0% 67.4% many types of lower levels fines more than double. Reports also
Total Cases Arraigned 60.1% 60.0% 59.1% 62.2% 58.7% 65.5%
Number of Cases Convicted 20.3% 20.7% 19.3% 20.9% 19.3% 17.9% indicate that the Black population is more likely to be cited for
Cases Sentenced to Prison 1.3% 1.3% 1.3% 1.3% 0.0% 0.8% low level violations.
Cases Sentenced to Jail 5.6% 5.5% 5.8% 5.8% 6.0% 5.0%
Cases Sentenced to Probation 6.6% 6.9% 5.6% 7.3% 4.0% 6.9% Collectively, the inequities in custodies, citations, prison
Cases Sentenced to Conditional Discharge 2.4% 2.7% 2.0% 1.8% 4.7% 1.5%
Cases Sentenced to Monetary Judgment 3.3% 3.2% 3.3% 3.4% 4.0% 2.9%
sentencing, and fines create a significant barrier to the building
Note: Measuring what number of refferred cases move forward through the legal system. of inter-generational wealth by the Black population.
Data reports can be found at:
https://www.documentcloud.org/documents/6559824-Multnomah-R-E-D-Analysis-2019-Final-November-19.html
https://www.invw.org/2017/02/02/being-black-in-multnomah-county/Deadly Force Incidents
PPB Deadly Force Incidents Expectations of the DOJ Settlement Agreement were that by reducing the
2015 2016 2017 2018 2019 2020
overall use of force then deadly force incidents would decline as well.
Subjects of Deadly Force 6 2 6 6 6 2
Race of Subject However, this has not proven to be the case. Deadly force incidents have
White 6 2 3 5 5 2 remained relatively unchanged.
Black 0 0 3 1 1 0
Result of Deadly Force Deadly force incidents are relatively rare, but have a significant effect on
Fatal Injury 3 1 2 3 5 0 the subjects involved, the families and friends of those involved, the
Injury 2 0 3 3 0 0
No Injury 1 1 1 0 1 2
represented communities, and Portland as a whole.
Subject Armed
Deadly force events are unique events which represent a cataclysmic
Firearm 1 2 0 2 0 0
Firearm-Replica 1 0 3 1 0 1 failure of the public safety and many other systems meant to provide for
Knife/Cutting Instrument 3 0 1 2 6 0 the public good, such as mental health and addiction services.
Blunt Object 0 0 0 0 0 0
Unarmed 0 0 2 0 0 0 Collective analysis of deadly force incidents is difficult on a year-to-year
Undisclosed 1 0 0 1 0 1 basis, necessitating the use of a five-year average at minimum.
Subject Percieved Armed 5 2 5 5 6 1
Subject Actually Armed 5 2 4 5 6 1 Five-year data shows that the Black population is 192% more likely to be
Subject Fired at Officers 1 2 0 2 0 0 involved in a deadly force incident than the White population. However,
Deadly Force Incidents comparing deadly force incidents to custodies, a proxy measure for police
5 Year Average 2016-2020 interactions, shows relatively no difference, indicating that disparities in
Total White Black the use of deadly force are driven by inequities in police interactions
Population 647,388 456,800 46,200
Calls for Service 345,881
rather than the biases of officers involved in a deadly force incident.
Total Custodies 21,992 14,357 4,773
Deadly Force Incidents 4.4 3.4 1.0
Deadly Force per 1,000 Population 0.0068 0.0074 0.0216
Deadly Force per 1,000 Calls for Service 0.012
Detailed information on deadly force incidents:
Deadly Force per 1,000 Custodies 0.196 0.235 0.198
https://www.portlandoregon.gov/police/76940You can also read