ANALYSIS OF FOOD AND FARMING ASSETS IN THE GOLDEN HORSESHOE
←
→
Page content transcription
If your browser does not render page correctly, please read the page content below

STRATEGY. ACTION. RESULTS.

 GOLDEN HORSESHOE FOOD AND FARMING ALLIANCE / SEPTEMBER 10, 2015

 ANALYSIS OF FOOD AND
 FARMING ASSETS IN THE
 GOLDEN HORSESHOE

 Ontario AgriCentre, Suite 109, 100 Stone Road West, Guelph Ontario, Canada N1G 5L3
 Ph 519-822-7272 E info@synthesis-network.com synthesis-network.com
Table of Contents
Executive Summary ................................................................................................................... 3
Introduction and Approach ........................................................................................................10
Agri-food Employment in the Golden Horseshoe Region ..........................................................12
Agri-food Occupational Trends in the Golden Horseshoe Region .............................................17
 Trends by NOC-S Codes .......................................................................................................18
 Trends by NAICS Codes .......................................................................................................20
Sector Competitiveness and Growth .........................................................................................26
 Shift-Share Competitiveness Changes ..................................................................................33
Enablers and Inhibitors .............................................................................................................36
Food Trends Overview ..............................................................................................................38
Subsector Analysis ...................................................................................................................44
 Farms ....................................................................................................................................45
 Grain/Milling/Bakery Sector ...................................................................................................47
 The Sugar/Confectionery Value Chain...................................................................................51
 The Meat Processing Value Chain ........................................................................................53
 Fruit and Vegetable ...............................................................................................................56
 Equine ...................................................................................................................................63
Observations and Conclusions ..................................................................................................69
Recommendations ....................................................................................................................73
Appendix ...................................................................................................................................75
 NOC-S Code Descriptions .....................................................................................................75
 NAICS Code Descriptions .....................................................................................................77
 Occupation Trends by NOC-S Code ......................................................................................78

 This project was funded in part through Growing Forward 2 (GF2), a federal-provincial-
territorial initiative. The Agricultural Adaptation Council assists in the delivery of GF2 in Ontario.

 PAGE 2

Executive Summary The analysis of the food and farming sector in the Golden Horseshoe (GH) area has re- confirmed that it is a diverse and dynamic sector that contributes a significant benefit to the region and the overall economy. It has also revealed some alarming trends that point to challenges in the sector that need additional support. Agri-food Employment An analysis of both NOC-S occupational data as well as NAICS industry classification data revealed a few common trends in the agri-food sector. There are no significant changes in the occupation breakdown (type of jobs) from 2011 to 2014. The City of Toronto contains 39% of the agri-food sector employment in the Golden Horseshoe region. Peel Region contains 18% of these jobs. Agri-food employment in both regions is primarily retail and food service related jobs. The other 43% of the jobs are distributed relatively equally across the remaining five regions. Grocery retail and food service related occupations continue to dominate employment in the sector representing 72% of agri-food employment in the region. While grocery retail and food service jobs are strong in numbers, these are largely lower-wage service jobs that are driven by population growth and the strength of the local economy. Economic development efforts are likely better focused at the primary farm production and processing levels of the value chain which can grow the local economy by serving regional, provincial, national and export markets. This increases the resiliency of the local economy by diversifying the sources of wealth. Agri-food Occupational Trends The subsectors with the most employment growth between 2011 and 2014 are at the retail end of the supply chain. These increases are a function of overall population growth in the GH, particularly in the densely populated urban areas. Conversely, the subsectors with the biggest declines between 2011 and 2014 are close to the primary production end, such as farm and The initial steps food processing. In some cases, these decreases may be due to of the value chain automation or increased productivity within a particular sector (such drive significant as increasing farm size or food plant automation). These jobs in economic impact primary production end of the value chain are of critical importance because they drive significant additional economic impact within the region. PAGE 3

The following table illustrates the main steps in the Golden Horseshoe agri-food value chain: Employment is generally decreasing at the Employment is generally increasing in the farm and processing segments of the agri-food distribution and access segments, driven value chain. mainly by population growth. This is a key focus area to stabilize and grow. Sector Competitiveness and Growth Two metrics that can be used to provide a view of the industry’s performance over time are Location Quotient and Competitive Effect. Provincial Location Quotient (PLQ) compares the relative concentration in the local region to the concentration in the provincial economy. The Competitive Effect (CE) is being used as a relative measure of performance of an industry over a period of time. Using these two indicators, sectors can be divided into four general categories: Gaining (top left quadrant) Thriving (top right quadrant) Diminishing (bottom left quadrant) Moderating (bottom right quadrant) The following figure shows the PLQ and CE for the key sectors outlined in the 2013 report. The size of the bubbles indicates the number of jobs within the industry. PAGE 4
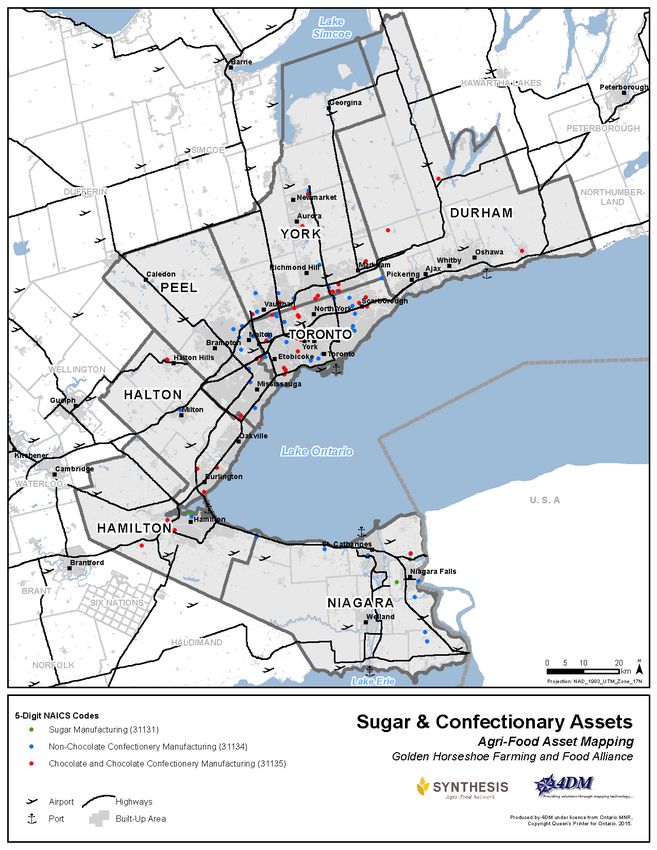
The shift share competiveness analysis illustrates a few gains for the agri-food sector, but the comparison with the 2013 report shows some alarming trends in several key sectors. Change from 2013 to 2015 Report Six Focus Sectors 4,000 3,000 Farms Bakeries & Tortilla Competitive Effect Mfg 2,000 1,000 Grain & Oilseed Milling 0 Sugar & Meat Confectionery Mfg -1,000 Product Fruit & Veg Mfg Preserving -2,000 0.0 0.5 1.0 1.5 2.0 2.5 3.0 Provincial Location Quotient Sub-Sector Analysis Key sub-sector analysis trends revealed: Farms has dropped from “gaining” to the “diminishing” quadrant – the sector lost more jobs than expected. Key challenges are related to urban growth and increasing rural residences. Bakeries and tortilla manufacturing, has dropped from “thriving” to “moderating”. Similarly it has lost more jobs than expected. Challenges in this sector include stagnant overall demand for bakery products and increasing popularity of gluten free diets which has reduced the traditional bread market somewhat. Canada Bread, one of the largest companies in this sector, recently modernized and consolidated to one larger, more efficient plant. To put it in perspective, the grain to bakery value chain remains the largest agri- food sub-sector in the GH region and a major opportunity for the future. Sugar and confectionery product manufacturing remains in the “moderating” quadrant but is losing ground to the sector provincially. One contributing factor is the 2014 closing of a Redpath Sugar blending facility in Niagara Falls, which relocated operation to Belleville. Meat product manufacturing, the second largest sub-sector, has improved its relative performance compared to 2013, but is still underperforming compared to the rest of the province. Several of the core meat processing assets located in the core the GTA are facing pressure from energy costs and residential growth. PAGE 5

Fruit and Vegetable processing shows a mixed result of reduced PLQ but increased competitive effect. Jobs decreased significantly in part due to recent plant closures in the GH Region. High cost of production, including energy costs, labour costs and regulations have been identified as challenges for these operations. There appears to be a major gap in processing capacity for this sector which is hampering growth. The gap has been filled with imported products in many formats (fresh, frozen, canned) from the US and other areas such as Mexico and China. Despite these downward trends, the fruit and vegetable sector has a window of opportunity for investment attraction because of recent drought in California, Canadian dollar exchange rate and demand for local food. Beverage manufacturing and beverage merchant wholesalers have both increased their position and are now in the “thriving” quadrant. Increases in the number of wineries and micro-breweries during this time period have been a strong contributor to this growth. Other food manufacturing has increased its position compared to the 2013 report and is now in the “thriving” quadrant, attributed to the growing trend toward convenience and specialty food and regional population growth. Enablers and Inhibitors There are a number of factors that will either enable or inhibit the further growth and development of the Agri-Food cluster in the Golden Horseshoe. The following is a high level overview of these forces impacting the sector. Enablers Inhibitors Workforce - The large, diverse population of Energy Prices - Energy costs in Ontario, the GH is a potential source of workers especially electricity are among the highest of any jurisdiction in North America Water - The Great Lakes Basin has the Transportation - Surface transportation largest source of fresh water in the world routes in the GH are increasingly congested, resulting in unreliable travel times in a sector where reliable delivery times are critical Micro-climates - The GH has a range of Access to water - Despite abundant micro-climates that have advantages for a supplies, the level of human water takings in range of different crops the Great Lakes Basin is rising towards a level of concern Climate Change - Most long range models Inertia - The long-term trend in the GH is are predicting that southern Ontario will contraction of the agriculture and food become warmer and wetter, which will help processing sectors increase crop diversity Food Trends - Ontario is well positioned to Gentrification – Condominiums are slowly take advantage of the trends leading towards replacing industry along Toronto’s lakeshore, increased convenience, increased health and and prime farming areas are being replaced PAGE 6

environmental attributes, and increased with a peri-urban zone, which can conflict
 demand for global flavours with agri-food activities
 Proximity to Consumers - The GH is Regulations - Regulations at all levels of
 positioned centrally within one of the largest government create challenges and costly
 populations in North America delays for food and beverage businesses
 Canadian Dollar - The recent weakness in Market Risks – Some farmers are reluctant
 the Canadian Dollar relative to the US dollar to try new crops or enter new markets due to
 is giving producers and processors an production risks, memories of past plant
 advantage in domestic and export markets closures, and reluctance to commit high-
 value land for a long-term crop (e.g. new
 orchard)

Food Trends
There are several “demand-side” trends that offer growth opportunities for the businesses in and
around the GH region. These trends build on the demographic changes that the general
population in Canada is older, more educated and more ethnically diverse than in the past. In
addition, the awareness of health and wellness is increasing, as is the desire to understand
more about ingredients, nutritional content and food origin.

Any sub-sector growth opportunities and economic development activities should be in line with
food trends to maximize the possibility for success. Key food trends that will impact the demand
for agriculture and food products in the GH region include:

 PAGE 7
Conclusion and Recommendations

 Grow The Cluster - Increase agri-food production, investment and
 employment on a shrinking land base in a sustainable manner.

Our analysis has revealed many opportunities for economic development of the agri-food sector
in the GH Region. Each of these opportunities to grow the cluster is based on an overarching
theme of increasing employment, investment and production value on a shrinking land base, but
doing so in a sustainable manner.

 Further increasing
On average, the GH Region already produces higher value crops
than most Ontario farms due to quality soils, great climate and
 the average
proximity to market 1. Our conclusion is that further increasing the
 43F
 production value
average production value per acre be a key economic development per acre should be
focus for the GH Region. a key focus.

Food, beverage and bio-product processing operations also add additional value to the
agricultural products produced on farms and create significant economic impact through
domestic sales of food ingredients and finished products, bio-products as well as export sales.

While primary agricultural production and processing (manufacturing) are only the initial steps in
the agri-food sector, they are key economic drivers that can spur additional benefits, growth,
and resiliency further down the value chain.

In conclusion, the following three strategies offer significant growth opportunities for the food
and farming sector in the GH Region:

1 Agriculture By The Numbers, GHFFA information sheet 2014

 PAGE 8
Food and Farming Asset - Strategy Summary

 Grow The Cluster – Increase agri-food production, investment and employment on a shrinking land base in a
 sustainable manner
 Strategy Sector Focus Enablers & Inhibitors Recommendations and Requirements
 Food Trends Energy Prices Conduct feasibility study on increasing
 Grain/Milling/Bakery
 capacity for further processing (e.g. IQF)
1. Increase further Proximity to Transportation
 Meat
processing Consumers Identify “at-risk” sub-sectors and develop
capacity through Gentrification strategies for business retention.
 Sugar/Confectionary
business retention Canadian Dollar
and investment Regulations Requirements:
 Fruit and Vegetable
attraction Workforce (Municipal and Efficient transportation (water, rail, truck)
 Provincial) Competitive energy costs
 Beverage
 Reduced / coordinated regulations
 Fruit and vegetable production Food Trends Access to Water Investigate feasibility to increase processing
 (fresh and processing market) (for irrigation) capacity (e.g. IQF, slicing, packaging)
 Climate Change
2. Increase Transportation Greenhouse vegetable production market
average Greenhouse vegetables Micro-climates assessment
production value Gentrification
per acre with high World vegetables (field or Water New markets education program
value crops greenhouse) Market Risks
 Workforce Requirements:
 Nursery, tree and ornamentals (for Access to water for irrigation
 landscaping) Local food demand creation
 Proximity to Market Risks Increase consumer awareness and education
 Consumers
 Local food
 Regulations Market local food opportunities
3. Further develop Food Trends (Municipal and
on-farm value Provincial) New markets education program
added and farm Climate Change
 Value added / gourmet products
direct sales by Equine sector development plan
creating demand
for local food Requirements:
 Local food demand creation
 Equine (and support services)

 PAGE 9

Introduction and Approach

This report includes an updated analysis of trends in employment and occupations, as well as
an analysis and mapping of assets in several subsectors in the agri-food value chain in the
Golden Horseshoe region. This report builds on the information originally presented in a 2013
Agri-Food Asset Mapping for The Golden Horseshoe report.

In addition to the asset mapping project database, this analysis uses non-spatial datasets from
the Ontario Ministry of Agriculture, Food, and Rural Affairs (OMAFRA) EMSI Analyst tool
version 2015.1, as well as Statistics Canada to understand the trends and structure of the agri-
food value chain in the region. The data available at the regional municipality level includes
employment trends by National Occupation Classification System (NOC-S) and industry size
distribution by North American Industry Classification System (NAICS) code. The employment
trends by NOC-S code can be used as a reasonable substitute for overall economic activity and
thus provides an indication of the health of the agri-food sector in the region.

The agriculture value chain for this project includes the full spectrum, from primary production
agriculture and services to agriculture through to food services such as restaurants and
institutions, as defined by the GHFFA. A list of the NAICS and NOC-S codes used for this
analysis is included in the appendix of this report.

Approach
The GHFFA Action Plan 2021 encompases the following five opportunities for the sector.
 A. GROW THE CLUSTER -
 o Grow the Golden Horseshoe cluster so it becomes the leading food and farming
 cluster in the world, renowned for healthy and safe products.
 B. LINK FOOD, FARMING AND HEALTH
 o Educate current and future consumers about the importance of locally sourced
 food and farming products for enhancing their health and well-being.
 C. FOSTER INNOVATION
 o Encourage and support innovation to enhance the competitiveness and
 sustainability of the Golden Horseshoe food and farming cluster.
 D. ENABLE THE CLUSTER
 o Align policy tools and their application to enable food and farming businesses to
 be increasingly competitive and profitable.
 E. CULTIVATE NEW APPROACHES
 o Pilot new approaches to support food and farming in the Golden Horseshoe.

 PAGE 10
The analysis of food and farming assets in this report has focussed mainly on the “Grow The
Cluster” pillar of the Action Plan 2021. Some of the observations and strategies can also be
applied to the “Foster Innovation” and “Cultivate New Approaches” pillars.

Our approach for the analysis involved the following steps:

 II. Sector
 Competitiveness &
 • Asset Map Database Trend Analysis • Observations and
 Review Conclusions
 • Economic Profile • Sector Competitiveness • Food and Farming
 Review Analysis Strategy
 • Employment Trend • Enablers and Inhibitors
 Analysis • Food Trends Overview
 • Sub-sector Analysis
 III. Observations
 I. Current Situation
 and
 Analysis
 Recommendations

Figure 1

This report analyzes the overall state of employment and the competitiveness of the food and
farming industry in the GH relative to the rest of the province. For example, this analysis
identifies which sectors within the agri-food value chains are growing or declining in the region,
how sectors are performing relative to other economic regions in Ontario, and key changes in
performance since the original report in 2013. It is important to recognize the trends and forces
that are impacting the sector. A high level overview of key enablers, inhibitors and food trends is
also provided in this report.

In addition, several key sub-sectors identified in the 2013 report that demonstrated changes in
employment trends were further investigated: the grain/flour/bakery value chain, the meat
processing value chain, the sugar/confectionary value chain and primary production agriculture
(farms). In addition, fruit and vegetable production as well as the equine sector were
investigated as part of this report.

 PAGE 11
Agri-food Employment in the Golden Horseshoe Region Our analysis for this report started with a review of employment data for agri-food related jobs in the GH region using National Occupation Classification System (NOC-S) data. The agriculture value chain for this analysis and the asset map database includes the full value chain from primary agricultural production and food processing through to food service such as restaurants and institutions. As in the 2013 report, this illustrated that the sector is very diverse: diverse in the commodities that are produced and processed, diverse in the nature of the jobs contained within the sector, and diverse in the geographical distribution of the jobs. The figures in the following section present a number of different views of the distribution of employment in the agri-food sector in the GH region. Key Findings There are no significant changes in the occupation breakdown by region from 2011 to 2014. The City of Toronto continued to have the highest agri-food sector employment of the regions, representing 39% of the total jobs within the Golden Horseshoe region and made up of mostly retail and food service related jobs. Peel Region has the second highest level of employment, 18% of the total jobs. Similarly, this includes a significant number of retail and food service related jobs. The other 43% of the jobs are distributed relatively equally across the five regions and are relatively similar in size in terms of number of jobs. Retail and food service-related occupations continue to make up the largest portion of overall employment in the sector representing 72% of total jobs. However, these are largely lower-wage service jobs that are driven by population growth and the strength of the local economy. Economic development efforts are likely better focused at the primary farm production and processing levels of the value chain which can grow the local economy by serving regional, provincial, national and export markets. This increases the resiliency of the local economy by diversifying the sources of wealth. PAGE 12
The following two figures show the occupational breakdown for each region within the GH for
2011 and 2014 (the most recent data available). As one would expect for such a short time
period, there are no significant changes in the occupation breakdown by region from 2011 to
2014. The City of Toronto continues to have the highest agri-food sector employment of the
regions based on the size of food service related occupations and the overall population. The
City of Toronto represents 39% of total jobs followed by Peel Region with 18% and York region
with 13%. The other 30% of jobs are distributed relatively equally across the four regions and
are relatively similar in size in terms of number of jobs.

 2011 Agri-food Occupational Totals by Region
 Durham
 7%
 Hamilton
 7% Niagara
 9% York
 13%
 Halton
 8%

 Peel
 18% Toronto
 38%

Figure 2: EMSI Analyst - Q1 2015 Data Set – 198,688 total jobs

 2014 Agri-food Occupational Totals by Region
 Niagara Durham
 8% 7%
 Hamilton
 7%
 York
 Halton 13%
 8%

 Peel
 18%
 Toronto
 39%

Figure 3: EMSI Analyst - Q1 2015 Data Set – 222,643 total jobs

 PAGE 13
For a deeper look at the types of jobs within the agri-food sector, the following figures illustrate
the occupational breakdown by job type using NOCS code data. Food service related jobs such
as food counter attendants, food and beverage servers, restaurant managers and chefs account
for the top four agri-food occupations with a total of 158,333 jobs in 2014.

Food manufacturing related jobs, such as food and beverage labourers, process control,
machine operators, butchers and bakers account for four of the top ten occupations with 43,941
jobs. Landscaping and grounds maintenance jobs made up almost 22,000 jobs in 2014.
Farmers, farm managers and general farm workers accounted for 8,798 jobs in 2014.

.

 2014 Occupational Breakdown by Job - GH Region
 Supervisors,
 food, beverage General farm workers
 and tobacco
 processing Farmers and farm
 managers Other
 Landscaping and grounds
 maintenance contractors
 and managers

 Butchers, meat cutters and
 fishmongers, retail and
 wholesale Food counter attendants,
 kitchen helpers and related
 Bakers occupations

 Food service supervisors

 Process control and
 machine operators, Food and beverage servers
 food and beverage
 processing

 Labourers in food,
 beverage and tobacco
 processing

 Landscaping and grounds
 maintenance labourers Restaurant and food
 Chefs
 service managers

Figure 4: EMSI Analyst - Q1 2015 Data Set – 267,743 total jobs

 PAGE 14
2014 Occupational Rank by Job - GH Region

 Number of Jobs
 0 20,000 40,000 60,000 80,000

 Food counter attendants, kitchen helpers and… 71,590
 Food and beverage servers 41,839
 Restaurant and food service managers 27,699
 Chefs 17,205
 Landscaping and grounds maintenance labourers 14,451
 Labourers in food, beverage and tobacco… 12,243
 Process control and machine operators, food and… 12,242
 Food service supervisors 11,700
 Bakers 10,615
 Butchers, meat cutters and fishmongers, retail… 8,841
 Landscaping and grounds maintenance… 7,507
 Supervisors, food, beverage and tobacco… 4,963
 Farmers and farm managers 4,554
 General farm workers 4,244
 Landscape and horticultural technicians and… 2,963
 Nursery and greenhouse workers 2,859
 Veterinarians 2,562
 Industrial butchers and meat cutters, poultry… 2,509
 Testers and graders, food and beverage processing 2,083
 Supervisors, landscape and horticulture 1,236
 Farm supervisors and specialized livestock workers 968
 Supervisors, fabric, fur and leather products… 951
 Nursery and greenhouse operators and managers 622
 Agricultural and fish products inspectors 527
 Harvesting labourers 304
 Agricultural representatives, consultants and… 178
 Agricultural and related service contractors and… 88
 Labourers in fish processing 71
 Grain elevator operators 42
 Fish plant workers 35
 Aquaculture operators and managers 20
 Silviculture and forestry workers 18
 Aquaculture and marine harvest labourers 14
 Tobacco processing machine operators 0

Figure 5: EMSI Analyst - Q1 2015 Data Set – 267,743 total jobs

A full description of the job names in the above figure is available in the Appendix.

 PAGE 15
The wide range of jobs included in the previous figures can be aggregated into groups or steps in the value chain to simplify the analysis. The jobs have been combined into the following categories: Primary production The initial steps of Processing the value chain Hotels, Restaurants and Institutions drive significant economic impact Retailers Services to the agriculture industry Miscellaneous (such as landscaping, etc…) This analysis shows that primary production and services to agriculture account for only 8% of total jobs in the GH region. The next step in the value chain, grain and food processing, makes up 13% of total jobs. The jobs in these initial steps of the value chain are of critical importance because they drive significant additional economic impact within the region. For example, grain that is produced by farmers in the GH Region is likely to be further processed nearby. Examples of this include wheat milling in Peel Region, corn wet milling in Niagara and soybean crushing in Hamilton. These processing operations add additional value to the grain and create significant economic impact through domestic sales of food ingredients and finished products as well as export sales. Retail and food service related occupations dominate employment in the sector representing 72% of agri-food employment in the region. While these jobs are important and do create a significant economic impact because of the sheer size of this part of the sector, the additional economic impact driven by these jobs is not as large as with the steps earlier in the value chain. These jobs are driven mainly by population and demographic make-up of a local community. 2014 Occupational Breakdown by Value Chain - GH Region 1% 3% 8% 7% 1. Primary Production 13% 2. Processing 3. Hotels, Restaurants, and Institutions 4. Retailers 5. Services to Ag Industry 6. Misc. (Landscaping) 68% Figure 6: EMSI Analyst - Q1 2015 Data Set – 267,743 total jobs PAGE 16
Agri-food Occupational Trends in the Golden Horseshoe
Region

Changes in occupational data provide a high level view into how an industry is structurally
changing over time. These trends can point out segments of the agri-food value chain that are
contracting and expanding and give a general indication of the overall health of a supply chain.
In some cases, where occupations are declining but production or output has been maintained,
it is a signal that the sector is automating or increasing productivity in some way (such as
increased crop yield). This section of the report utilized both NOC-S occupational data as well
as NAICS industry data to show various views for a 10 year period from 2004 to 2014 as well as
projections for future trends to 2021.

The highest overall percentage growth is for veterinarians (2,562 jobs) at almost 400% growth
followed by landscape and horticultural technicians (2,963 jobs) at 175% and chefs (17,205
jobs) at over 100% growth.

The majority of the occupation increases are close to the
 The majority of occupation
distribution or “access” end of the value chain. Food service
 increases are at the
related jobs such as chefs, servers, food counter attendants,
 distribution end of the
and food service supervisors have all increased significantly
 value chain, likely a
during this period. While these positions are a positive for the
 function of overall
agri-food sector and the economy, they are likely a function of
 population growth
overall population growth and not as directly tied to the rest of
the agri-food value chain in the GH region specifically.

Veterinarians shows a large percentage growth despite livestock production in the GH region
having not increased during this time. The vast majority of these positions are assumed to be
small animal related and consumer focused, rather than large animal or agricultural focused
practices. While this is an interesting finding, it is likely not an opportunity that can be further
developed to advance the agri-food sector in the GH region.

The largest percentage decreases have been in harvesting labourers (304 jobs) at over 70%
reduction followed by nursery and greenhouse operators and managers (622 jobs) with a 60%
reduction. In both cases, production in these sectors has not dropped by the same level so it is
likely that harvesting automation or part time seasonal labour are filling this gap.

The majority of the decreases are in the agriculture production area such as greenhouse
workers, farm supervisors, nursery and greenhouse operators, harvesting labour, agricultural
related services. In addition, food manufacturing jobs, such as process control and machine
operators, butchers and fish plant workers have also decreased significantly.

 PAGE 17
Trends by NOC-S Codes
The following two figures show the percentage change in jobs for the period 2004-2014 sorted
by occupation size.

 Percentage Change in Jobs by Sector, with
 actual number of jobs in 2014
 (2004 - 2014)
 (150%) (50%) 50% 150% 250% 350%
 Food counter attendants, kitchen… 71,590
 Food and beverage servers 41,839
 Restaurant and food service managers 27,699
 Chefs 17,205
 Landscaping and grounds maintenance… 14,451
 Labourers in food, beverage and… 12,243
 Process control and machine… 12,242
 Food service supervisors 11,700
 Bakers 10,615
 Butchers, meat cutters and… 8,841
 Landscaping and grounds maintenance… 7,507
 Supervisors, food, beverage and… 4,963
 Farmers and farm managers 4,554
 General farm workers 4,244
 Landscape and horticultural technicians… 2,963
 Nursery and greenhouse workers 2,859
 Veterinarians 2,562
 Industrial butchers and meat cutters,… 2,509
 Testers and graders, food and… 2,083
 Supervisors, landscape and horticulture 1,236
 Farm supervisors and specialized… 968
 Supervisors, fabric, fur and leather… 951
 Nursery and greenhouse operators and… 622
 Agricultural and fish products inspectors 527
 Harvesting labourers 304
 Agricultural representatives,… 178
 Agricultural and related service… 88
 Labourers in fish processing 71
 Grain elevator operators 42
 Fish plant workers 35
 Aquaculture operators and managers 20
 Silviculture and forestry workers 18
 Aquaculture and marine harvest labourers 14
 Tobacco processing machine operators 0

Figure 7: EMSI Analyst - Q1 2015 Data Set – 267,743 total jobs in 2014

Veterinarians show the highest overall percentage growth at close to 400% with 2,562 jobs. It is
assumed that the vast majority of these positions are small animal related and consumer
focused (rather than large animal or agricultural focused practices).

 PAGE 18
The following figure shows changes in jobs for the period 2004-2014 sorted by occupation size
with veterinarians removed.

 Percentage Change in Jobs by Sector, with actual
 number of jobs in 2014
 (2004 - 2014)
 (100%) (50%) 0% 50% 100% 150% 200%
 Food counter attendants, kitchen helpers… 71,590
 Food and beverage servers 41,839
 Restaurant and food service managers 27,699
 Chefs 17,205
 Landscaping and grounds maintenance… 14,451
 Labourers in food, beverage and tobacco… 12,243
 Process control and machine operators, food… 12,242
 Food service supervisors 11,700
 Bakers 10,615
 Butchers, meat cutters and fishmongers,… 8,841
 Landscaping and grounds maintenance… 7,507
 Supervisors, food, beverage and tobacco… 4,963
 Farmers and farm managers 4,554
 General farm workers 4,244
 Landscape and horticultural technicians and… 2,963
 Nursery and greenhouse workers 2,859
 Industrial butchers and meat cutters, poultry… 2,509
 Testers and graders, food and beverage… 2,083
 Supervisors, landscape and horticulture 1,236
 Farm supervisors and specialized livestock… 968
 Supervisors, fabric, fur and leather products… 951
 Nursery and greenhouse operators and… 622
 Agricultural and fish products inspectors 527
 Harvesting labourers 304
 Agricultural representatives, consultants and… 178
 Agricultural and related service contractors… 88
 Labourers in fish processing 71
 Grain elevator operators 42
 Fish plant workers 35
 Aquaculture operators and managers 20
 Silviculture and forestry workers 18
 Aquaculture and marine harvest labourers 14
 Tobacco processing machine operators 0

Figure 8: EMSI Analyst - Q1 2015 Data Set – 265,181 total jobs in 2014

An additional breakdown of the percentage change in agri-food jobs for the 2001-2004, 2005-
2009 and 2010-2014 time periods has been provided in the appendix of this report.

 PAGE 19
Trends by NAICS Codes
To get another perspective on the trends in agri-food related employment, analysis was
conducted using the first 3 digits of NAICS code which represents the industry subsector
category such as crop production or food manufacturing.

As in the 2015 asset map below, the sector was divided into four groups that encompass the
main steps in the value chain as follows:
 Farming (Green) Primary production Codes: 111, 112, 113
 Processing (Red) Food processing Codes: 311, 312
 Distribution (Blue) Food wholesaling and distribution Codes: 411, 413, 493
 Codes:444, 445, 447, 721, 722,
 Access (Orange) Grocery stores and restaurants
 711, 712, 713

Figure 9: Agri-food asset by industry type within the Golden Horseshoe.

Note: Some information in the asset map database is missing and underrepresents the sector,
such as number of farms (green) in all regions and access assets in the City of Toronto (yellow).

 PAGE 20
The following figure shows the percentage change in jobs along the value chain sorted
and colour coded into the four steps in the value chain.

 Job Growth along the Value Chain, 2011-2014, with total
 jobs in 2014

 Farming
 (30%) (20%) (10%) 0% 10% 20% 30% 40%

 Farms 16,368

 Animal food manufacturing 979

 Grain and oilseed milling 1,866
 Sugar and confectionery product
 3,643
 manufacturing
 Fruit and vegetable preserving and specialty
 4,310
 food manufacturing
 Dairy product manufacturing 3,826

 Meat product manufacturing 11,243

 Processing
 Seafood product preparation and packaging 164

 Bakeries and tortilla manufacturing 16,816

 Other food manufacturing 7,263

 Beverage manufacturing 8,414

 Tobacco manufacturing 580

 Farm product merchant wholesalers 2,256

 Distribution
 Food merchant wholesalers 31,380

 Beverage merchant wholesalers 1,962
 Cigarette and tobacco product merchant
 557
 wholesalers
 Lawn and garden equipment and supplies
 2,403
 stores
 Grocery stores 81,102

 Specialty food stores 12,613

 Beer, wine and liquor stores 7,701
 Access

 Spectator sports 4,169

 Other amusement and recreation industries 28,032

 Traveller accommodation 28,901
 Recreational vehicle (RV) parks and
 1,092
 recreational camps
 Special food services 24,034
 Full-service restaurants and limited-service
 187,332
 eating places

Figure 10: EMSI Analyst - Q1 2015 Data Set – 489,007 total jobs in 2014

 PAGE 21
The previous Figure 10 illustrates a few trends in the 2011 to 2014 period that are consistent with the analysis in the previous section of this report. The following is additional analysis on the biggest shifts in jobs shown in Figure 10: Farming (Green) employment has decreased o The decrease in farming related jobs is not a new trend, nor is it isolated to the GH Region, however this decrease is a significant drop in a short period of time. As will be shown later in this report, farm employment in the GH region is dropping faster than in other areas of the Province. Processing (Red) has generally decreased (with a few exceptions) o The largest decrease is in the fruit and vegetable preserving and specialty food manufacturing category. This comprises establishments that manufacture frozen fruits or vegetables, juices, frozen entrees, and vegetables preserved by pickling, canning or dehydrating. This sector is highly concentrated with only a few large processors operating in any particular crop, so one or two plant closures can have a significant impact on the number of jobs in this category. o Another decrease to watch is in the bakery and tortilla sector. While this is not a high percentage drop, it is the largest sub-sector and a key value- chain for the GH region. Challenges in this sector include stagnant overall demand for bakery products, changing product mix to due to demographics and growth of gluten free which can decrease traditional bakery operations who are not able to accommodate these products in their current plant. o Beverage manufacturing is showing a strong gain in jobs with a 15% increase to 8414 jobs. This is likely due to a combination of success stories such as brewery/microbrewery expansion, winery growth as well as other beverage products. o Tobacco manufacturing interestingly shows a high percentage gain, however it is a very low number of total jobs (580). Distribution (Blue) shows mostly increases (with a few decreases) o Farm merchant wholesalers comprises businesses who are primarily wholesaling livestock, grain and other farm products such as nursery stock and plants. This category is decreasing likely due to reduced production in some crops or livestock species in the GH Region. Large farms are also more able to sell products directly to a processor or customer, which can decrease the need for wholesalers or brokers in some cases. o Food merchant wholesalers is a sizeable and growing classification (31,380 jobs). This includes business that wholesale virtually any food product (except beverages) whether it is produced in Ontario, other provinces or imported. Growth is due to the expanding population base which drives overall demand with grocery retail stores, specialty stores and food service outlets (restaurants, institutions). PAGE 22
o Beverage merchant wholesalers is also growing, but it is a far smaller segment of the workforce. Access (Orange) employment has increased in most industry classifications o Grocery stores and full service restaurants are both providing significant job growth in the GH Region. As mentioned earlier, these are driven mainly by population growth and demographics as well as trends toward convenience foods. o Special food services is the fastest growth area with an increase of over 30%. This category is made up of business that provide food delivery or mobile services. Specifically, food services at the customer's location (catering) or from a vehicle or cart (such as a food truck), as well as contractors providing services to airlines and institutions, and concessions at sports venues. This is a significant job category with over 24,000 jobs and is growing rapidly. Similarly, the following figure shows the historical trend in employment by industry, summarized at the 3 digit NAICS code. Growth in employment has been primarily in the access (food service) sectors of the industry. Primary production and processing have been generally flat. Figure 11 also contains projections of employment change for 2015-2021 prepared by EMSI. Estimates show the general trends to continue in the future with less dramatic increases in the food service and distribution classes. Job Trends - Golden Horseshoe Region 350,000 11 - Agriculture* 300,000 31-33 - Manufacturing 250,000 200,000 41-49 - Wholesale, retail, transport and warehousing 150,000 51 - Professional, scientific, and technical 100,000 61 - Educational services 50,000 71-72 - Arts, entertainment, 0 recreation, accomodation, and food service Figure 11: EMSI Analyst - Q1 2015 Data Set Note: Figure 11 – Agriculture includes crop farming (111) and support activities (115) but excludes livestock farming (112) because of lack of data in the EMSI Analyst database. PAGE 23
Key Findings An analysis of both NOC-S occupational data as well as NAICS industry classification data revealed a few common trends in the agri-food sector: The subsectors with the most employment growth between 2011 and 2014 are at the retail end of the supply chain, e.g. Special food services +31%; Restaurants +13%; Grocery stores: +12%, etc. o These increases are a function of overall population growth in the GH, particularly in the densely populated urban areas. o While these increases are a positive for the GH region overall, these jobs are likely not linked directly back to the rest of the agri-food value chain in the GH region specifically. Conversely, the subsectors with the biggest declines between 2011 and 2014 are close to the primary production end, e.g. Farm product merchant wholesales -13%, Farms -5%; o With a few exceptions, employment in jobs related to primary agricultural production has declined during both the 2004 to 2014 and 2011 to 2014 time period. o In some cases, these decreases may be due to automation or increased productivity within a particular sector (such as increasing farm size or food plant automation). The employment forecast indicates that the general trends of the past few years are likely to continue in the future with less dramatic increases in the food service and distribution areas. PAGE 24
The following graphic illustrates the agri-food value chain and the employment trends for each step. Figure 12 Employment is generally Employment is generally decreasing increasing Examples: Examples: Farms Food merchant Fruit and vegetable wholesaler preserving and Beverage merchant specialty food wholesalers manufacturing Grocery stores Growth is likely a function of These initial steps of the value overall population growth, chain are crucial and drive especially in urban areas. significant economic impact. PAGE 25
Sector Competitiveness and Growth

Similar to the 2013 report, two metrics that can be used to provide a view of the industry’s
performance over time are Location Quotient and Competitive Effect.

Provincial Location Quotient (PLQ)
Location Quotient is a measure of the local concentration of an industry relative to the economy
as a whole. In this case, Provincial Location Quotient (PLQ) compares the relative concentration
in the local region to the concentration in the provincial economy.

 %
 =
 %

When the Provincial Location Quotient is greater than one, the
industry is more prevalent in the local economy than in the provincial When PLQ is greater
economy as a whole. Inversely, when the Provincial Location than one, the industry
Quotient is less than one, the industry is less prevalent in the local is more prevalent in the
economy than in the provincial economy as a whole. Location local economy than in
Quotient is measured at a point in time. In the case of this report, the the province.
Provincial Location Quotient for 2014 is being used.

Competitive Effect (CE)
The Competitive Effect is being used as a relative measure of performance of an industry over a
period of time. If the Competitive Effect is positive then there are more jobs in the industry at the
end of the period than would have been expected based on the change in the economy as a
whole and the performance of the industry in the economy as a whole.

A positive Competitive Effect can either mean the industry gained A positive CE means
more jobs than expected or it lost fewer jobs than expected. If the the industry gained
Competitive Effect is negative, then there are fewer jobs in the more jobs than
industry at the end of the period than would have been expected expected or lost fewer
based on the change in the economy as a whole and the jobs than expected.
performance of the industry in the economy as a whole.

A negative Competitive Effect can either mean the industry gained fewer jobs than expected or
it lost more jobs than expected.

 PAGE 26
Matrix Using these two indicators, sectors can be divided into four general categories: Figure 13 From an economic development perspective, the strategies for a particular industry differ depending on the classification. Thriving industries - the focus is on sustaining the competitive advantages the region provides. Moderating industries - the focus is on understanding what factors are reducing the competitive advantage of the region and trying to stem the reduction, if possible. Gaining industries - the focus is on identifying the factors that are creating the competitive advantage for the industry in the region and attempting to accelerate the growth of the industry. Diminishing industries - generally are not the focus of economic development programs and initiatives. The following tables and figures show the PLQ and CE for major industries in the GH region as outlined in the asset map definition of the agri-food value chain. The size of the bubbles indicates the number of jobs within the industry. PAGE 27
The table below shows the 2014 Location Quotient, the Competitive Effect, and the number of
jobs for each classification (also used in developing the bubble chart figures).

 2014
 Competitive 2014
 NAICS Description Location
 Effect Jobs
 Quotient
 4189 Other miscellaneous merchant wholesalers 2.00 1,661 18,617
 3254 Pharmaceutical and medicine manufacturing 1.86 242 10,526
 7223 Special food services 1.37 3,373 24,034
 4131 Food merchant wholesalers 1.34 4,105 31,380
 3121 Beverage manufacturing 1.33 1,091 8,414
 4931 Warehousing and storage 1.31 2,075 13,030
 5419 Other professional, scientific and technical services 1.30 504 28,685
 3119 Other food manufacturing 1.21 390 7,263
 6116 Other schools and instruction 1.15 327 30,310
 5417 Scientific research and development services 1.11 2,267 14,220
 4132 Beverage merchant wholesalers 1.04 85 1,962
 3122 Tobacco manufacturing 1.04 169 580
 Full-service restaurants and limited-service eating
 7225 0.91 6,053 187,332
 places
 6112 Community colleges and C.E.G.E.P.s 0.88 2,351 23,011
 4451 Grocery stores 0.87 9,388 81,102
 4133 Cigarette and tobacco product merchant wholesalers 0.86 63 557
 3115 Dairy product manufacturing 0.77 497 3,826
 3111 Animal food manufacturing 0.46 71 979
 1150 Support activities for farms 0.30 128 787
 3118 Bakeries and tortilla manufacturing 1.61 (755) 16,816
 3113 Sugar and confectionery product manufacturing 1.50 (1,105) 3,643
 7112 Spectator sports 1.33 (177) 4,169
 Fruit and vegetable preserving and specialty food
 3114 1.03 (450) 4,310
 manufacturing
 3112 Grain and oilseed milling 1.03 (9) 1,866
 4452 Specialty food stores 0.95 (287) 12,613
 5413 Architectural, engineering and related services 0.90 (2,796) 50,842
 3116 Meat product manufacturing 0.89 (86) 11,243
 7139 Other amusement and recreation industries 0.88 (988) 28,032
 4442 Lawn and garden equipment and supplies stores 0.85 (600) 2,403
 4453 Beer, wine and liquor stores 0.84 (225) 7,701
 6113 Universities 0.79 (4,217) 48,191
 7211 Traveller accommodation 0.73 (2,156) 28,901
 4111 Farm product merchant wholesalers 0.70 (858) 2,256
 4183 Agricultural supplies merchant wholesalers 0.35 (86) 1,316
 Farm, lawn and garden machinery and equipment
 4171 0.31 (24) 1,483
 merchant wholesalers
 Recreational vehicle (RV) parks and recreational
 7212 0.28 (45) 1,092
 camps
 1110 Farms 0.24 (245) 16,368
 Agricultural, construction and mining machinery
 3331 0.23 (132) 1,756
 manufacturing
 Pesticide, fertilizer and other agricultural chemical
 3253 0.22 (37) 330
 manufacturing

 PAGE 28
3117 Seafood product preparation and packaging 0.04 (56) 164
 TOTAL 732,110

The following figure shows the competitiveness versus provincial location quotient for all facets
of the GH agri-food sector as defined in the asset map database.

 Competitive Effect versus Provincial Location Quotient
 Golden Horseshoe 2010-2014
 12,000

 10,000
 15

 8,000

 6,000 13
 Competitive Effect

 4,000 19 18 4
 3
 38 14 10
 2,000 11 6
 1
 39
 12 5
 17 9 8 7 2
 0 40 16
 3027 25 22
 33 29 20
 34 28 21
 -2,000 37 36 35 32 24 23
 26
 -4,000 31

 -6,000
 0.0 0.5 1.0 1.5 2.0 2.5
 Provincial Location Quotient

Figure 14: EMSI Analyst - Q1 2015 Data Set

Note: A legend of the numbers and description is included on the following page.

 PAGE 29
Legend:

 ●1 Other miscellaneous merchant wholesalers
 ●2 Pharmaceutical and medicine manufacturing
 ●3 Special food services
 ●4 Food merchant wholesalers
 ●5 Beverage manufacturing
 ●6 Warehousing and storage
 ●7 Other professional, scientific and technical services
 ●8 Other food manufacturing
 ●9 Other schools and instruction
 ● 10 Scientific research and development services
 ● 11 Beverage merchant wholesalers
 ● 12 Tobacco manufacturing
 ● 13 Full-service restaurants and limited-service eating places
 ● 14 Community colleges and C.E.G.E.P.s
 ● 15 Grocery stores
 ● 16 Cigarette and tobacco product merchant wholesalers
 ● 17 Dairy product manufacturing
 ● 18 Animal food manufacturing
 ● 19 Support activities for farms
 ● 20 Bakeries and tortilla manufacturing
 ● 21 Sugar and confectionery product manufacturing
 ● 22 Spectator sports
 ● 23 Fruit and vegetable preserving and specialty food manufacturing
 ● 24 Grain and oilseed milling
 ● 25 Specialty food stores
 ● 26 Architectural, engineering and related services
 ● 27 Meat product manufacturing
 ● 28 Other amusement and recreation industries
 ● 29 Lawn and garden equipment and supplies stores
 ● 30 Beer, wine and liquor stores
 ● 31 Universities
 ● 32 Traveller accommodation
 ● 33 Farm product merchant wholesalers
 ● 34 Agricultural supplies merchant wholesalers
 ● 35 Farm, lawn and garden machinery and equipment merchant wholesalers
 ● 36 Recreational vehicle (RV) parks and recreational camps
 ● 37 Farms
 ● 38 Agricultural, construction and mining machinery manufacturing
 ● 39 Pesticide, fertilizer and other agricultural chemical manufacturing
 ● 40 Seafood product preparation and packaging

 PAGE 30
The following table shows selected components of the agri-food value chain that are directly
related to primary production and processing. Restaurants and grocery stores have been
removed to show more detail in the key agri-food sub-sectors.

 2014
 Competitive 2014
 NAICS Description Location
 Effect Jobs
 Quotient
 4189 Other miscellaneous merchant wholesalers 2.00 1,661 18,617
 3254 Pharmaceutical and medicine manufacturing 1.86 242 10,526
 7223 Special food services 1.37 3,373 24,034
 4131 Food merchant wholesalers 1.34 4,105 31,380
 3121 Beverage manufacturing 1.33 1,091 8,414
 3119 Other food manufacturing 1.21 390 7,263
 4132 Beverage merchant wholesalers 1.04 85 1,962
 3115 Dairy product manufacturing 0.77 497 3,826
 3111 Animal food manufacturing 0.46 71 979
 1150 Support activities for farms 0.30 128 787
 3118 Bakeries and tortilla manufacturing 1.61 (755) 16,816
 3113 Sugar and confectionery product manufacturing 1.50 (1,105) 3,643
 Fruit and vegetable preserving and specialty
 3114 1.03 (450) 4,310
 food manufacturing
 3112 Grain and oilseed milling 1.03 (9) 1,866
 4452 Specialty food stores 0.95 (287) 12,613
 3116 Meat product manufacturing 0.89 (86) 11,243
 4442 Lawn and garden equipment and supplies stores 0.85 (600) 2,403
 4111 Farm product merchant wholesalers 0.70 (858) 2,256
 4183 Agricultural supplies merchant wholesalers 0.35 (86) 1,316
 Farm, lawn and garden machinery and
 4171 0.31 (24) 1,483
 equipment merchant wholesalers
 1110 Farms 0.24 (245) 16,368
 Agricultural, construction and mining machinery
 3331 0.23 (132) 1,756
 manufacturing
 Pesticide, fertilizer and other agricultural
 3253 0.22 (37) 330
 chemical manufacturing
 TOTAL 184,191

 PAGE 31
The components in the table above have been graphed on the following bubble chart figure.

 Competitive Effect versus Provincial Location Quotient
 GHFFA 2010-2014
 5,000
 Food merchant
 4,000 wholesalers

 Special food services
 3,000
 Competitive Effect

 Other miscellaneous
 merchant wholesalers
 2,000
 Beverage manufacturing
 1,000
 1 Other food manufacturing
 3 Pharmaceutical and
 0 13 11 2 5 Beverage merchant medicine manufacturing
 12 10 7 wholesalers
 6
 8 4 Bakeries and tortilla
 Farms 9 manufacturing
 -1,000
 Sugar and confectionery
 -2,000 product manufacturing

 0.0 0.5 1.0 1.5 2.0 2.5
 Provincial Location Quotient

Figure 15: EMSI Analyst - Q1 2015 Data Set

Legend:
 ●1 Dairy product manufacturing
 ●2 Animal food manufacturing
 ●3 Support activities for farms
 ●4 Fruit and vegetable preserving and specialty food manufacturing
 ●5 Grain and oilseed milling
 ●6 Specialty food stores
 ●7 Meat product manufacturing
 ●8 Lawn and garden equipment and supplies stores
 ●9 Farm product merchant wholesalers
 ● 10 Agricultural supplies merchant wholesalers
 ● 11 Farm, lawn and garden machinery and equipment merchant wholesalers
 ● 12 Agricultural, construction and mining machinery manufacturing
 ● 13 Pesticide, fertilizer and other agricultural chemical manufacturing

Sectors related to food production and sales are situated for the most part in the thriving and
moderating quadrants, meaning they are well-represented in the region as compared to the rest
of the province. These sectors include food and beverage merchant wholesalers; as well as
beverage, bakery, sugar and confectionary, and specialty food manufacturing. The only sectors
with a commanding competitive effect, that is, a much stronger performance compared to the
rest of the industry provincially, are those sectors that also have a higher concentration within

 PAGE 32
the region. At the other end of the value chain, industries such as farms, farm product wholesalers, and agricultural supplies and equipment manufacturers and wholesalers, are all situated in the diminishing quadrant. Support activities for farms, while technically in the gaining quadrant, also sits very close to the diminishing quadrant. Shift-Share Competitiveness Changes In the 2013 report, four sectors were recommended as the focus for GHFFA. Farms Grain/Milling/Bakery Value Chain Sugar/Confectionary Value Chain Meat Processing Value Chain This section presents the changes in those sectors plus two additional sectors identified for focus in this report. Grain and Oilseed Milling has been added as a separate but related area within the grain to bakery value chain. The fruit and vegetable processing value chain has been added as an additional sector to investigate based on potential economic impact. The following figure presents the comparison between each sector’s positions in the 2013 report based on 2001-2011 timeframe to its new position based on the 2009-2014 timeframe. The arrows connect the bubbles for each sector. Any colour change in the bubble indicates that it has moved into a different quadrant in the matrix e.g. bakery and tortilla manufacturing has moved from thriving (green) to moderating (orange). Similarly, farms has moved from gaining (yellow) down to diminishing (red). Both of these changes are negative for the agri-food sector and will be discussed in more detail later in this report. Change from 2013 to 2015 Report Six Focus Sectors 4,000 3,000 Farms Bakeries & Tortilla Mfg Competitive Effect 2,000 1,000 Grain & Oilseed Milling 0 Sugar & Confectionery Meat Mfg -1,000 Product Mfg Fruit & Veg Preserving -2,000 0.0 0.5 1.0 1.5 2.0 2.5 3.0 Provincial Location Quotient Figure 16: EMSI Analyst - Q1 2015 Data Set PAGE 33
You can also read