Analysis of Injury Patterns in Men's Football between the English League and the Spanish League - MDPI
←
→
Page content transcription
If your browser does not render page correctly, please read the page content below
International Journal of
             Environmental Research
             and Public Health

Article
Analysis of Injury Patterns in Men’s Football between the
English League and the Spanish League
Juan Carlos Argibay-González 1 , Christopher Vázquez-Estévez 1 , Alfonso Gutiérrez-Santiago 1, * ,
Adrián Paramés-González 1, * , Xoana Reguera-López-de-la-Osa 2 and Iván Prieto-Lage 1

                                          1   Observational Research Group, Faculty of Education and Sport, University of Vigo, 36005 Pontevedra, Spain
                                          2   Education, Physical Activity and Health Research Group (Gies10-DE3), Galicia Sur Health Research,
                                              Institute (IIS Galicia Sur), SERGAS-UVIGO, 36208 Vigo, Spain
                                          *   Correspondence: ags@uvigo.es (A.G.-S.); aparames@uvigo.es (A.P.-G.)

                                          Abstract: Background: Injuries in professional football lead to reduced team performance and large
                                          financial losses. The aim of this study was to analyse injuries in the two best team competitions in the
                                          world (LaLiga and Premier League), establishing similarities and differences, as well as determining
                                          injury causation patterns. Methods: A total of 277 on-field injuries requiring a substitution were
                                          analysed (142 in the Spanish league and 135 in the English league). The analysis was performed
                                          using traditional statistical tests (frequency analysis, chi-square test) with SPSS 25 and a T-Patterns
                                          sequence analysis with THEME 5.0. Results: In the Spanish league, there were a similar number of
                                          injuries in the first part of the season as in the second part of the season, while in the English league,
                                          they are more frequent in the first part of the season. In the Spanish league, injuries are more frequent
                                          in the first half of the match, while in the English league, they are more frequent in the second half.
Citation: Argibay-González, J.C.;
                                          The type of player most frequently injured was the defender. Most of the injuries occurred without
Vázquez-Estévez, C.;
Gutiérrez-Santiago, A.;
                                          the presence of an opponent. The accumulated minutes during the season affect injuries of the
Paramés-González, A.;                     muscular type. Conclusions: The most common type of injury in both leagues was a strain, followed
Reguera-López-de-la-Osa, X.;              by a sprain and a contusion. Although common injury patterns can be established between the two
Prieto-Lage, I. Analysis of Injury        leagues, there are notable differences. One of the factors is determined by the English league calendar
Patterns in Men’s Football between        (many matches at Christmas). In Spain, there were more muscular injuries that were not caused by
the English League and the Spanish        the opponent, while in England there were more tackling injuries. Age is a risk factor in the Spanish
League. Int. J. Environ. Res. Public      league. In this league, there is a moderately significant relationship between the number of injuries
Health 2022, 19, 11296. https://          and the points won.
doi.org/10.3390/ijerph191811296

Academic Editor: Paul                     Keywords: injury; football; pattern; video analysis
B. Tchounwou

Received: 3 August 2022
Accepted: 6 September 2022
                                          1. Introduction
Published: 8 September 2022
                                                Professional football is a contact sport with an associated risk of injury [1,2]. Injuries
Publisher’s Note: MDPI stays neutral
                                          are the main factor affecting a player’s availability [3], causing a problem in the training–
with regard to jurisdictional claims in
                                          competition process, with consequences on their fitness and performance [4]. Research
published maps and institutional affil-
                                          showed that a professional football team can expect around 50 injuries per season, resulting
iations.
                                          in approximately two injuries per player [5]. The incidence of match injuries was almost
                                          10 times higher than the incidence rate of training injuries. The injury incidence rate in the
                                          five major European professional leagues (Spain, England, Italy, Germany and France) was
Copyright: © 2022 by the authors.
                                          not different from that of professional leagues in other countries (6.8 vs. 7.6 injuries/1000 h of
Licensee MDPI, Basel, Switzerland.        exposure, respectively) [6]. The study of injuries is one of the major concerns in the scientific
This article is an open access article    field of football, as evidenced by the numerous published studies [6].
distributed under the terms and                 The Premier League (England) and LaLiga (Spain) are the two most important football
conditions of the Creative Commons        competitions in Europe [7]. Injuries have a direct relationship with the length of time a
Attribution (CC BY) license (https://     player is absent and the economic impact it has on the club. Thus, a study in the English
creativecommons.org/licenses/by/          Premier League has determined that teams will pay more than GBP 100,000,000 in wages
4.0/).                                    for players who will be unavailable due to an injury for more than 30 days [8].

Int. J. Environ. Res. Public Health 2022, 19, 11296. https://doi.org/10.3390/ijerph191811296                   https://www.mdpi.com/journal/ijerph
Int. J. Environ. Res. Public Health 2022, 19, 11296 2 of 17
Concerning injury studies in football, one of the main problems is that there is no
uniform injury reporting system, even in the major European leagues, which makes it
difficult to analyse [9]. In addition, researchers use different ranges and classifications
when categorising injuries, rather than following the UEFA model [10]. Another problem is
that most of the research carried out is descriptive, without determining the mechanism by
which the injury occurs.
The scientific literature approaches the study of injuries in terms of both intrinsic
and extrinsic risk factors [11]. Intrinsic factors include the biological characteristics of the
players. Age is a variable that has been studied, but the ranges used vary according to the
research. Despite the fact that their study is not uniform, there are studies that indicate that,
as the age of a footballer increases, the probability of suffering an injury will also raise each
year [5,12]. It has also been observed that the medical history of the football player with
previous injuries in the same body location will increase the incidence of injury [11,13].
At the same time, a higher risk of injury on the dominant side of the player has been
found [5,14,15]. Regarding the location of the injuries, studies show different classifications,
however, most researches focus on the lower limbs, since these are the extremities that
present the highest percentage of injuries [15–18]. The anatomical region where most
injuries occur is the thigh, followed by the knee and ankle [6]. Previous epidemiological
studies have reported that hamstring muscles are the muscle group most frequently injured
in professional football players [16,19].
On the other hand, extrinsic factors are those related to the context or the time spent
practising sport. Regarding the training–competition process, the incidence of injuries is
higher during competition [3,16,19–24]. In this section, it is important to note two moments
of the season that will have an influence on the injury rate of footballers. A common peak
of incidence in England and Spain is the pre-season, a period of the season in which there
is a greater volume of training, in order to arrive in the best possible condition for the start
of the competitive period. The incidence of injuries during training is higher during July
and August, compared to the training phases of the rest of the season [21]. In England,
there is another peak of incidence in December, a period in which a greater number of
matches are concentrated [18]. Regarding the timing of the match, several studies show
a higher incidence of injuries during the second half, compared to the first half [15,21].
In addition, it is observed that there is a higher risk of injury towards the end of each
half of the match [15,16]. The position of the players also influences the frequency of
injury. Different studies show similar percentages, being higher in midfielders, followed by
defenders, forwards and goalkeepers [14,22,25,26].
The importance of the present study lies in the fact that it provides innovative knowl-
edge about injury patterns, also taking into account causal factors. This knowledge,
as some authors point out, is the first step towards establishing an injury prevention
programme [27]. Therefore, we believe that this study will be useful for football clubs in
helping them to develop such programmes, as it has been shown that they can reduce
injuries by up to 39% [28]. Furthermore, this reduction will cut down the aforemen-
tioned economic impact. Based on this, the object of study of the present research is to
analyse and determine injury patterns that occurred in LaLiga (Spain) and the Premier
League (England) during the 2018/2019 season and to look for differences between these
two competitions.
2. Materials and Methods
2.1. Design
Observational methodology [29] was used to detect patterns in football players’ in-
juries. The observational design [30] used was nomothetic (all injuries were studied
independently), follow-up (one season) and unidimensional (one level of response). A
series of decisions about the participants, instruments and the analytical process is derived
from this design.Int. J. Environ. Res. Public Health 2022, 19, 11296 3 of 17
2.2. Participants
The participants of this study were the players of the first division of the Spanish and
English football league for men in the 2018–2019 season who suffered an injury for which
they were withdrawn from the field. A sample of 277 (142 and 135, respectively) injuries
was obtained in the 38 league games. The information about the injuries was taken from
the official medical records of the clubs and from TransferMarkt, a valid sports database [1]
that provides information about the injuries. The injuries were analysed in accordance
with the ethical principles of the Helsinki Declaration using audio-visual material of public
domain [31]. According to American Psychological Association [32], an observational study
in a natural environment, with public videos obtained from the mass media that does not
imply experimentation, does not require an informed consent from the competitors. The
study was approved by the Ethics Committee of the Faculty of Education and Sport Science
(University of Vigo, Application 02/1019).
2.3. Instruments
The observation instrument used for this study is an adaptation of the OI-INJURIES-
FOOTBALL [33], a category system that contemplates a collectiveness of criteria that will
allow us to the determine the football injuries characteristics [30]. Each dimension gives
rise to a system of categories that accomplish the conditions of exhaustiveness and mutual
exclusivity (E/ME). A detailed description of the observation instrument appears in Table 1,
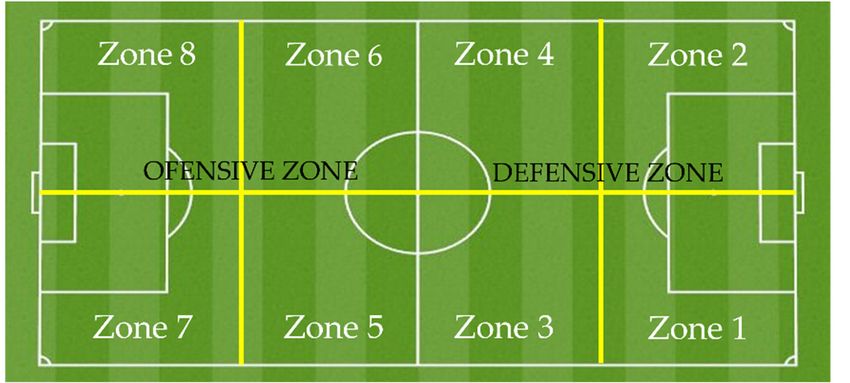
where the criteria, categories and subcategories of the instrument are shown. In Figure 1,
the established field areas are detailed.
Table 1. Descriptive obtained values and the link between the categories.
Intra- Inter-
Criteria Category Subcategory Spain Intra-Criteria England
Criteria Criteria
χ2 (p);
n % χ2 (p) n % χ2 (p) Contin.
Coef.
Location and type of injuries
13.075
80.881
Injury location Head, face or neck 6 4.2 182.634 (0.000) 10 7.4 (0.109);
(0.000)
0.212
Upper limb 6 4.2 9 6.7
Trunk-back 1 0.7 5 3.7
Lumbopelvis 18 12.7 8 5.9
Thigh 63 44.4 48 35.6
Knee 19 13.4 18 13.3
Calf 13 9.2 13 9.6
Ankle 15 10.6 24 17.8
Foot 1 0.7 10 7.4
1.595
1.309
Injured leg Right leg injuries 59 41.5 0.392 (0.531) a 61 45.2 (0.207);
(0.253) a
0.082 a
Left leg injuries 66 46.5 49 36.3
No leg injury 17 12.0 25 18.5
16.087
4.812
Type of injury SPRAIN 28 19.7 70.508 (0.000) b 28 20.7 (0.001);
(0.186) b
0.249 b
Ankle sprain 5 3.5 9 6.7
Knee sprain 13 9.2 16 11.9
Acromioclavicular sprain 2 1.4 - -
Cruciate ligament rupture 8 5.6 3 2.2
STRAIN 71 50.0 39 28.9
Hamstring fibrillar rupture 42 29.6 32 23.7
Quadricep fibrillar rupture 9 6.3 - -
Soleus-gastrocnemius
9 6.3 - -
fibrillar ruptureInt. J. Environ. Res. Public Health 2022, 19, 11296 4 of 17
Table 1. Cont.
Intra- Inter-
Criteria Category Subcategory Spain Intra-Criteria England
Criteria Criteria
χ2 (p);
n % χ2 (p) n % χ2 (p) Contin.
Coef.
Adductor fibrillar rupture 11 7.7 7 5.2
CONTUSION 13 9.2 27 20.0
Head, face or neck contusion 2 1.4 3 2.2
Upper extremity contusion - - 3 2.2
Trunk-back contusion 1 0.7 5 3.7
Lower extremity contusion 10 7.0 16 11.9
FRACTURE 5 3.5 4 3.0
Head, face or neck fracture 2 1.4 2 1.5
Upper extremity fracture 2 1.4 1 0.7
Lower extremity fracture 1 0.7 1 0.7
DISLOCATION 2 1.4 5 3.7
Upper extremity dislocation 2 1.4 5 3.7
OVERUSE 14 9.9 23 17.0
Hamstring overuse 7 4.9 12 8.9
Adductor overuse 3 2.1 - -
Quadriceps overuse 2 1.4 2 1.5
Gastrocnemius overuse 2 1.4 9 6.7
CONCUSSION 1 0.7 5 3.7
OTHERS (wound, etc.) 8 5.6 4 3.0
Not categorized injuries 7 4.9 - -
Meniscus Tear 1 0.7 2 1.5
Achilles tendon rupture - - 2 1.5
Intrinsic injury risk factors
9.038
25.549
Age 30 years 45 31.7 23 17.0
6.729
1.806
Position Goalkeeper 2 1.4 27.829 (0.000) a 1 0.7 (0.035);
(0.405) a
0.155 a
Defender 76 53.5 52 38.5
Midfielder 30 21.1 41 30.4
Forward 34 23.9 41 30.4
0.311
Player 33.800
Right footed 100 70.4 28.971 (0.000) a 95 70.4 (0.577);
laterality (0.000) a
0.034 a
Left footed 37 26.1 30 22.2
Ambidextrous 5 3.5 10 7.4
Extrinsic injury risk factors
15.332
Moment in the 33.252
Days 1–19 74 52.1 0.254 (0.615) 101 74.8 (0.000);
season (0.000)
0.229
Days 20–38 68 47.9 34 25.2
37.047
82.111
Month August 4 2.8 18.704 (0.028) 18 13.3 (0.000);
(0.000)
0.343
September 13 9.2 12 8.9
October 19 13.4 17 12.6
November 14 9.9 18 13.3
December 19 13.4 40 29.6
January 11 7.7 5 3.7
February 13 9.2 6 4.4
March 12 8.5 4 3.0
April 24 16.9 13 9.6
May 13 9.2 2 1.5Int. J. Environ. Res. Public Health 2022, 19, 11296 5 of 17
Table 1. Cont.
Intra- Inter-
Criteria Category Subcategory Spain Intra-Criteria England
Criteria Criteria
χ2 (p);
n % χ2 (p) n % χ2 (p) Contin.
Coef.
0.003
0.007
Stadium Local 72 50.7 0.028 (0.867) 68 50.4 (0.956);
(0.931)
0.003
Visitor 70 49.3 67 49.6
8.763
6.230
Time 1st half: 00 –450 81 57.0 2.817 (0.093) 53 39.3 (0.003);
(0.013)
0.175
00 –150 29 20.4 6 4.4
160 –300 23 16.2 19 14.1
310 –450 + added time 29 20.4 28 20.7
2nd half: 460 –900 61 43.0 82 60.7
460 –600 26 18.3 20 14.8
610 –750 18 12.7 34 25.2
760 –900 + added time 17 12.0 28 20.7
0.269
0.067
Zone Defensive zone 77 54.2 1.014 (0.314) 69 51.1 (0.604);
(0.796)
0.031
Zone 1 27 19.0 16 11.9
Zone 2 21 14.8 20 14.8
Zone 3 14 9.9 12 8.9
Zone 4 15 10.6 22 16.3
Offensive zone 65 45.8 66 48.9
Zone 5 16 11.3 13 9.6
Zone 6 17 12.0 18 13.3
Zone 7 17 12.0 16 11.9
Zone 8 15 10.6 18 13.3
18.496
6.600
00 –5000 30 21.1 19.690 (0.000) 45 33.3 (0.000);
Total (0.086)
0.250
accumulated 5010 –10000 30 21.1 33 24.4
minutes c 10010 –15000 24 16.9 33 24.4
>15000 58 40.8 24 17.8
17.887
136.141
Accumulated 00 –2000 64 45.1 39.014 (0.000) 91 67.4 (0.000);
minutes (0.000)
0.246
after resting 2010 –4000 40 28.2 26 19.3
(>7 days) c 4010 –6000 21 14.8 5 3.7
>6000 17 12.0 13 9.6
Cause of injuries
4.991
4.038
Causative Alone 99 69.7 26.087 (0.000) a 77 57.0 (0.025);
(0.044) a
agent of 0.135 a
the injury Opponent 39 27.5 54 40.0
Partner 4 2.8 4 3.0
16.635
How the injury 63.667
Sprint 41 28.9 118.915 (0.000) 25 18.5 (0.164);
is caused (0.000)
0.238
Dribbling 4 2.8 3 2.2
Sliding 4 2.8 4 3.0
Turning 11 7.7 5 3.7
Tackled by other 13 9.2 21 15.6
Shooting 17 12.0 17 12.6
Falling 6 4.2 2 1.5
Hit by ball 2 1.4 - -
Tackling other player 18 12.7 20 14.8
Stretching 6 4.2 5 3.7
Collision 10 7.0 16 11.9
Kicked by other 3 2.1 9 6.7
Unknown 7 4.9 8 5.9
Note: Coef: contingency coefficient. a : For this analysis, the category with the lowest value for each criterion
was discarded. b : This analysis was carried out only for the four most frequent injuries (strain, sprain, contusion
and overuse). c : This variable takes into account the accumulated minutes of all competitions played during the
season.Collision10 7.0 16 11.9
Kicked by other3 2.1 9 6.7
Unknown7 4.9 8 5.9
Note: Coef: contingency coefficient. a: For this analysis, the category with the lowest value for each
criterion was discarded. b: This analysis was carried out only for the four most frequent injuries
Int. J. Environ. Res. Public Health 2022, 19, 11296 6 of 17
(strain, sprain, contusion and overuse). c: This variable takes into account the accumulated minutes
of all competitions played during the season.
Figure1.1.Field
Figure Fieldzones.
zones.
The
Thecategorization
categorization of of
thethe
type of injury
type followed
of injury the UEFA
followed model model
the UEFA [10]. To[10].
designate
To designate
the part of the body where the injury was produced, a classification endorsed by other
the part of the body where the injury was produced, a classification endorsed by other
authors was used [34]. Four demarcations were used for the analysis [1] and divided the
authors was used [34]. Four demarcations were used for the analysis [1] and divided the
match into 15 min intervals [35]. The cause of injury followed the model established by
matchresearchers
other into 15 min
[36].intervals [35]. The cause of injury followed the model established by
otherThe
researchers [36].
recording instrument used was the LINCE v1.4. (Lleida, Spain) [37]. This software
The recording instrument used was
has been used in numerous investigations thefootball
about LINCE v1.4. (Lleida, Spain) [37]. This soft
[38,39].
ware has been used in numerous investigations about football [38,39].
2.4. Procedure
The sample was obtained through the platform Wyscout [40], which is a scouting
2.4. Procedure
platform for football.
The sample
After wastraining
an adequate obtained through
in the theregister
use of the platform Wyscout
instrument and[40], which is a scouting
the observational
platform forthe
instrument, football.
register of the data was carried out by two observational experts. To
guarantee the rigor in the codification process [41], the quality of the registered data was
controlled through a calculation of the intra- and inter-observers compliance using the
Cohen’s Kappa coefficient calculated through the software LINCE.
Intra-observer agreement was performed on the total number of lesions (n = 277), obtain-
ing a kappa value of 0.97 for observer 1 and 0.95 for observer 2. Subsequently, inter-observer
agreement reached a kappa value of 0.93. The data used were those of observer 1.
After registering all the injuries, an Excel file is obtained with the sequence of all
the codes of the registered behaviours, with its temporality and duration expressed in
frames. The versatility of this file allowed us to conduct successive transformation for the
different analysis [33].
2.5. Data Analysis
All the statistical analysis was carried out using the IBM-Statistical Package for the
Social Sciences, version 25.0 (IBM-SPSS Inc., Chicago, IL, USA). It calculated the relationship
between the distinct categories that were studied by using the test of the Chi-square (χ2).
Pearson’s correlation coefficient was also calculated to analyse the relationship between
the club’s league ranking points and the number of injuries (0.90 to 1.00 very high; 0.70 to
0.89 high; 0.50 to 0.69 moderate; 0.30 to 0.49 low; 0.00 to 0.29 negligible) [42]. The statistical
significance was assumed as p < 0.05.
To analyse the patterns of injury, the detection of T-Patterns (temporal patterns) was
carried out by the Theme v.5.0 [43] with the significance level of 0.005, which means that
the percentage of accepting a critical range due to chance is 0.5%. The minimum number of
occurrences in the search of T-Patterns was five (the minimum possible without a mistake
in processing the information because of an excessive number of series). Furthermore, the
reduction in redundancies has been activated to 90% to avoid the occurrence of similar
T-Patterns. A T-Pattern is essentially a combination of events that occur in the same order,
with the consecutive time intervals between consecutive pattern components remainingInt. J. Environ. Res. Public Health 2022, 19, 11296 7 of 17
relatively invariant, it being assumed, as a null hypothesis, that each component is inde-
pendently and randomly distributed over time. In the results tables, they are presented
in mathematical format with their occurrence (o) and length (l) (for more information, see
the reference manual [44]). This software reveals hidden structures and non-observable
aspects in sports science [45].
3. Results
3.1. Statistical Analysis
In Table 1, a descriptive analysis and χ2 test intra-criteria are presented.
In LaLiga, there was a similar number of injuries between matchdays 1–19 and match-
days 20–38 (52.1–47.9%), with April being the month with the highest incidence (16.9%). In
the Premier League. there was a higher number of injuries in the first part of the season
(74.8–25.2%), especially in the month of December (29.6%).
In the Spanish league, there were more injuries in the first half (57.0–43.0%), while in
the English league the opposite happened (39.3–60.7%), although significant differences
are only found in the English league. In both leagues, there were more injuries in the
defensive zone, but with very similar values, compared to the offensive zone, with no
significant differences in both competitions. In both leagues, it was found that the age group
26–30 years (47.9% and 51.9%) and the position of defender (53.5% and 38.5%) reported
more injuries than the other groups. It was also evident in both leagues that the body
parts where players are more frequently injured are the thigh (44.4–35.6%), the knee
(13.4–13.3%) and the ankle (10.6–17.8%). There was no coincidence in the leg where the
injury occurred, being the left leg (46.5%) in the Spanish league and the right leg (45.2%)
in the English league. In both countries, it was more frequent that the injury occurred
without the presence of an opponent, although with different values (69.7–57.0%). In the
Spanish league there were more injuries as the accumulated minutes of play increased
during the season. This was not the case in the English league, where there were no
significant differences in the variable cumulative minutes of play during the season. The
most common injuries in both leagues were strains (50.0–28.9%), sprains (19.7–20.7%),
contusions (9.2–20.0%) and overuse (9.9–17.0%), although with different percentages.
Statistically significant differences were observed between LaLiga and Premier League
in the following criteria: type of injury, moment in the season, month, time, age, position,
causer, total accumulated minutes and accumulated minutes after resting. Likewise, no
differences were found in the criteria stadium, zone, injury location, injured leg, player
laterality and how the injury is caused.
Table 2 shows the frequency and percentage of players who have participated in the
league competition in their respective country (only those who have played at least 1000
min have been taken into account to avoid bias, since too many footballers had played
very few minutes), as well as the percentage of injured players in the study. The data were
stratified by age (it does not include goalkeepers) and position, showing also the difference
between the two percentages in both cases.
Table 3 presents, for each league, an analysis between the points won by each club and
the number of total injuries at the end of the season.
No statistically significant relationship was found between points won in the ranking
and number of injuries in the English league (r = 0.442; p = 0.182). In contrast, a statistically
significant relationship was found in the Spanish league (r = 0.534; p = 0.015), although it
was moderate.Int. J. Environ. Res. Public Health 2022, 19, 11296 8 of 17
Table 2. Analysis of injuries by age and position.
Spain (LaLiga) England (Premier League)
Age 31+ 26–30 21–25 20− 31+ 26–30 21–25 20−
Players (n) 74 142 107 8 55 166 104 11
Players (%) 22.4 42.9 32.3 2.4 16.4 49.3 31.0 3.3
Injured
45 68 28 1 23 70 40 2
players (n)
Injured
31.7 47.9 19.7 0.7 17.0 51.9 29.6 1.5
players (%)
Difference (%) +9.3 +5.0 −12.6 −1.7 +0.6 +2.6 −1.4 −1.8
Position Gk Def Mid For Gk Def Mid For
Players (n) 34 134 92 105 26 139 105 92
Players (%) 9.3 36.7 25.2 28.8 7.2 38.4 29.0 25.4
Injured
2 76 30 34.0 1 52 41 41
players (n)
Injured
1.4 53.5 21.2 23.9 0.7 38.5 30.4 30.4
players (%)
Difference (%) −7.9 +16.8 −4.0 −4.9 −6.5 +0.1 +1.4 +5.0
Note: Gk: goalkeeper; Def: defender; Mid: midfielder; For: forward.
3.2. Identification of Temporal Patterns (T-Patterns)
3.2.1. General Description of T-Patterns
Table 4 shows an analysis of the number of patterns found through a selective search
with five occurrences. As a selection criterion, the presence of the position category was
used (defence, midfield and forward), combined with one of three most frequent injuries
(strain, sprain, contusion or overuse).
Table 5 included below shows the most relevant T-patterns organised by league,
position and type of injury.
3.2.2. T-Patterns in Defenders
In both leagues, the most common injury is a hamstring rupture and it occurs in
the absence of an opponent. In La Liga, strain injuries are more frequent in the first half
(55%), while in the Premier League they are more frequent in the second half (56%). In
Spain, the minutes accumulated during the season are relevant, while in England, it is
the time accumulated after resting. Age was a key factor, since in Spain up to 55% of
injuries of this type occurred in players over 30 years of age (69% in England in players
between 26 and 30 years of age).
Regarding sprains, it is observed that they were more frequent in the first part of
the season (82–77%, respectively), in the knee (55–69%) and caused by the opponent
(73–77%). In the Spanish league, up to five out of the eleven sprains were a rupture of
the cruciate ligament.
Contusions were mostly caused by the opponent in both leagues, being more common
in the second part of the season in the Spanish league and in the first part of the season in
the English league.
The overloads in Spain occurred mainly in the second half (89%) and in the ham-
string area (67%) of the thigh (78%) of the left leg (67%). There was no relevant data
for England.Int. J. Environ. Res. Public Health 2022, 19, 11296 9 of 17
Table 3. Analysis of injuries by club.
Injuries Injuries
Ranking Club Points Club Points
(n) (n)
1 Barcelona 87 9 Manchester City 98 5
2 Atlético de Madrid 76 10 Liverpool 97 8
3 Real Madrid 68 11 Chelsea 72 8
4 Valencia 61 10 Tottenham Hotspur 71 9
5 Getafe 59 4 Arsenal 70 12
6 Sevilla 59 7 Manchester United 66 10
7 Espanyol 53 9 Wolverhampton W. 57 5
8 Athletic Club 53 7 Everton 54 4
9 Real Sociedad 50 14 Leicester City 52 3
10 Real Betis 50 8 West Ham United 52 7
11 Deportivo Alavés 50 6 Watford 50 4
12 Eibar 47 8 Crystal Palace 49 1
13 Leganés 45 4 Newcastle United 45 8
14 Villarreal 44 5 Bournemouth 45 0
15 Levante 44 9 Burnley 40 4
16 Real Valladolid 41 5 Southampton 39 9
17 Celta de Vigo 41 3 Brighton & Hove Albion 36 10
18 Girona 37 6 Cardiff City 34 11
19 Huesca 33 6 Fulham 26 7
20 Rayo Vallecano 32 2 Huddersfield Town 16 3
Table 4. Analysis of the selective search for T-Patterns.
Description of T-Patterns with Five Occurrences LaLiga Premier
N N
Total T-Patterns detected 12,686 10,818
Non-useful T-Patterns (do not meet selection criterion) 11,655 (91.9%) 10,414 (96.3%)
T-Patterns not excluded 1031 (8.1%) 404 (3.7%)
T-Patterns with strain, sprain, contusion or overuse 4256 2254
T-Patterns with defender, midfielder or forward 3711 2761
T-Patterns with defender and strain 779 104
T-Patterns with defender and sprain 26 98
T-Patterns with defender and contusion 11 32
T-Patterns with defender and overuse 18 0
T-Patterns with midfielder and strain 121 9
T-Patterns with midfielder and sprain 7 6
T-Patterns with midfielder and contusion 0 17
T-Patterns with midfielder and overuse 0 62
T-Patterns with forward and strain 45 58
T-Patterns with forward and sprain 24 13
T-Patterns with forward and contusion 0 2
T-Patterns with forward and overuse 0 3
Table 5. T-Patterns according to league, position (defender, midfielder and forward) and the most
frequent injury (strain, sprain, contusion and overuse).
Basic T-Pattern O Explanatory T-Pattern O L
LaLiga
Defender–strain * 38 ((defender (thigh strain))(hamstringfr (alone sprint))) 14 6
((defender (thigh strain))(hamstringfr alone)) 23 5
* (18) years26_30; (14) more30 years; (21) firsthalf; (18) tam_more1500;
Defender–sprain * 11 (((days1_19 firsthalf)(defender sprain)) opponent) 5 5
((defender (knee sprain)) cruciateligrupt) 5 4
* (8) opponent; (5) tacklingother; (5) tam_more1500; (9) firsthalf; (6) knee
Defender–contusion 8 (((days20_38 firsthalf)(defender contusion)) tam_more1500) 5 5
(defender (contusion opponent)) 6 3Int. J. Environ. Res. Public Health 2022, 19, 11296 10 of 17
Table 5. Cont.
Basic T-Pattern O Explanatory T-Pattern O L
LaLiga
((((secondhalf defensivezone)(defender thigh))(rightfooted
Defender–overuse 9 5 8
overuse))(hamstringoveruse alone))
((secondhalf (defensivezone defender))(leftleg (overuse alone))) 6 6
* (7) leftleg; (8) secondhalf; (8) alone; (7) thigh
Midfielder–strain * 18 (((days1_19 firsthalf)(more30 years midfielder))(thigh (strain alone))) 6 7
(((firsthalf more30 years)(midfielder thigh)) strain) 7 5
(((firsthalf midfielder)(strain alone)) amar_0_200) 7 5
(midfielder (strain (alone sprint))) 9 4
* (8) more30 years; (16) alone; (12) firsthalf; (11) days1_19; (8) amar_0_200
Midfielder–sprain * 7 ((days1_19 offensivezone)(midfielder sprain)) 5 4
* (5) secondhalf; (5) opponent; (6) local; (6) days1_19
Midfielder–contusion 0
Midfielder–overuse 0
(offensivezone (((years26_30 forward)(thigh rightfooted))
Forward–strain * 13 5 8
(strain (hamstringfr alone))))
(((offensivezone forward)(thigh strain))(hamstringfr (alone amar_0_200))) 7 7
((forward thigh)(strain hamstringfr)) 9 4
* (8) days1_19; (8) years26_30; (10) offensivezone; (5) october; (10) firsthalf; (7)
thigh; (9) hamstringfibrillarruptu; (8) amar_0_200
Forward–sprain * 10 (days20_38 ((forward ankle)(sprain anklesprain))) 5 5
* (8) alone; (7) secondhalf; (6) anklesprain
Forward–contusion 0
Forward–overuse 0
Premier League
((days1_19 defender) (thigh((rightfooted(strainhamstringfibrillarruptu))
Defender–strain * 16 10 8
(alone amar_0_200))))
* (9) secondhalf; (11) 26_30 years; (9) rightleg; (15) alone
Defender–sprain * 13 ((defender leftleg) (sprain opponent)) 8 4
* (10) days1_19; (9) knee; (10) leftleg; (10) opponent;
Defender–contusion 11 (days1_19 ((defender contusion)(opponent amar_0_200))) 8 5
Defender–overuse 0
Midfielder–strain * 8 ((days20_38 midfielder)((thigh (strain hamstringfibrillarruptu)) alone)) 5 6
* (6) leftleg; (5) 26_30 years; (5) offensivezone; (6) secondhalf; (6)
hamstringfibrillarruptu
Midfielder–sprain * 7 ((days1_19 (26_30 years ((midfielder ankle)(rightleg sprain)))) anklesprain) 5 7
((days1_19 midfielder)(sprain amar_0_200)) 6 4
* (5) opponent; (6) anklesprain; (6) rightleg
Midfielder–contusion * 10 (secondhalf ((midfielder contusion)(lowerextremitycontusion opponent))) 7 5
* (10) opponent; (9) secondhalf; (8) lowerextremitycontusion
((days1_19 secondhalf)((midfielder overuse)(soleusgastrocnemoveruse
Midfielder–overuse * 13 6 7
(alone amar_0_200))))
(secondhalf ((midfielder overuse)(soleusgastrocnemoveruse alone))) 7 5
((days1_19 secondhalf)((midfielder overuse)(alone amar_0_200))) 7 6
* (10) secondhalf; (9) days1_19; (7) 21_25 years; (8) amar_0_200
Forward–strain * 14 (offensivezone (forward ((thigh (strain hamstringfibrillarruptu)) alone))) 10 6
* (8) days1_19; (5) december; (7) sprint; (5) tam_1001_1500; (12)
hamstringfibrillarruptu; (8) secondhalf
Forward–sprain * 8 (secondhalf ((forward (ankle (sprain anklesprain))) amar_0_200)) 6 6
* (6) visitior; (6) rightleg; (7) secondhalf; (5) days20_38; (5) opponent
Forward–contusion 6 ((offensivezone forward)(contusion opponent)) 6 4
Forward–overuse 6 ((offensivezone forward)(thigh (overuse alone))) 5 5
(days1_19 ((offensivezone forward)(overuse alone))) 5 5
Note: TAM: total accumulated minutes; AMAR: accumulated minutes after resting. * Occurrence of the indicated
category combined with the basic T-Pattern. O: occurrence; L: length.
3.2.3. T-Patterns in Midfields
In relation to strains, in the Spanish league, they were more frequent in the first part
of the season (61%), in players over 30 years of age (44%), in the first half (67%), without
contact with the opponent (89%), after a sprint (50%). In the English league, they were
more common in the second half of the season (63%), in the second half (75%), in players
between 26 and 30 years of age (63%), without contact with an opponent (63%) and in the
left leg (75%). Up to 75% of the strains were hamstring fibrillar ruptures.Int. J. Environ. Res. Public Health 2022, 19, 11296 11 of 17
In both LaLiga and the Premier league, sprains were most common in the first part of
the season (86%), caused by the opponent (71%), in the ankle area (57–86%). In England
they occurred mostly in the right foot (86%) and between 0–200 min accumulated after a
rest period (86%).
There were no patterns with an occurrence of five or more in this position in relation
to contusions and overloads in Spain. Contusions in England occurred in the second half
(90%), on the lower extremity (80%) and caused by the opponent (100%). The overloads
occurred in the first half of the season (69%), in the second half of the match (77%), in the
calf area (54%) and after a period of 0–200 min accumulated after resting (62%). Up to 54%
of the overloads occurred in players aged 21–25.
3.2.4. T-Patterns in Forwards
The most frequent strain in both Spain and England was a hamstring fibrillar rupture
(69–86%). The month in which most of these injuries occurred was October for the first
case and December for the second one (38–36%), being more frequent in the first part of the
season in both leagues (62–57%). They occurred more regularly in the first half in Spain
and in the second half in England (77–57%). Likewise, in the Spanish league they occurred
after an accumulated period of between 0–200 min after a rest period, while in the English
league they occurred after accumulating between 1000–1500 min during the season.
In both the Spanish and English leagues, ankle sprains were frequent (60–75%), al-
though Spanish forwards were injured without contact with the opponent (80%) and
English forwards after contact with the opponent (63%). In both cases, they were more
common in the second half of the match (70–88%).
There were no patterns with an occurrence of five or more in the forward position
for contusions and overloads in Spain. In England, it was evident that the contusions
were caused by an opponent and in the offensive zone in 100% of cases. Overloads were
more common in the first part of the season (83%), in the thigh area (83%) and without the
presence of an opponent (100%).
4. Discussion
The purpose of this research was to determine the injury pattern of the football player
in the Spanish and English men’s league.
The most frequent injury observed in both LaLiga and the Premier League was the
strain (50.0–28.9%), specifically the hamstring fibrillar rupture (29.6–23.7%). The percentage
of the type of injury is very different between the two leagues, although there is coincidence
in the subtype of injury. Most of the authors agree that strains are the most frequent injuries,
giving values between 40% in the Spanish league and 35% in the English league [17,46].
In terms of injury incidence, approximately six players out of each squad will injure a
hamstring each season in professional soccer [47]. Intrinsic factors causing this injury
(such as age and medical history) are risk factors [48], although they are not modifiable.
Modifiable risk factors include hamstring weakness, fatigue and lack of flexibility [49], with
the strength imbalance between the hamstrings (eccentric) and the quadriceps (concentric)
being the most supported by the literature. [50].
In previous investigations into the Spanish league [33,35], it was observed that there
were more injuries in the first part of the season (approximately 55%). The same occurred
in the season of this analysis and in both leagues (52% in Spain), especially in the English
league, where the injury rate was close to 75%. In the English league, there was a clear
increase in injuries in the month of December (29.6%), something that may have occurred
due to the increased number of matches at Christmas (up to nine matches in the English
league, compared to a maximum of six in the Spanish league). In the Spanish league,
although December was also one of the months presenting more injures, the percentage
was not as high as in England (13.4%), probably due to the fact that there were no matches
between the 24th and the 30th of December because of holidays. A study consulted in
which a prospective analysis was carried out over 14 years showed that the concentration ofInt. J. Environ. Res. Public Health 2022, 19, 11296 12 of 17
matches in a short period of time is not the variable that affects the total number of injuries,
but rather the lack of player rotations that allow a rest of more than six days between
matches [51]. This could explain the increase in injuries in that part of the season. In Spain,
October was a month with many injuries (13.4%), evidence that has already been observed
in other studies [25,52]. April was the month with a higher percentage of injuries (16.9%),
a number, which is also reported in the scientific literature on this league [33,35]. Once
again, the accumulation of matches, the absence of player rotations and competitive stress
(uncompleted objectives at that critical moment of the season), as well as the change in
weather conditions (more heat and dryness) could be the causal factors. [53,54].
The relationship between the injury and the time of the match in which it occurred
was very different in the Spanish and English leagues. In Spain, in all quarters of play
there was a stable injury rate, except in the last two quarters of play, where it dropped.
In England, the opposite happened, with the last 30 min of the match reporting the most
injuries. Longitudinal research conducted on the top 14 European teams during the
2011–2018 seasons [16] shows that injuries tend to occur towards the end of matches.
However, specific studies related to the Spanish league show a low injury rate in the
final period of the match in this country [33,35]. The explanation to this may be related
to factors, such as physical preparation, preventive training, intensity of play, style of
play, condition of the fields and substitutions made, even though all these indicators
have not been studied so far [6]. End-of-match injuries could be minimised by the new
rule change where up to five substitutions are allowed, although this is an aspect to be
studied in future research.
The specialised literature [33,35] has reported a higher number of injuries in the
defensive zone of the field (59–68%), something that has also happened in our case in both
leagues (54.2% and 51.1%), although without substantial differences, with respect to the
offensive zone. This could be because the physical demands are different depending on
the position or the specific task required by the player at each moment of the match [55].
For example, defensive actions require more tackling or jumping headfirst [56] and also
a greater number of high-intensity actions with changes of rhythm to avoid dangerous
situations for the attackers.
Age is a relevant risk factor, thus, the number of injuries increased in the 21–25 and
26–30 age ranges and then decreased in the over-30 age group (due to a lesser number
of players in this age range). Previous research has shown that increasing age leads to a
higher number of injuries, especially muscular injuries [12,16,35,52]. The analysis in Table 2
corroborates the published scientific evidence. In any case, this circumstance has been
found to be clearer in the Spanish league than in the English league, where this variable
has not been so decisive. In Spain, the relative injury incidence rate increases notably from
the age of 25 onwards (+5.0% in the 26–30 age group and +9.3 in the 30+ age group), but
in England, the increase was less significant (+2.6% and +0.6%, respectively). It would
be important to take this information into account in injury prevention programs, which
should be more specific as age increases. In addition to this, it is important to control
the minutes accumulated by players throughout the season, and, especially, the rest days
between competitive matches, again with special mention to players over 25 years of age.
Studies on football and injuries do not agree on which position has the highest injury
rate. For example, in the Italian league [52] it is indicated that any field position (excluding
goalkeepers) is equally affected. In the French league, forwards [57], and in the German
league, midfielders are the most frequently affected [1]. In Spain, the studies carried out
indicate that defenders are the players most affected by injuries [33,35], which is consistent
with the findings of this research in both LaLiga and the Premier League, although in Spain
the percentage is higher (53.6% vs. 38.5%). Based on the data from previous research and
the analysis in Table 2, we cannot affirm that there is a field position that requires specific
injury prevention treatment. It is noticed, in relative terms, that goalkeepers are the players
who suffer less injuries (−7.9 and −6.5). In the Spanish league, the relative incidence rate
is higher for defenders (+16.8), although this does not occur in the English league (+0.1),Int. J. Environ. Res. Public Health 2022, 19, 11296 13 of 17
where forwards are the players with the highest incidence (+5.0). In the Spanish league the
relative ratio in this position was negative (−4.9). Midfielders in Spain had a lower ratio
than they should have (−4.0), while in England it was higher (+1.4). Probably, although
it cannot be confirmed, age or lack of rest between matches are the most important risk
factors, even if this requires further study. It may also be due to the idiosyncrasies of each
country’s style of play [58].
After analyzing the distribution of injuries according to the ranking of the clubs
(Table 3), we can point out that there is no significant relationship between the number of
injuries and the points won in the rankings in the English league. In the Spanish league,
there is a moderately significant relationship.
There was a clear tendency for injuries to occur on the lower extremity, a fact
already reported in the literature in the past [16,21], with thigh injuries being more
common (44.4% in Spain and 35.6% in England), which was also contemplated in pre-
vious research [21,52,59]. Muscle injuries are more frequent, with hamstring fibrillar
rupture being the most common, an aspect that has been confirmed in numerous stud-
ies. Imbalance between the thigh musculature, age and medical history are the main
risk factors for this injury [12]. The importance of this type of injury has been specifi-
cally studied. Fortunately, several authors have established different mechanisms for
its prevention [50].
In both leagues, most injuries occur without the presence of an opponent, occurring
after a sprint. T-Patterns corroborate that injuries after a sprint are mostly fibrillar ruptures,
which would explain this high percentage, being the most common subtype of injury.
Previous studies confirm this association and even point to an annual increase of 4% in
recent years of this type of injury [60]. It is also observed that in England, there are more
injuries due to tackling (19.9% vs. 30.4%). Recent research found that the English league
is the most aggressive of the five major European leagues, which may explain the data
previously reported [61].
In a recent study of the Spanish league [35], researchers observed that injuries increased
as players accumulated more minutes in the season, a trend that is confirmed by our
results. In contrast, in the English league, there were numerous injuries without players
accumulating many minutes. This may be due to the fact that in this early part of the season
there is a high concentration of matches during the Christmas period.
If we refer to the injuries that occurred according to the minutes accumulated after
a rest of more than 7 days (at competition level), we found that, as indicated in previous
studies [33,35], most of the injuries occurred between 0–200 min accumulated after this rest.
Coaches usually leave out the most overloaded players when they are at their muscular
limit, and then they come back to play in the next match when they are not yet in full
physical condition [62]. This could possibly be the motive.
4.1. Limitations and Future Perspectives
This study only considers injuries that occur during league matches that require player
substitution (although it does take into account the accumulated minutes of play in all
competitions). It would be interesting to extend the study to all team competitions and
even those injuries that occur during training. The analysis could also be extended to other
competitions in other countries. Future research should approach the analysis of injuries in
football with longitudinal studies.
4.2. Practical Implications
Due to the high incidence of injuries in older players, especially muscular injuries,
specific interventions are necessary to minimise the risk while maintaining a highly com-
petitive level. It is recommended to monitor the imbalance between the quadriceps and
hamstring musculature.
The competitive calendar is highly concentrated, but it has been shown that rotations
are necessary to avoid injuries. Coaches should be aware that playing two games in lessInt. J. Environ. Res. Public Health 2022, 19, 11296 14 of 17
than 7 days increases the risk of injury, especially in older players. It would be important
that squads are as balanced as possible, with at least two players per position and that there
is a distribution of minutes between them throughout the season as far as possible.
Injury prevention programmes are important because they help to reduce the risk of
injury. They should be included in training sessions for all positions and ages.
5. Conclusions
Although there were similarities between the Spanish and English leagues in terms of
injuries, there were also clear differences.
The most common type of injury in both leagues was strain, followed by sprain and
contusion. There were also a high number of overuse injuries, which were more frequent
in the Premier League. In Spain, there were more muscle injuries (including strains and
overuses) than in England. In both leagues, the most frequent injury was hamstring rupture,
so specific work to prevent this type of injury is recommended. In the English league, a
higher number of contusions were observed. The number of sprains was similar, with
knee sprains being more common. Tackling injuries were more common in England, while
non-contact injuries after a sprint were recorded more often in Spain.
The calendar affected the number of injuries. The Christmas period saw the highest
number of injuries in England due to the high number of matches scheduled. The Spanish
league had a balanced number of injuries throughout the season (especially in April, where
several competitions were also concentrated). It was also found that the defender is the
player with the most injuries, being more accentuated in Spain. The accumulation of
minutes throughout the season was clearly linked to injury in the Spanish league but not in
the English league. After a rest of at least 7 days without competing, the players who got
injured did so after playing between 0–200 min in the majority of cases. This circumstance
requires further study, but it is an aspect of great relevance.
In the Spanish league, there was a higher risk of injury as the age of the player
increased. In the English league, age was not such a determining factor. The position with
the highest risk of injury in Spain was defender, while in England it was forward. There
is no significant relationship between the points won and the number of injuries in the
English league, and a moderate one in the Spanish league.
Author Contributions: Conceptualization, J.C.A.-G., C.V.-E., A.P.-G. and X.R.-L.-d.-l.-O.; Data cura-
tion, J.C.A.-G.; Investigation, J.C.A.-G., A.P.-G., X.R.-L.-d.-l.-O. and I.P.-L.; Methodology, A.G.-S. and
I.P.-L.; Project administration, X.R.-L.-d.-l.-O.; Resources, C.V.-E. and A.P.-G.; Software, J.C.A.-G. and
I.P.-L.; Supervision, A.G.-S. and I.P.-L.; Validation, A.G.-S.; Visualization, C.V.-E.; Writing—original
draft, A.G.-S. and I.P.-L. All authors have read and agreed to the published version of the manuscript.
Funding: This research received no external funding.
Institutional Review Board Statement: The study was approved by the ethics committee of the
Faculty of Education and Sport Science (University of Vigo, application 02/1019).
Informed Consent Statement: Not applicable.
Data Availability Statement: Not applicable.
Conflicts of Interest: The authors declare no conflict of interest.
References
1. Leventer, L.; Eek, F.; Hofstetter, S.; Lames, M. Injury Patterns among Elite Football Players: A Media-based Analysis over 6
Seasons with Emphasis on Playing Position. Int. J. Sports Med. 2016, 37, 898–908. [CrossRef] [PubMed]
2. Tscholl, P.; O’Riordan, D.; Fuller, C.W.; Dvorak, J.; Gutzwiller, F.; Junge, A. Causation of injuries in female football players in
top-level tournaments. Br. J. Sports Med. 2007, 41, 8–14. [CrossRef] [PubMed]
3. Carling, C.; Orhant, E.; Legall, F. Match injuries in professional soccer: Inter-seasonal variation and effects of competition type,
match congestion and positional role. Int. J. Sports Med. 2010, 31, 271–276. [CrossRef]
4. Zahínos, J.I.; González, C.; Salinero, J. Epidemiological study of the injuries, the processes of readaptation and prevention of the
injury of anterior cruciate ligamento in the professional football. J. Sport Health Res. 2010, 2, 139–150.Int. J. Environ. Res. Public Health 2022, 19, 11296 15 of 17
5. Ekstrand, J.; Hägglund, M.; Waldén, M. Injury incidence and injury patterns in professional football: The UEFA injury study. Br. J.
Sports Med. 2011, 45, 553–558. [CrossRef]
6. López-Valenciano, A.; Ruiz-Pérez, I.; Garcia-Gómez, A.; Vera-Garcia, F.J.; De Ste Croix, M.; Myer, G.D.; Ayala, F. Epidemiology of
injuries in professional football: A systematic review and meta-analysis. Br. J. Sports Med. 2020, 54, 711–718. [CrossRef] [PubMed]
7. UEFA. Association Club Coefficients. Available online: https://www.uefa.com/nationalassociations/uefarankings/country/
seasons/#/yr/2019 (accessed on 23 August 2022).
8. Jain, N.; Murray, D.; Kemp, S.; Calder, J. Frequency and trends in foot and ankle injuries within an English Premier League
Football Club using a new impact factor of injury to identify a focus for injury prevention. Foot Ankle Surg. 2014, 20, 237–240.
[CrossRef]
9. Riepenhof, H.; Lindenmeyer, A.; Bloch, H.; McAleer, S.; Delvescovo, R.; Flammini, V.; Bark, S.; Gille, J.; Oheim, R.; Kienast, B.
Profifußball im europäischen Vergleich—Auswirkungen von Verletzungen. Sports Orthop. Traumatol. 2018, 34, 132–140. [CrossRef]
10. Hägglund, M.; Waldén, M.; Bahr, R.; Ekstrand, J. Methods for epidemiological study of injuries to professional football players:
Developing the UEFA model. Br. J. Sports Med. 2005, 39, 340–346. [CrossRef]
11. Arnason, A.; Sigurdsson, S.B.; Gudmundsson, A.; Holme, I.; Engebretsen, L.; Bahr, R. Risk Factors for Injuries in Football. Am. J.
Sports Med. 2004, 32, 5–16. [CrossRef]
12. Henderson, G.; Barnes, C.A.; Portas, M.D. Factors associated with increased propensity for hamstring injury in English Premier
League soccer players. J. Sci. Med. Sport 2010, 13, 397–402. [CrossRef] [PubMed]
13. Hägglund, M.; Waldén, M.; Ekstrand, J. Risk factors for lower extremity muscle injury in professional soccer: The UEFA injury
study. Am. J. Sports Med. 2013, 41, 327–335. [CrossRef] [PubMed]
14. Benito del Pozo, L.; Ayán Pérez, C.; Revuelta Benzanilla, G.; Maestro Fernández, A.; Fernández Villa, T.; Martín Sánchez, V.
Influence of the soccer players’ professional status on the frequency and severity of injuries: A comparative pilot study. Apunt.
Med. l’Esport 2014, 49, 20–24. [CrossRef]
15. Hawkins, R.R.; Fuller, C.C. A prospective epidemiological study of injuries in four English professional football clubs. Br. J. Sports
Med. 1999, 33, 196–203. [CrossRef] [PubMed]
16. Ekstrand, J.; Hägglund, M.; Waldén, M. Epidemiology of muscle injuries in professional football (soccer). Am. J. Sports Med. 2011,
39, 1226–1232. [CrossRef]
17. Hawkins, R.; Hulse, M.; Wilkinson, C.; Hodson, A.; Gibson, M. The association football medical research programme: An audit of
injuries in professional football. Br. J. Sports Med. 2001, 35, 43–47. [CrossRef]
18. Jones, A.; Jones, G.; Greig, N.; Bower, P.; Brown, J.; Hind, K.; Francis, P. Epidemiology of injury in English Professional Football
players: A cohort study. Phys. Ther. Sport 2019, 35, 18–22. [CrossRef]
19. Stubbe, J.H.; Van Beijsterveldt, A.M.M.C.; Van Der Knaap, S.; Stege, J.; Verhagen, E.A.; Van Mechelen, W.; Backx, F.J.G. Injuries in
professional male soccer players in the Netherlands: A prospective cohort study. J. Athl. Train. 2015, 50, 211–216. [CrossRef]
20. Belloch, L. The Epidemiology on Soccer: A Systematic Review. Rev. Int. Med. Cienc. Act. Física Deport. 2010, 10, 22–40.
21. Noya-Salces, J.; Gómez-Carmona, P.M.; Gracia-Marco, L.; Moliner-Urdiales, D.; Sillero-Quintana, M. Epidemiology of injuries in
First Division Spanish football. J. Sports Sci. 2014, 32, 1263–1270. [CrossRef]
22. Morgan, B.E.; Oberlander, M.A. An Examination of Injuries in Major League Soccer. Am. J. Sports Med. 2001, 29, 426–430.
[CrossRef] [PubMed]
23. Waldén, M.; Hägglund, M.; Ekstrand, J. UEFA Champions League study: A prospective study of injuries in professional football
during the 2001-2002 season. Br. J. Sports Med. 2005, 39, 542–546. [CrossRef]
24. Waldén, M.; Hägglund, M.; Ekstrand, J. Football injuries during European Championships 2004–2005. Knee Surg. Sports Traumatol.
Arthrosc. 2007, 15, 1155–1162. [CrossRef] [PubMed]
25. Gomez-Piqueras, P.; López, A.N.; Gonzalez-Rubio, J.; Arribas, E. How, When, and Where do Football Players get Injured?: A
Descriptive Epidemiological Study on Male Professional Football Players in Spain for Four Seasons. Ann. Appl. Sport Sci. 2017, 5,
13–21. [CrossRef]
26. Mallo, J.; González, P.; Veiga, S.; Navarro, E. Injury incidence in a spanish sub-elite professional football team: A prospective
study during four consecutive seasons. J. Sports Sci. Med. 2011, 10, 731–736.
27. Ekstrand, J. Keeping your top players on the pitch: The key to football medicine at a professional level. Br. J. Sports Med. 2013, 47,
723–724. [CrossRef]
28. Thorborg, K.; Krommes, K.K.; Esteve, E.; Clausen, M.B.; Bartels, E.M.; Rathleff, M.S. Effect of specific exercise-based football
injury prevention programmes on the overall injury rate in football: A systematic review and meta-analysis of the FIFA 11 and
11+ programmes. Br. J. Sports Med. 2017, 51, 562–571. [CrossRef] [PubMed]
29. Anguera, M.T.; Blanco-Villaseñor, A.; Losada, J.L.; Portell, M. Guidelines for designing and conducting a study that applies
observational methodology. UB J. Psychol. 2018, 48, 9–17. [CrossRef]
30. Anguera, M.T.; Villaseñor, A.B.; Mendo, A.H.; López, J.L.L. Observational designs: Their suitability and application in sports
psychology. Cuad. Psicol. Deport. 2011, 11, 63–76.
31. Harriss, D.J.; Atkinson, G. Ethical Standards in Sport and Exercise Science Research: 2016 Update. Int. J. Sports Med. 2015, 36,
1121–1124. [CrossRef]
32. American Psychological Association. Ethical principles of psychologists and code of conduct. Am. Psychol. 2002, 57, 1060–1073.
[CrossRef]Int. J. Environ. Res. Public Health 2022, 19, 11296 16 of 17
33. Prieto-Lage, I.; Argibay-González, J.C.; Paramés-González, A.; Pichel-Represas, A.; Bermúdez-Fernández, D.; Gutiérrez-Santiago,
A. Patterns of Injury in the Spanish Football League Players. Int. J. Environ. Res. Public Health 2021, 19, 252. [CrossRef] [PubMed]
34. Horan, D.; Blake, C.; Hägglund, M.; Kelly, S.; Roe, M.; Delahunt, E. Injuries in elite-level women’s football—A two-year
prospective study in the Irish Women’s National League. Scand. J. Med. Sci. Sports 2022, 32, 177–190. [CrossRef] [PubMed]
35. Prieto-Lage, I.; Louzao-Neira, I.; Argibay-González, J.C.; Gutiérrez-Santiago, A. Injury patterns of professional footballers in the
Spanish first division during the 2017–2018 seasons. Physiol. Behav. 2020, 224, 113052. [CrossRef]
36. Ibikunle, P.O.; Efobi, K.C.; Nwankwo, M.J.; Ani, K.U. Uefa model in identification of types, severity and mechanism of injuries
among footballers in the nigerian women’s premier league. BMJ Open Sport Exerc. Med. 2019, 5, e000386. [CrossRef]
37. Gabin, B.; Camerino, O.; Anguera, M.T.; Castañer, M. Lince: Multiplatform Sport Analysis Software. Procedia-Soc. Behav. Sci. 2012,
46, 4692–4694. [CrossRef]
38. Castañer, M.; Barreira, D.; Camerino, O.; Teresa Anguera, M.; Fernandes, T.; Hileno, R. Mastery in goal scoring, T-pattern
detection, and polar coordinate analysis of motor skills used by Lionel Messi and Cristiano Ronaldo. Front. Psychol. 2017, 8, 741.
[CrossRef]
39. Prieto-Lage, I.; Bermúdez-Fernández, D.; Paramés-González, A.; Gutiérrez-Santiago, A. Analysis of the corner kick in football in
the main European leagues during the 2017-2018 season. Int. J. Perform. Anal. Sport 2021, 21, 611–629. [CrossRef]
40. Radicchi, E.; Mozzachiodi, M. Social talent scouting: A new opportunity for the identification of football players? Phys. Cult.
Sport Stud. Res. 2016, 70, 28–43. [CrossRef]
41. Blanco-Villaseñor, A.; Anguera, M.T. Evaluación de la calidad en el registro del comportamiento: Aplicación a deportes de
equipo. In Métodos Numéricos en Ciencias Sociales; Oñate, E., García-Sicilia, F., Ramallo, L., Eds.; Centro Internacional de Métodos
Numéricos en Ingeniería: Barcelona, Spain, 2000; pp. 30–48.
42. Mukaka, M.M. Statistics corner: A guide to appropriate use of correlation coefficient in medical research. Malawi Med. J. 2012, 24,
69–71.
43. Magnusson, M.S.; Burgoon, J.K.; Casarrubea, M. Discovering Hidden Temporal Patterns in Behavior and Interaction: T-Pattern
Detection and Analysis with THEME; Magnusson, M.S., Burgoon, J.K., Casarrubea, M., Eds.; Springer: New York, NY, USA, 2016;
ISBN 978-1-4939-3248-1.
44. PatternVision Ltd. & Noldus Information Technology. Theme: Powerful Tool for Detection and Analysis of Hidden Patterns in Behavior.
Reference Manual, Version 5.0; Noldus InformationTechnology bv: Wageningen, The Netherlands, 2004; ISBN 90-74821-60-X.
45. Borrie, A.; Jonsson, G.K.; Magnusson, M.S. Temporal pattern analysis and its applicability in sport: An explanation and
preliminary data. J. Sport Sci. 2002, 20, 845–852. [CrossRef] [PubMed]
46. Larruskain, J.; Lekue, J.A.; Diaz, N.; Odriozola, A.; Gil, S.M. A comparison of injuries in elite male and female football players: A
five-season prospective study. Scand. J. Med. Sci. Sports 2018, 28, 237–245. [CrossRef] [PubMed]
47. Woods, C.; Hawkins, R.D.; Maltby, S.; Hulse, M.; Thomas, A.; Hodson, A. The Football Association Medical Research Programme:
An audit of injuries in professional football–analysis of hamstring injuries. Br. J. Sports Med. 2004, 38, 36–41. [CrossRef] [PubMed]
48. Foreman, T.K.; Addy, T.; Baker, S.; Burns, J.; Hill, N.; Madden, T. Prospective studies into the causation of hamstring injuries in
sport: A systematic review. Phys. Ther. Sport 2006, 7, 101–109. [CrossRef]
49. Clark, R.A. Hamstring injuries: Risk assessment and injury prevention. Ann. Acad. Med. Singap. 2008, 37, 341–346.
50. Croisier, J.L.; Ganteaume, S.; Binet, J.; Genty, M.; Ferret, J.M. Strength imbalances and prevention of hamstring injury in
professional soccer players: A prospective study. Am. J. Sports Med. 2008, 36, 1469–1475. [CrossRef]
51. Bengtsson, H.; Ekstrand, J.; Waldén, M.; Hägglund, M. Muscle injury rate in professional football is higher in matches played
within 5 days since the previous match: A 14-year prospective study with more than 130 000 match observations. Br. J. Sports
Med. 2018, 52, 1116–1122. [CrossRef]
52. Falese, L.; Della Valle, P.; Federico, B. Epidemiology of football (soccer) injuries in the 2012/2013 and 2013/2014 seasons of the
Italian Serie A. Res. Sports Med. 2016, 24, 426–432. [CrossRef]
53. Bengtsson, H.; Ekstrand, J.; Waldén, M.; Hägglund, M. Muscle injury rates in professional football increase with fixture congestion:
An 11-year follow-up of the UEFA Champions League injury study. Br. J. Sports Med. 2014, 48, 560–574. [CrossRef]
54. Ekstrand, J.; Waldén, M.; Hägglund, M. A congested football calendar and the wellbeing of players: Correlation between match
exposure of European footballers before the World Cup 2002 and their injuries and performers during that World Cup. Br. J.
Sports Med. 2004, 38, 493–497. [CrossRef]
55. Bloomfield, J.; Polman, R.; O’Donoghue, P. Physical Demands of Different Positions in FA Premier League Soccer. J. Sports Sci.
Med. 2007, 6, 63. [PubMed]
56. Reilly, T. Motion analysis and physiological demands. In Science and Soccer; Williams, A.M., Reilly, T., Eds.; E & FN Spon: London,
UK, 2003; pp. 59–72.
57. Ferenczi, A.; Moraux, A.; Le Gall, F.; Thevenon, A.; Wieczorek, V. Relationship Between Spinal-Pelvic Sagittal Balance and
Pelvic-Femoral Injuries in Professional Soccer Players. Orthop. J. Sports Med. 2020, 8, 2325967119894962. [CrossRef] [PubMed]
58. Maderer, D.; Holtbrügge, D.; Schuster, T. Professional football squads as multicultural teams: Cultural diversity, intercultural
experience, and team performance. Int. J. Cross Cult. Manag. 2014, 14, 215–238. [CrossRef]
59. Renshaw, A.; Goodwin, P.C. Injury incidence in a Premier League youth soccer academy using the consensus statement: A
prospective cohort study. BMJ Open Sport Exerc. Med. 2016, 2, e000132. [CrossRef]You can also read