ANALYSIS OF THE 2019 NATIONAL BUDGET AND PROJECTED IMPACT ON SOCIO-ECONOMIC DEVELOPMENT - PARLIAMENT OF ZIMBABWE POST-BUDGET SEMINAR GODFREY ...
←
→
Page content transcription
If your browser does not render page correctly, please read the page content below
ANALYSIS OF THE 2019
NATIONAL BUDGET AND
PROJECTED IMPACT ON
  SOCIO-ECONOMIC
   DEVELOPMENT
 PARLIAMENT OF ZIMBABWE
   POST-BUDGET SEMINAR
 GODFREY KANYENZE (Dr.),
          LEDRIZ
  RAINBOW TOWERS HOTEL
     26 NOVEMBER 2019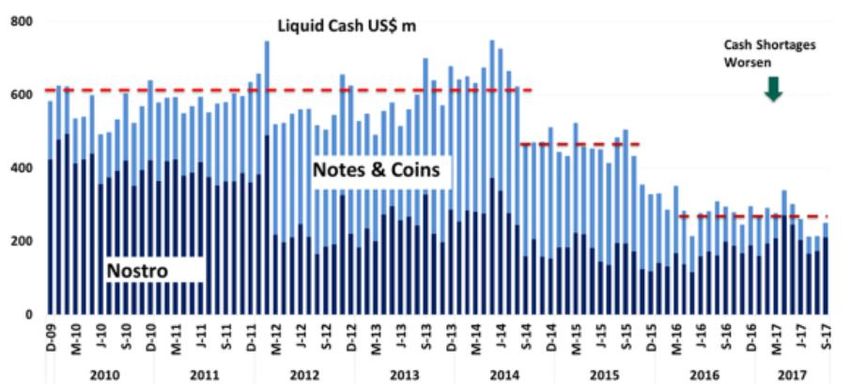
The Policy Objectives & Focus

Long-term development agenda under the New Dispensation: Vision
2030 which seeks to transform the country into an Upper Middle
Income Society by 2030.

Medium term plan: Transitional Stabilisation Programme (TSP) –
October 2018 to December 2020. The TSP`s immediate objective is
macro and fiscal stabilisation and laying a solid foundation for attaining
the triple ‘S’ growth - strong, sustainable and shared.

Annual Plan / Budget, with the 2019 focusing on ‘Austerity for
Prosperity’ – tension in the means (austerity) and ends (prosperity).

Essentially, austerity entails cutting back on aggregate demand, which
ultimately will affect growth, employment and poverty. Austerity is
pro-cyclical and not counter-cyclical.
Key issues from Consultations
Key objectives and priorities from consultations include:
i.    Decisively dealing with fiscal indiscipline through use of austerity measures;
ii.   Removal of pricing and policy distortions;
iii.  Improving foreign currency generation and establishing efficient and optimal
      mechanisms for its allocation;
iv.   Jobs creation, particularly for the youths, being the new entrants into the labour
      market;
v.    Promotion of productivity and export growth through incentives;
vi.   Efficient public service delivery and not just input;
vii. Parastatals reforms and privatisation for a private sector led economy;
viii. International re-engagement, clearance of debt arrears and investment
      promotion;
ix.   Investing in research and development;
x.    Empowerment of Provinces and Districts;
xi.   Gender equity promotion;
xii. Promotion of good governance;
xiii. Fighting corruption; and
xiv. Turn Zimbabwe into the gateway for investment into Africa.

Stakeholders’ emphasis on co-ordinated, predictable and consistent policies, void of
reversals to promote confidence building and forward planning.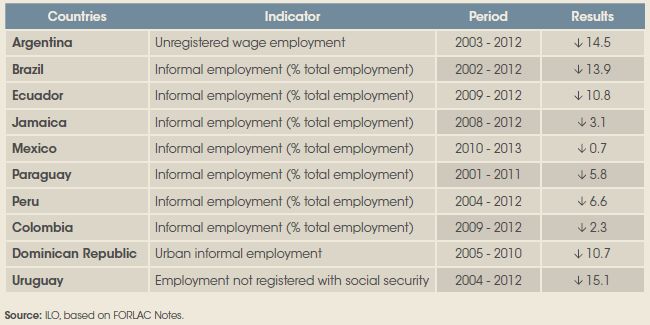
Having raised the key priorities from consultations, the Budget Statement
indicates that due to limited fiscal space during the tenure of the TSP, the
2019 Budget will primarily target macro-economic and fiscal stabilisation and
implementation of high impact projects and programmes.

Clearly therefore, the 2019 Budget is about implementing an austerity
programme, akin to ESAP II.

Given the resemblance with ESAP I, it is important to draw lessons from
experiences with Structural Adjustment Programmes (SAPs) that were
implemented in the 1980s and 1990s.

Budget statement correctly observes that realising the above requires unity of
purpose, high level of competencies, as well as commitment and full
participation of all stakeholders during implementation of TSP and the 2019
Budget – the big question is do we have these requisites at the moment?

Paragraph 18, page 6 of the Budget Statement makes the following plea: “I,
therefore, appeal to all implementing agencies to apply themselves diligently
for the success of this Budget and the Transitional Stabilisation Programme,
as we move a step towards attaining an ‘Upper Middle Income Society by
2030’. Is this sufficient given past experiences?
Policy Thrust
The primary objective of the 2019 Budget is to stabilise the economy,
targeting the ‘twin deficits’ of fiscal and current account, major sources of
economic vulnerabilities, including inflation, sharp rise in indebtedness,
accumulation of arrears and foreign currency shortages.

In view of the limited fiscal space against high demands, focus on quick-win
flagship projects and programmes across key sectors of the economy.

The 2019 Budget to prioritises infrastructure rehabilitation and development
to support productive sectors.

Value addition and beneficiation strategy will also be supported to maximise
benefits in terms of employment and incomes.

Removal of various policy and price distortions which undermine efficiency
and promote corrupt and rent seeking practices.

Measures to reduce expenditures and mobilise more resources through taxes
to entail pain and sacrifice, hence the theme of the 2019 Budget of ‘Austerity
for Prosperity’.
Lessons from Structural Adjustment Programmes (SAPs)
Lessons can be drawn from the experiences of Structural Adjustment Programmes
(SAPs) with the mantra of ‘stabilize, privatize, and liberalize.’

Empirical evidence suggests that macroeconomic stabilization was often achieved
following the implementation of orthodox reforms, but at the expense of sustained
levels of investment, economic growth, employment and poverty reduction – ‘the
stabilization trap.’

Muqtada (2010) reports on the relationship between the stability variables and GDP
growth based on panel data for 80 developing countries and reveals that:
• “nearly two decades of stabilization reforms have in fact reduced the inflation
   levels in most countries of the world;
• with the exception of a few countries, growth of GDP is observed to be low or
   inadequate during the 1980s and much of the 1990s;
• despite substantial declines in inflation rate and budget deficit, hence arguably
   better macroeconomic stability, investment-to-GDP ratio (I/GDP) has failed to gain
   momentum;
• I/GDP as a single variable tends to explain growth better than “stability” variables;
   and
• Current account deficit is negatively related to growth but not robustly,” (page 3).

Analysis by the World Bank supports the pro-cyclical nature of stabilization. Results
contained in two seminal reports ‘Economic Growth in the 1990s: Learning from a
Decade of Reform’ (World Bank, 2005); and ‘The Growth Report: Strategies for
Sustained Growth and Inclusive Development’ (World Bank, 2008).

As the 2005 report notes; “The principles of … ‘macroeconomic stability, domestic
liberalization, and openness’ have been interpreted narrowly to mean ‘minimize fiscal
deficits, minimize inflation, minimize tariffs, maximize privatization, maximize
liberalization of finance,’ with the assumption that the more of these changes the
better, at all times and in all places - overlooking the fact that these expedients are
just some of the ways in which these principles can be implemented,” (World Bank,
2005: 11).

The World Bank reports argue that by focusing on macroeconomic stability,
deregulation and privatization, conventional macroeconomic policies typically confuse
means for ends. In this respect, the report argues that: “In retrospect, it is clear that in
the 1990s we often mistook efficiency gains for growth … Expectations that gains in
growth would be won entirely through policy improvements were unrealistic. Means
were often mistaken for goals – that is, improvements in policies were mistaken for
growth strategies, as if improvements in policies were an end in themselves. Going
forward, the pursuit of policy reforms’ sake should be replaced by a more
comprehensive understanding of the forces underlying growth. Removing obstacles
that make growth impossible may not be enough: growth-oriented action, for example
on technological catch up, or encouragement of risk taking for faster accumulation,
may be needed,” (World Bank, 2005b: 11).

While it was clear that to achieve higher levels of growth and employment required
substantially increased resources and expenditures (e.g. on physical and social
infrastructure), the stabilization measures continued to squeeze the fiscal space
needed to achieve such expenditures.

Hence, conventional approaches often miss the fact that social goals are not only ends
in themselves, but are also capital inputs, the very means to productive life, economic
growth and further development.

In the aftermath of the global crisis of 2008-09, the IMF has entered the debate,
accepting that a rethink of macroeconomic policy is required. In an appropriately titled
paper, “Rethinking Macroeconomic Policy,” it laments that “…we thought of monetary
policy as having one target, inflation, and one instrument, the policy rate. So long as
inflation was stable, the output gap was likely to be small and stable and monetary
policy did its job. We thought of fiscal policy as playing a secondary role, with political
constraints sharply limiting its de facto usefulness. And we thought of financial
regulation as mostly outside the macroeconomic framework,” (see Blanchard et.al,
2010: 3).

An IMF Working Paper published on 3 January 2013 titled “Growth Forecast Errors and
Fiscal Multipliers,” co-authored by its chief economist, Olivier Blanchard and Daniel
Leigh, a research-department economist, argues that the IMF recommended slashing
budgets too fast early in the euro crisis, starving many economies of much-needed
growth. It observes that: “Forecasters significantly underestimated the increase in
unemployment and the decline in domestic demand associated with fiscal
consolidation.”
State of the Economy and Outlook

Cumulative impact imbalances, especially the ‘twin deficit’
that have gone for too long without being addressed weighed
down economic performance.

Growth of 4% in 2018, below the 6.3% projected under TSP;
3.1% in 2019 (9.0% in TSP); and 7.5% in 2020 (9.5% in TSP).

Nominal GDP for 2018 now US$24.6 billion, from a previous
level of US$21 billion due to rebasing.

Following rebasing, per capita GDP for 2017 up from US$1 235
to US$1 508, and projected to reach US$1 642 by end of 2018,
placing Zimbabwe in lower middle income status.
GDP Growth Rates
Limited & shrinking fiscal space…firing on one cylinder
The fiscal space diamond is an analytical tool, a visual representation of the
sources, and potential increases or decreases in resources derived through fiscal
instruments.

Plotted over four axis signifying different key components of revenue, with each
axis scaled as a percentage of GDP, the diamond illustrates the aggregate fiscal
space available to governments.

The key fiscal instruments or ‘pillars’ of the fiscal diamond are:
• external grants/aid (Overseas Development Assistance - ODA) or debt relief;
• domestic revenue mobilisation through tax administration or tax policy
   reforms;
• deficit financing through domestic and external borrowing; and
• ‘Reprioritization’ (expenditure switching) and raising efficiency of
   expenditures.

Zimbabwe has not had the advantage of accessing all the four pillars of the fiscal
space diamond. In the absence of re-engagement with the international
community, official aid is off-budget.
Fiscal Space for Development: The fiscal space diamond

                         1. Official Development
                          Assistance (% of GDP)

 4. Reprioritization &                             2. Domestic
 Efficiency of                                     Revenues
 Expenditures                                      Mobilization
 (% of GDP)                                        (% of GDP)

                           3. Deficit Financing
                               (% of GDP)
Public Finances Revenue collected during the nine months to September 2018 amounted to US$3.8 billion, against a target of US$3.4 billion, and projected at US$5.5 billion by year end. Total expenditures during the nine months to September 2018 of US$6.5 billion, against a target of US$4.1 billion. Expenditure outturn to year end estimated at US$8.2 billion against a budget of US$5.3 billion, implying an expenditure overrun of US$2.8 billion. The 2018 Budget Deficit is projected at US$2.86 billion (11.7% of GDP), against a target of US$793 million. The large cumulative deficit is due to unbudgeted expenditures involving employment costs, support to agriculture, and some capital expenditure. Deficit financed by issuance of Treasury Bills and recourse to the overdraft facility at the Central Bank.
Budget Deficit & Borrowing Requirements
             2009 2010 2011 2012            2013 2014 2015 2016 2017*
Revenue
(US$m) 933.6 2339.1 2921.0 3495.8           3741.0 3727.2 3737.1 3502.2 4338.5
Expenditure
(US$m) 898.1 2143.0 2898.9 3505.3           3987.4 3911.6 4119.6 4923.2 6045.0
Budget
deficit      35.5 196.1 22.1 -9.6           -246.4 -184.4 -382.5 -1421.0 1706.5
Deficit/GDP
(%)          0.4 1.9 0.2 -0.1               -1.6   -1.2   -2.3    -8.5   9.9
Fiscal deficit and revenue collection: a comparative analysis (World Bank,
June 2017)Fiscal expansion in 2016 triggered a liquidity crunch, prompting banks to limit cash withdrawals. Sudden rise in the fiscal deficit in 2016 is related to the Reserve Bank Debt Assumption Act of July 2015, which required government to take liability of an estimated $1.35 billion debts incurred by the RBZ before 31 December 2008. Fiscal deficits had to be financed through domestic borrowing, which put the financial sector under considerable pressure, leading to liquidity shortages. Of the US$2.1 billion Treasury bills and bonds issued in 2016, only US$356.3 million (17%) was to finance the budget deficit, with US$1.7 billion (81%) for outstanding legacy debt. As a result of the expansionary fiscal stance, government debt to the banking sector increased steeply after 2015, culminating in a prolonged financial crisis that severely limited credit to the economy and resulted in cash shortages, prompting banks to limit cash withdrawals and import payments as they had depleted their US dollar reserves.
Issuance of Treasury Bills went into over-drive, quadrupling from US$2.1
billion in 2016 to a cumulative US$7.6 billion, by end of August 2018.

During the period January to August 2018 alone, Government issued Treasury
bills and bonds worth US$2.5 billion.

Resultantly, outstanding Government Securities stood at US$6.2 billion as at
end of August 2018.

While the ratio of Treasury Bills to GDP was at 4.4% in 2014, it increased
sharply to 36.5% by end of August 2018.

Government’s overdraft facility at the Central Bank to finance the deficit at
US$2.3 billion as at end of August 2018, is three times higher than the
statutory limit of US$762.8 million.

Regrettably, the overdraft facility increased by US$1.11 billion for the period
January to September 2018 and is projected to close the year at US$2.5
billion, well above the stipulated statutory limit.

It also violated the requirement of Section 11(1) of the Reserve Bank Act
[Chapter 22:15], which states that borrowing from the Reserve Bank shall not
exceed 20% of the previous year’s Government revenues at any given point.
Trends in Liquid Cash Availability
Inflation Outlook
Significantly, annual inflation, which had dropped from 3.7% in 2012 to 1.6% in
2013, slumped into a deflation at -0.2% in 2014 and -2.4% in 2015 largely
reflecting a depreciating South African rand - Zimbabwe’s major trading partner
- and weakening domestic demand. It however trended upwards throughout
2016, averaging -1.6% in 2016 and 0.9% in 2017 (0.8% in September, 2.2% in
October, 3% in November & 3.5% in December 2017).

Economy is now out of the deflation, rising in 2018 as follows: 3.5% in January,
3% in February, 2.7% in March, 2.71% in April 2018, 2.71 in May , 2.91 in June,
4.3% in July, 4.8% in August, 5.39% in September 2018, spiking to 20.85% in
October 2018. SADC macro-economic convergence target of inflation of 3-7%.

General price hikes driven by foreign exchange rate premiums associated with
the mis-match between electronic bank balances and available foreign
exchange.

The upsurge in annual inflation rate is mainly driven by food and non-food items
such as transport services.
Unsustainable public debt…
Total Debt (debt distress): The economy is saddled with a high debt overhang with an
estimated public debt stood of US$17.69 billion as at end of August 2018, of which
domestic debt accounted for 54% up from 49%, while external debt moved down from
51% to 46%.

By end of 2018, it is estimated that the public debt statutory limit of 70% is likely to be
breached.

Emergence of domestic debt from as low as US$275.8 million in 2012 to US$9.5 billion.

Consistent with the Arrears Clearance Strategy agreed with creditors in Lima in October
2015, Zimbabwe settled its overdue obligations to the IMF amounting to US$107.9
million on 20 October 2016.

As a result the IMF Board remove sanctions on Zimbabwe related to remedial measures
applied on account of overdue financial obligations to the Poverty Reduction and Growth
Trust (PRGT).

The remedial measures removed related to:
i.    Declaration of non-cooperation with the IMF;
ii.   Suspension of technical assistance; and
iii.  Removal of Zimbabwe on the list of PRGT-eligible countries.
External debt arrears amount to about US$5.6 billion, which is split
between:
• Multilateral creditors, US$2.2 billion.
• The Paris Club, an informal group of creditor nations, US$2.7
    billion.
• Non-Paris Club creditors, US$700 million.

Bali Arrears clearance strategy agreed to in October 2018 to prioritize
the US$US$2.4 billion owed to the creditors of choice as follows:
US$680 million to the AfDB; US$1.4 billion to the World Bank; and
US$308 million to the European Investment Bank.

The Minister of Finance & Economic Development has indicated
arrears should be cleared in 12 months. In the context of austerity, this
will even limit further the fiscal space for social development.
The 2019 Fiscal Framework With nominal GDP projected at US$31.6 billion in 2019, revenues are estimated at US$6.6 billion for 2019: retentions (US$400 million or 6%), taxes (US$6.037 billion or 91.5%), and non-tax (US$162 million or 2.5%). Expenditures are projected at US$8.2 billion: with capital expenditures estimated at US$2.018 billion (or 24.6%), leaving US$6.1 billion for current expenditures (74.4%). The budget deficit is projected at US$1.6 billion or 5% of GDP in 2019; 4.1% in 2020, and 3% in 2021. Restructuring the Treasury bills to longer tenure in consultations with market players. No further acquisitions of non-performing loans by Zimbabwe Asset Management Company (ZAMCO) – Parliament needs to do an audit of what non-performing loans were acquired.
To address the risk of a higher Budget deficit for 2018 and 2019, Government
introduced the 2% intermediated money transfer tax, with effect from 13
October 2018.

From 2019, Budget to invariably focus more on output, results, and impact
(theory of change), service delivery and accountability.

Government is reducing recourse to Central Bank lending from the 20% of
previous year’s revenues statutory limit, to a maximum of 5% confined for
purposes of smoothening cash flow mismatches.

Package of wage and nonwage expenditure rationalisation measures as
follows:
• Effective 1 January 2019, a 5% cut on basic salary for all senior positions
    from Principal Directors, Permanent Secretaries and their equivalents up
    to Deputy Ministers, Ministers and the Presidium. Extended to basic
    salaries of those in designated posts in State Owned Enterprises (CEOs,
    Executive Directors and equivalent grades), including Constitutional
    Commissions and grant aided institutions;
• Henceforth, the 13th Cheque to be computed based on Basic Salary only
    (excluding housing and transport allowances) (bonuses have amounted to
    US$174.6 million);
• Government to cut the 46 Embassies & Consulates around the world staffed by around 581 home based and locally recruited staff to reduce the US$65 million being incurred in line with the capacity of US$50 million annually; • Cabinet decision of December 2017 to terminate employment contracts of 3 188 Youth Officers to be implemented (US$5.2 million for cash-in-lieu of notice, & US$17.7 million for pension benefits); • The remaining 2 917 Youth Officers to be retired by end of December 2018. However, need to check with 2011 and 2015 Civil Service Audits that pointed to the existence of irregularly employed people; • Retirement of Government officials above the age of 65; • As approved by Cabinet on 5 December 2017, the administration of the Public Service Payroll and Pension to become a Treasury responsibility, with effect from 1 January 2018; • Biometric Register for Civil Servants with effect from 1 January 2019; • All Government pool/project vehicles to be parked at the work stations or the nearest police station after designated working hours, during weekends and public holidays; • All Government pool vehicles to be transferred and centrally managed through CMED Pvt Ltd. Entities with capacity to maintain their fleet will be excluded from this directive; • Government Ministries and Departments to remit all revenue collected into the Consolidated Revenue Fund, with immediate effect. Outstanding balances to be deposited into the Consolidated Revenue Fund by 23 November 2018.
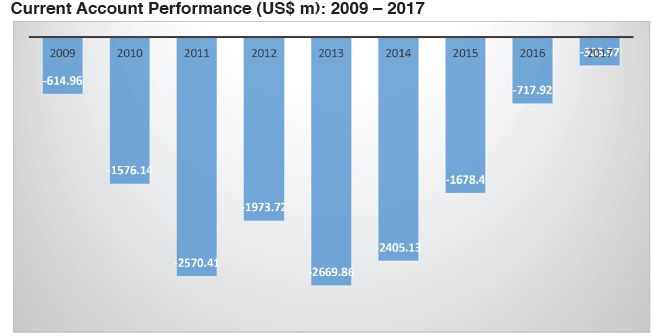
Current Account Deficit
Global Competitiveness, Ease of Doing Business, Economic Freedom and
Corruption Perception Rankings, 2007/08-2017/18

                                               Heritage
                                               Foundation     Transparency-
                                               Index of       International
           WEF Global           WB Ease of     Economic       Corruption
Period     Competitiveness      Doing Business Freedom        Perception
2007/08    129/131              154/183                       150/179
2008/09    118/121              160/183        145/147        166/180
2009/10    132/134              156/183        175/179        146/180
2010/11    136/139              157/183        178/179        134/178
2011/12    132/142              170/183        175/177        154/183
2012/13    132/144              172/185        175/184        163/176
2013/14    131/148              170/189        176/178        157/177
2014/15    124/144              171/189        175/178        150/168
2015/16    125/140              155/189        175/178        125/140
2016/17    126/138              161/190        175/180        154/176
2017/18    124/137              159/190        174/180        157/180
Measures to address the current account deficit include the following:
i. Supporting export oriented production e.g. horticulture;
ii. Strategically manage available foreign currency by prioritising import
substitution production e.g. retooling and raw materials;
iii. Decisive action on revival of ZISCO Steel and Cold Storage Commission, local
drug manufacturing etc. to boost exports while limiting on import demand;
iv. Value addition and beneficiation in mining and agriculture;
v. Review import duty dispensation for some of the projects and programmes,
e.g. National Project Status.
Operationalisation of the Monetary Policy Committee by the first quarter of 2019.
The multi-currency system to remain in place, with the US dollar being the
currency of reference, out of the currency basket.
Gradual movement towards a more efficient and optimal foreign currency
allocation system, e.g. a Foreign Currency Allocation Committee to promote
efficient management of foreign currency inflows.
Build adequate foreign currency reserves, including gold reserves, to provide an
anchor for preservation of exchange value. To be supported by the
operationalization of the Sovereign Wealth Fund.Overvaluation of the USD, 2010-15 (%)
50
45 45
40 40
35
32
30
25 24
20
15
13
10
5 4
0
2010 2011 2012 2013 2014 2015
Source: Reserve Bank of Zimbabwe unpublished data.FDI flows into selected Southern African economies, US$m
2012 2013 2014 2015 2016 2017
Botswana 487 398 515 679 129 401
Mozambique 5,629 6,175 4,902 3,867 3,093 2,293
Namibia 1,122 770 441 1,247 361 416
South Africa 4,559 8,300 5,771 1,729 2,235 1,325
Zambia 1,732 2,100 1,489 1,305 663 1,091
Zimbabwe 400 400 545 421 372 289
Southern Africa 7,330 11,677 16,370 19,028 11,437 3,836
Source: UNCTAD 2018 World Investment Report.Implementing the Gender Responsive Budgeting Strategy and the National Gender Policy – has assumed the status of a cliché. Speeding up of ease of doing business reforms, including the long awaited operationalisation of the Zimbabwe Investment and Development Agency, ZIDA.
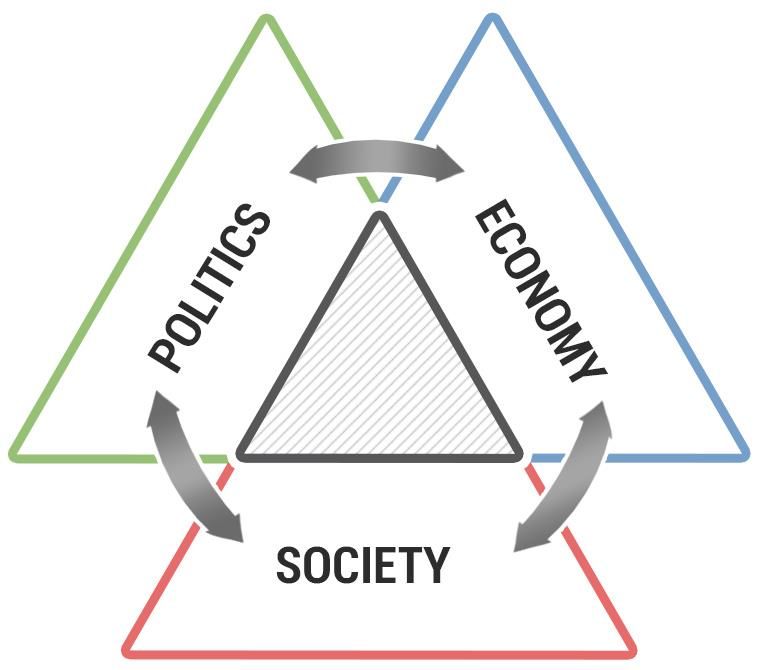
‘Weak-institutions trap’ (WIT)

• It takes ‘strong’ institutions which are the critical factor in
  sustaining growth beyond the initial take-off or ‘growth
  acceleration’.

• Zimbabwe has been caught in WIT for a long time – resulting in
  the country’s poor long-run growth record, weak poverty
  reduction - all attributed to weak institutions, including
  institutions of the State.

• Long-term and sustained growth can only come about under
  conditions of sound macroeconomic fundamentals or growth
  oriented political institutions.
                                                             37
Public Enterprise Reforms
Public enterprises’ contribution to the economy down from around
60% to about 2%.
70% of these entities are technically insolvent.
Rolling out our parastatal reforms on a roll out template which
categorises the entities under the following:
i. State Owned Enterprises to be partially privatised through JVs
and/or listing;
ii. State Owned Enterprises to be fully privatised; and
iii. State Owned Enterprises facing liquidation.
The 2019 Budget proposes the privatisation of at least 5 public
enterprises, namely Tel-One/Net-One/Telecel, ZIMPOST and POSB with
the expected proceeds of at least US$350 million.Budget Sectoral Allocations An estimated US$310 million in fiscal transfers is earmarked for support to Provincial Councils for 2019 in line with the Constitutional requirement that 5% of revenues goes to Provincial Councils. Actual allocations per province to be based on (i) Population profile; (ii) Poverty profile; and (iii) Infrastructure quality and deficit. US$989.3 million to the Ministry of Lands, Agriculture, Water, Climate and Rural Resettlement. US$53 million towards payment of compensation to former white farm owners, whose disbursement will be targeted. Target to allocate 12.6% of the total budget to infrastructure development programmes (excluding agriculture), up from 10.2% of the 2018 Budget.
Based on the Transitional Stabilisation Programme, the
following projects have been accorded high priority:
i. Dualisation and upgrading of Harare-Beitbridge road - “A
     road is an economy”;
ii. Expansion of Hwange 7 & 8;
iii. Expansion of Robert Gabriel Mugabe International
     Airport;
iv. Upgrading and Modernisation of Beitbridge Boarder Post;
v. Kunzvi Dam & Conveyancing Infrastructure;
vi. Gwayi Shangani Dam and Conveyancing Infrastructure;
     and
vii. Lupane Provincial Hospital.
Key initiatives include the following:
i. Setting up industrial parks;
ii. Establishment of innovation hubs and spin
off industries;
iii. Incubation of science and technology based
industries; and
iv. Promote research and development for
modernisation and industrialisation.Budget Allocation by Ministry / Sector (%) of Total Expenditures Ministry / Sector 2018 2019 Primary & Secondary Education 12.9 11.0 Lands, Agriculture, Water & Rural Resettlement 8.4 9.6 Health & Child Welfare 6.8 6.7 Defence & War Veterans 6.1 5.3 Public Service, Labour & Social Welfare 3.0 3.2 Industry & Commerce 0.3 0.5 Women’s Affairs, Community Development & SME Development 0.3 0.4 Energy & Power Development 0.2 0.2 Zimbabwe Anti-Corruption Commission 0.1 0.1
The allocations to primary and Secondary Education, at 12.9% in 2018 and 10.2% in 2019 are
way below the 20% stipulated in the Dakar Declaration.

Worse still, 93.7% (2018) and 90.2% (2019) of the allocation to Primary and Secondary
Education are for employment costs.

The allocations at 8.4% (2018) and 9% (2019) are close to the 10% stipulated in the Maputo
Declaration.

The allocations of 6.8% (2018) and 7.1% (2019) for health are way below the requirement of
15% in the Abuja Declaration.

The allocations for the Ministries Responsible for Women’s Affairs, and Industry & Commerce
are way below what would be required given heir mandate for empowering the
disadvantaged groups, transitioning informality to formality and business development.

In the National Social Protection Policy Framework (NSPPF), the target was to consider as
eligible for all forms of social assistance in the short to medium term all the 500,000
households which are deemed to be below the Food Poverty Line. On the basis of the
US$US$19,298,000 allocated for social welfare in 2018, each household would get a meagre
US$38.60 per year and US$70.55 in 2019. On the basis of the 415,900 vulnerable children to
be reached with educational support, the US$23,485,000 allocated to child welfare in 2018
works out at US$56.47 per child per year for 2018, while the US$31,592,000 allocated for
child welfare yields a support level of US$75.96 per child per year.
Proposed Strategic Objectives and Thrusts
A. Macroeconomic stability: fiscal reforms for fiscal and debt sustainability, and
reprioritization of expenditures

• Rationalisation of expenditures and improving the expenditure mix.

• Expedite State-Owned Enterprise (SOE) Reforms.

• Create fiscal space for development: accelerate re-engagement; expand the
  tax-base; reprioritize and enhance efficiency of expenditures, and seek debt
  relief.

• Accelerate cost and ease of doing business reforms and promote policy
  coherence and consistency (adopt broad-based indigenization, bring land
  distribution to a closure, adopt secure land tenure system - 99-year leases -,
  and secure property rights).

• Enhance external arrears clearance, debt resolution and the re-engagement
  process to facilitate access to external financing; and strengthen national debt
  management capacity.
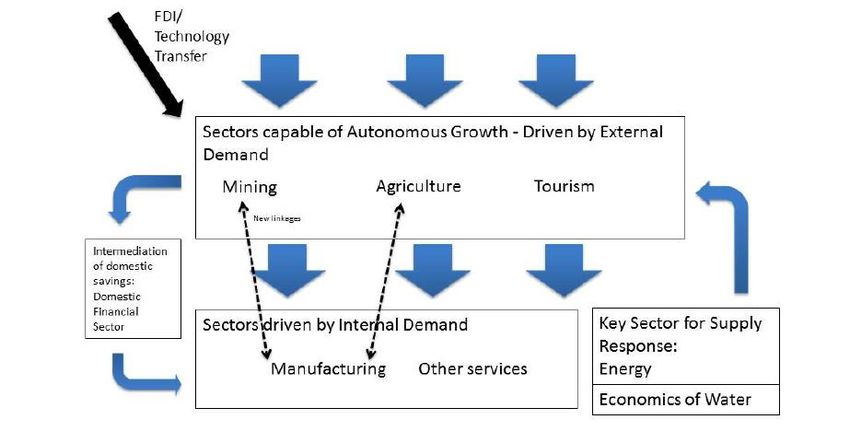
B. Building Linkages by Leveraging Natural Resources: Promote Inclusive, Pro-
poor Growth: Re-build Sectoral Linkages through Value Chains and Clusters
• In this current phase of recovery, the mining sector is
  emerging as the main sector capable of autonomous
  growth.

• The restructured agricultural sector also has potential of
  supply-response to improved conditions, as well as tourism.

• However, growth in the manufacturing sector appears more
  dependent on the internal demand generated by the two
  main driving sectors (agriculture and mining).

• Hence, the quality of policy in the mining and agricultural
  sector will in the main be the major determinants of the
  rate of growth of the economy.
Schematic illustration of linkages in the post-crisis
   Zimbabwean economy (World Bank, 2012)
Schematic illustration of linkages in the post-crisis
   Zimbabwean economy (World Bank, 2012)
There is plenty of potential to turn the trend around and find new and
    strengthen existing sources of sustainable growth (ILO, 2016).

Agriculture: Regain lost productivity and strengthen linkages to industry;

Agriculture has unique opportunities (the 9 commodity industry groups or
clusters), namely, (i) horticulture; (ii) livestock and meat; (iii) legumes and
oilseeds; (iv) tree crops; (v) grains; (vi) cotton; (vii) tobacco; and (ix) forestry and
timber.

Mining: We missed the commodity boom, but the potential remains;

Manufacturing: Highly correlated with agriculture –high potential for regaining
ground;

Services: Focus on areas of high potential –tourism, infrastructure, financial
services.
Value chains mapping…
The Confederation of Zimbabwe Industries (CZI) has identified 18
sustainable value chains to drive re-industrialization as follows:
1. Asbestos-to-roofing/piping-to-construction materials value chain;
2. Diamond-to-Jewellery-to-ornament value chain;
3. Gold-to-Jewellery-to-ornament value chain;
4. Chrome ore-to-Chromium-to-Chrome plated goods value chain;
5. Iron ore-to-billet-to-foundry-to-fabricated steel product value
chain;
6. Limestone-to-Quarry-to-Cement-to-Construction;
7. Coal Bed Methane-to-Gas-to-Plastics & allied value chain;
8. Cotton-to-clothing value chains;
9. Soya-to-white meats value chains (incorporating stock-feeds for
the beef industry);
10. Tobacco-to-cigarette value chains;11. Maize-to-mealie meal value chain (incorporating stock-
feeds for the beef industry);
12. Wheat-to-bread value chain (incorporating stock-feeds);
13. Barley/sorghum-to-beer value chain;
14. Beef-to-milk-to-leather value chains;
15. Horticulture production-to-can/packet/bottle value chains
(non-GMO);
16. Regional-assembly-finishing value chains (including
automotives, plastics, paper and ICT);
17. Beverages value chain (including tea); and
18. Pharmaceuticals Pharmacy Hospital Patient Value Chain.Spatial Linkages:
Infrastructure (transport,
power, ICT) and LED
Forward Linkages:
Intermediate products =>
Backward Manufacturing; Logistics ;
Linkages other sectors (agriculture ,
Inputs: forestry, fisheries, etc.)
Mining: Concentration,
Capital goods smelting, refining => metal/alloy Fiscal linkages:
Consumables
Resource rent capture (RRT) &
Services
deployment: long-term
human & physical
Knowledge Linkages infrastructure development
HRD: skills formation
R&D: tech development
Geo-knowledge (survey)Enhancing Transparency and Accountability and
Promoting Artisanal Miners in Chile
Enhancing transparency and accountability around mineral revenues: The
example from Chile is useful where the Government adopted a Transparency
and Access to Public Information Law for all public agencies. In terms of
reporting the Finance Ministry regularly publishes information on production
volumes, prices, mineral export values, royalties and special taxes and
audited financial statements and annual reports are regularly published.
An example of formalisation would entail linking artisanal miners to
established mining houses as was done in Chile where the government set up
the Empresa Nacional de Mineria (ENAMI), (the sixth largest copper exporter
in Chile), whose Board of Directors is made up of the Minister of Mining, a
representative of the Minister of Finance, a representative of the President, a
representative of COCHILCO, the copper advisory agency and SONAMI, an
industry association comprising small, medium-sized and large copper
producers, with a mission of providing technical, financial, and metallurgical
production and trading services that ASM miners require in order to be
competitive.C. What shall we Laisser
do with faire ? Forbid ?
informality?Institutional and Policy Strategies for Addressing
Informality
• Given the heterogeneity of the informal sector, there is no ‘one-
size-fits-all’ policy response valid across countries and within a
country.
• Considering its size in developing countries, policy makers should
consider the impact of every policy decision on the informal
economy.
• In addition, people making a living in the sector should be consulted
to gain inside knowledge.
• The policy measures should be based on an understanding of the
reasons why people work in the informal economy, namely,
whether informality is a choice or rather is due to exclusion from
the formal sector.Ways out of informality:
• Policy guidance from the new ILO R204 (Transition
from the Informal to the Formal Economy
Recommendation, 2015).
• The need for integrated strategies.
Informal Formal
Economy economyThe significance of the new R204
First international standard to provide both a normative and a
developmental framework :
Focusing on the informal economy in its entirety and
diversity;
Indicating a clear orientation and practical guidance for
moving out of informality and transitioning to the formal
economy through integrated strategies;
Encapsulating good practices in transition to formality and at
the same time open to policy innovations;
A Recommendation adopted through a strong tripartite
(governments, employers and workers) consensusGuiding principles of R204
i. tailored approaches to respond to the diversity of
situations and the specificity of national
circumstances;
ii. coherence and coordination across a broad range
of policy areas: employment and income
opportunities, social protection and rights;
iii. A balanced approach combining incentives with
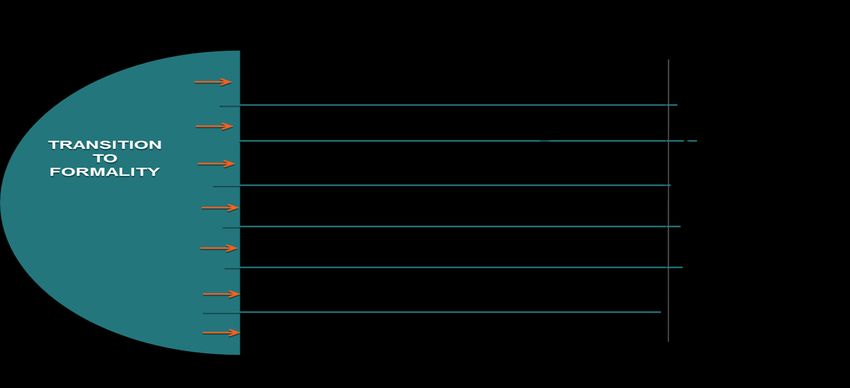
compliance.A typology of formalization Formalization of economic units – Registration of economic units – Increased compliance – Extension in application of labour and social security regulation Formalization of jobs – Extension of application of labour regulation – Extension of coverage of social security – Registration of employment relationship – Registration of own-account endeavours Productive job creation in the formal economy – Most new entrants have access to employment in the formal economy – Increased formal employment intensity of growth.
•   For individuals (workers and/or employers) •          For society at large
     – Improved access to rights at work, social           – Broadening the tax base (increasing the
         security and decent working conditions;              scope of public action, reducing tax
     – Better access to representation and national           rates, etc.);
         policy dialogue;
                                                           – Increased equity with regard to the
•   For enterprises                                           contribution to public budget and to
     – Better access to credit and other productive           benefits of redistributive policies;
         factors, including through public
                                                           – Increased efficiency and sustainability
         programmes;
                                                              of preventive & compensative measures
     – Expanded access to markets: participation in           to address risks;
         public procurements, access to imports and
         exports through formal channels;                  – Fairer competition in national and
                                                              international markets
     – Reduction of the influence of corruption,
         greater respect for commercial contracts, etc.    – Greater social cohesion
LAC countries have made progress!
D. Building a Democratic Developmental State

What is needed is the ability of the state to use its
autonomy to consult, negotiate and build
consensus with social partners, at the same time
building capacity to effectively implement economic
policies.

• This state capacity, will only come through the
  building of a ‘democratic developmental state’

                                                   63
E. Need for a Social Contract & Implementation of Agreed Positions:
In view of the trade-offs in policies (e.g. containment and reduction of the
share of revenues taken up by employment costs), arrears clearance etc.
there is need for Zimbabwe to negotiate and implement a Social
Contract.
A Social Contract helps restore good faith (trust) amongst the social partners;
make them accountable to each other; help parties subordinate sectarian
interests to national interests; develop and share a common vision; and
inculcate a smart-partnership win-win mind-set.
Furthermore, there is an urgent need to implement the agreed TNF protocols
such as the Kadoma Declaration, the Principles of the TNF and the
National Productivity Institute launched in February 2003 to spearhead
the promotion of a culture of productivity.The technical challenges are often overshadowed by the political. There is nothing more difficult to carry out … than to initiate a new order of things. For the reformer has enemies in all who profit from the old order and only lukewarm support from those who would benefit from the new. (Machiavelli, The Prince, 1513)
THANK YOU!
You can also read