Analyzing and Visualizing Twitter Conversations - AI4Society
←
→
Page content transcription
If your browser does not render page correctly, please read the page content below

Analyzing and Visualizing Twitter Conversations                                     CASCON'21, November 22 - 26 2021, Toronto, Canada

               Analyzing and Visualizing Twitter Conversations
            Candelario A. Gutierrez Gutierrez† (cagutier@ualberta.ca), Andrea Whittaker †
       (amwhitta@ualberta.ca), Katherine Mae Patenio † (patenio@ualberta.ca), Joel Gehman *
         (jgehman@gwu.edu), Lianne M. Lefsrud †† (lefsrud@ualberta.ca), Denilson Barbosa †
                 (denilson@ualberta.ca), and Eleni Stroulia† (stroulia@ualberta.ca)
     † Computing Science, University of Alberta, Edmonton Alberta Canada
     * Strategic Management and Public Policy; George Washington University, Washington D.C. United States
     †† Chemical and Materials Engineering, University of Alberta, Edmonton Alberta Canada

ABSTRACT                                                                 disgruntled customer about a corporation’s poor service can
                                                                         cause a public-opinion fallout and push a multitude of clients
Social media platforms are public venues where conversations             away from the brand. Third, online stakeholder activism can
about issues of public interest take place. Much recent                  create an existential crisis for organizations that use purely
research has been devoted to evaluating the degree to which              technical methods of delineating their context and identifying
online conversations capture public opinion on issues of                 and evaluating their risks. Technical approaches to risk
broad societal interest. We describe a robust and scalable               evaluation, like cost-benefit analysis “generally cannot resolve
platform to support such studies. Our platform allows the                strong differences in value judgments that are often present in
analysis of three semantic aspects of tweets, namely the                 controversial projects” [28]. Finally, online conversations
personal values, sentiment, and humor expressed in them, as              about one topic are inter-related with many conversations on
well as the public’s engagement with them. In addition, it               other related topics. For example, discussions about
aggregates these indicators at the level of tweet authors to             invest/divest intermingle with policy discussions about
shed light on the activities and style of influencers of public          climate change [32].
opinion. Finally, it offers rich visualizations to enable users to
gain insights on their datasets. We demonstrate the usefulness           These shifts to online discussion and mediation affect a broad
of our platform with two case studies: (a) analyzing the                 set of outcomes, including patterns of collaboration, strategy,
fragmented narratives around established (hydro, oil and gas,            and behaviour, resulting in substantial interest in developing
coal, nuclear) and new (solar, wind, geothermal, biomass)                computational methods for understanding the conversations
energy sources; and (b) comparing the social-media brands of             that take place on social platforms [41]. These include
academic institutions.                                                   algorithms for analyzing the structure of the social network,
                                                                         i.e., its key influencers, the network embedded communities,
CCS CONCEPTS                                                             and their evolution [3, 17]; the topics of the conversations and
semantic analysis, sentiment, data visualization, case studies           their spatiotemporal trends [33]; and the emotional valence
                                                                         and arousal of the various contributions [29].
KEYWORDS
                                                                         As the research matures, more studies are being conducted on
social media, personal values, humor, energy narratives,                 social platforms, and especially on Twitter, as it offers fairly
academic institutions' brands                                            open access to its data for which numerous software libraries
                                                                         are available on code-sharing platforms. Indicatively, a
                                                                         cursory search on Google Scholar at the time of writing with
1   Introduction                                                         variations on the search phrase “twitter analysis for covid”
Recently, conversations about public interest issues have                returns more than 200 publications in 2021 alone. Evidently a
shifted. First, they have shifted in location: from mediated             platform to conduct such studies would enable a more
traditional media sources to unmediated online media, blogs,             efficient exchange of data and findings, and the replicability of
and webpages. For many controversial issues such as pipeline             the related research.
developments, or climate change, or COVID-19 public-safety
measures, rather than a central organization defining its
stakeholders, individuals and organizations are self-                    Permission to make digital or hard copies of part or all of this work for personal
identifying with issues, opting into increasingly unmediated             or classroom use is granted without fee provided that copies are not made or
debate, and actively evaluating risks and rejecting the                  distributed for profit or commercial advantage and that copies bear this notice
                                                                         and the full citation on the first page. Copyrights for third-party components of
positions of organizations and even regulators [23, 24].                 this work must be honoured. For all other uses, contact the owner/author(s).
Second, online conversations — meaning, value, and emotions              CASCON’21, Nov 22-26, 2021, Toronto, Canada ©2021 Copyright held by the
— have lasting financial consequences [22]: a tweet from a               owner/author(s).

                                                                     1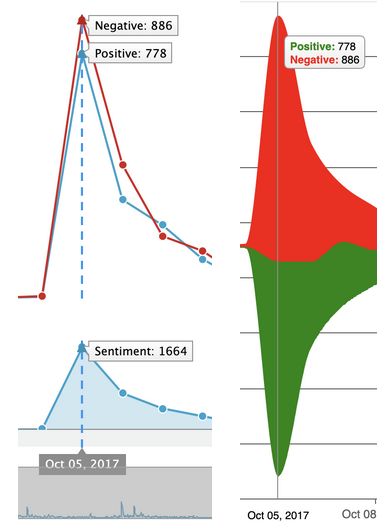
CASCON'21, November 22 - 26 2021, Toronto, Canada                                                                        C. Gutierrez et al.

To that end, we have developed a robust and scalable platform              values (e.g., tolerance, dominance, dependability) within 10
that analyzes three semantic aspects of tweets: personal                   aggregate dimensions (e.g., self-protection versus growth,
values, sentiment, and humor expressed, and public                         personal focus versus social focus).
engagement with them. From this, we aggregate these
indicators to the level of Twitter users to examine their                  A humor dictionary has been created by Westbury and Hollis
overall “style” of contributions and their relative influence.             [51], based on predictions of the funniness of words. They
Finally, we develop complementary rich visualizations to                   analyzed the semantic, phonological, orthographic, and
expose insights on such datasets. We demonstrate the                       frequency factors that play a role in the judgments of humor.
usefulness of our platform with two case studies: (a) analyzing            From this, they were able to predict the original humor rating
the fragmented narratives around established (hydro, oil and               norms and ratings for previously unrated words with greater
gas, coal, nuclear) and new (solar, wind, geothermal, biomass)             reliability. Their findings are consistent with several theories
energy sources; and (b) comparing the social-media brands of               of humor, especially the incongruity theory, which suggests
academic institutions.                                                     that individuals’ experience of humor is proportional to the
                                                                           degree to which expectations are violated. Humor increases
The rest of this paper is organized as follows. Section 2 briefly          the likelihood of persuasion, knowledge, and attitudes [49].
summarizes the basic techniques integrated in our platform.
Section 3 describes its software architecture, and the                     The sentiment dictionary of Hu and Liu [15], composed of
visualizations currently implemented in our platform and the               around 6,800 words, is categorized by positive and negative
questions they are meant to help answer. Section 4 describes               emotional valence. It was first created from opinion based
our experience with two different data sets. Finally, Section 5            online content and we found it useful for our methodology
concludes with a summary of our work and our future plans.                 because it was designed with social media applications in
                                                                           mind.
2    Background and Related Research
                                                                           2.2 Aspect-Based Sentiment Analysis
2.1 Dictionary-based Analysis
                                                                           Aspect-based sentiment analysis aims at identifying the
A key methodology for semantic analysis of text is the use of              aspects of the entities mentioned in text and determine the
standardized dictionaries, expertly curated to associate words             sentiment of the author toward those aspects. A popular
with interesting semantic dimensions. Dictionary-based text                approach to this task is to use dependency parsing as a way of
analysis is conceptually simple and efficient. Once a dictionary           isolating the aspect of interest along with its modifying words
has been curated and demonstrated to be valid, software                    [34, 52]. The emotional valence of the modifying words is then
systems can easily incorporate it in their processing, in a                evaluated through lexicons or rule-based models. This is the
manner that can be scalable to large text corpora, through                 approach to that we take in our work, as alternative models
data parallelism.                                                          are highly domain specific and require large amounts of
                                                                           labelled data.
Our platform incorporates three dictionaries. The personal
values dictionary created by [37] can be seen as a model of the            2.3 Social-Platforms Analysis
personal values expressed in text but compared to ours it does
not take context of the words into consideration. Values have              Social media data have been widely used to support different
been a topic of longstanding and continuing interest across a              domains of studies such as marketing and consumer behavior
variety of social scientific disciplines [8, 11, 13, 35, 40, 42, 45,       [12], smart cities [26], disaster management [20], health [4]
50]. Within this stream, a key contribution has been                       and more. Hence, different frameworks and platforms have
Schwartz’s [42, 43, 44] work, which focuses on value                       been proposed and have shown to be favorable for social
priorities, theorizing their role in influencing behavioral                media analysis [1, 2, 7, 30, 36, 38, 47]. However, they all work
orientations and choices such as ideologies, attitudes, and                with complex models that require high volume of labelled
actions of individuals. Within this perspective, values are                data and other complexities that make studies hard to
considered essential to self-understanding as well as criteria             replicate in another domain. Furthermore, several analysis
used to select and justify action and to evaluate actors and               results are presented through a specific package for a
events [40, 42]. Values also are meaningful and relevant at                programming language, making it hard for the inexperienced
both the individual and collective levels [18, 19]. Values also            audience to interact with the insights that are not fully
play a key role in shaping social reality and structures [21,              understood because of visualizations’ incorrect use. Finally,
50]. Finally, although many scholars define values as                      most studies do not fully exploit the potential of
conceptions of the desirable, others define them in terms of               conversational data through the measurement of engagement
what is undesirable, e.g. [10]. In particular, our model builds            and the metadata that can be extracted from it.
on Schwartz’s circumplex model which nests 57 discrete

                                                                       2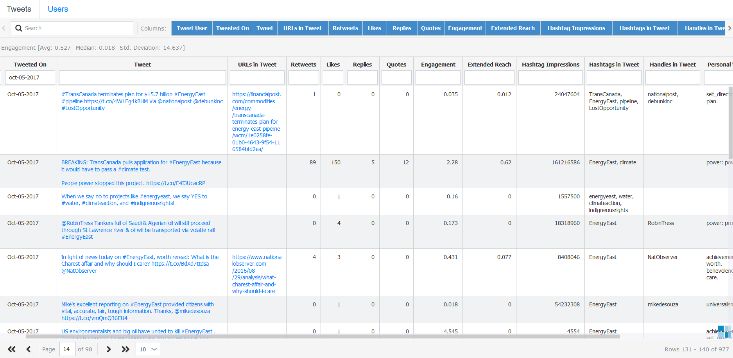
Analyzing and Visualizing Twitter Conversations                              CASCON'21, November 22 - 26 2021, Toronto, Canada

                                             Figure 1. Architecture of the Platform

On the other hand, there are several studies demonstrating           find their corresponding match, and in case there were
that lexicon-based methodologies can perform well and                ambiguous words, they would apply a semantic tagger and a
reduce complexity to understand semantics of text. McCaig et         sentiment analyzer to conserve only hate words. A
al. [27] analyzed Reddit conversations to measure the                geolocation filter was also applied to set boundaries while
relevance of 4 concepts: fitness trackers, eating, body and          extracting the data. Their results were presented in a
exercise. Each concept was represented as a list of previously       geographic map where they denoted the degrees of hate
studied words. These word lists were then matched in the             speech through colors: green as none, yellow as moderate and
posted comments to obtain word frequencies per list. They            red as frequent.
also calculated other metrics such as the number of threads,
the number of comments, the number of unique commenters              Al-Daihani and Abrahams [5] extracted Facebook data related
and the average number of comments by each unique                    to libraries from high performing schools present in Canada,
commenter.                                                           the United Kingdom, Australia, and the United States. Their
                                                                     metrics of interest were the number of page likes, post likes
Alomari and Mehmood [6] extracted a set of tweets in Arabic          and post comments. They defined engagement as a
language coming from popular accounts that mention the               multiplication of likes and comments. Statistical analysis such
same city’s location and constructed 4 different dictionaries        as min, max, average, std. deviation and median were analyzed
containing: street names of the city’s location, synonyms of         over the metrics of interest. They compared cumulative data
traffic, traffic reasons, and transportation words. They then        per country where they got to compare metrics and they used
used these dictionaries to find matches in the tweets that           unigrams and bigrams to calculate word frequency. All the
were used to create a tag per match. The resulting tags got          results were showed in horizontal bar and line charts.
presented in a cone chart to visualize volume, a pie chart to
show streets congestion, a horizontal bar chart to show              We propose a configurable platform alongside a methodology
posted tweets per hour, and a cloud chart to visualize the           to work with social media data. Through the unification of
traffic synonyms, reasons, and transportation words.                 lexicon-based and engagement analysis that can be
                                                                     interpreted through a useful set of visualizations.
Lingiardi et al. [25] extracted data from Facebook and Twitter
to locate zones that hate speech was most widely happening           3   Software Architecture
around Italy. They achieved this by gathering a set of
previously studied insulting words in Italian, used against          Social media is a prime example of semi-structured data
different minority groups. This set of words would later be          consisting primarily of free-form texts, called posts, containing
used against the data extracted from the social platforms to         references to users (e.g., "at mentions" in Twitter), topics of

                                                                 3
CASCON'21, November 22 - 26 2021, Toronto, Canada                                                                            C. Gutierrez et al.

interest (e.g., hashtags), or other posts (e.g., "re-tweets" in              transformed to lowercase. As a final step, Spark NLP’s 8
Twitter). Because each post has a unique identifier, social                  lemmatization module is used to convert all the tweets’ words
media corpora are best handled by modern key-value stores                    into their base form. Once tweets are normalized, they are
which are part of the no-SQL family. On the other hand, one                  processed to extract word frequencies depending on the
also needs the help of a powerful query language to gather                   dictionary.
insights from aggregated data. Finally, social media corpora
can easily grow to terabytes, implying that a distributed and                Another pipeline prepares the tweets for the aspect-based
easily parallelizable architecture is needed. For these reasons              sentiment analysis by removing numbers, URLs and twitter
we chose CrateDB1, a scalable key-value store, a tried and true              handles (as they do not convey opinions or sentiment and can
highly performant open-source DBMS, as our back-end. Next,                   thus be ignored); lowercasing all words, except those with all
we explain how we handle the posts, starting from processing                 letters capitalized (as sentiment analysis tools see that as a
the texts for subsequent analysis.                                           signal of strong arousal of emotion); and splitting hashtags
                                                                             into words using the CrazyTokenizer [31] (as unlike URLs and
Figure 1 diagrammatically depicts an overview of our                         handles, hashtags can express sentiment); and preserving
platform architecture. A detailed description of how this                    punctuation (as sentiment analysis tools often rely on them as
platform works is presented below.                                           features).

3.1 Data Collection                                                          The aspect-based sentiment analysis process starts with
                                                                             dependency parsing, using SpaCy [14], to reveal the
The data-collection process is given as input a period during                relationships between words that modify the meaning of
which the tweets to be collected have appeared; a list of                    other words. More precisely, the modifiers of each aspect
hashtags that should be included in the tweets, or a list of                 found in the tweet are examined in search of emotive words
keywords that should be mentioned in them; and, optionally, a                that directly relate to the aspect. When multiple aspects are
list of users whose tweets should be collected. In principle                 found in the tweet, they are separated in the dependency
there are two ways to collect a set of tweets: (a) using                     structure and their specific modifiers can later be analyzed for
Twitter’s API full-archive search endpoint2 or (b) using Twint3              sentiment independently. When no modifiers are attached to
a scraper library that gathers tweets from users’ timelines.                 an aspect, the emotive words within a window of 3 words
The former is more reliable if the period is of importance, the              preceding and 3 words following the aspect are collected. We
latter when a list of users are of interest. Our platform                    use VADER [16] to measure sentiment, as it is rule-based and
includes two different Twitter clients to support both the                   has been shown highly effective for social media. We use the
above data-collection methods that export the collected                      compound polarity score from VADER to quantify the
tweets into a single CSV.                                                    sentiment of the noun chunk, using traditional ranges of (-1.0,-
                                                                             0.5), (-0.5,0.5), (0.5,1) to mean negative, neutral, and positive
3.2 Data Processing & Analysis                                               respectfully.

This CSV is subsequently loaded into Apache Spark4 in local                  b) A set of extraction functions collect and quantify
mode inside a Docker5 container. The platform implements                     elements present in the text such as hashtags, handles, emojis
three key processes.                                                         and expanded URLs.

a) A set of preprocessing pipelines transform the input                      c) Engagement analysis is finally performed to quantify the
tweets in “cleaner” versions appropriate for two types of                    impact of each tweet using three metrics. The engagement
subsequent analysis: lexicon-based and aspect-based. The first               rate considers retweets and likes (i), or retweets, likes, replies
pipeline is used to support word look up based on three                      and quotes (ii), divided by the number of the followers of the
standard lexicons corresponding to a set of words converted                  tweet’s author multiplied by 100. The extended reach metric is
into their base form with Stanza [39]. To normalize the tweets,              based on the number of retweets divided by the total number
the tweet-preprocessor6 and gensim7 libraries are used to                    of tweets by the author, multiplied by 100. The user’s potential
remove stop words, handles, URLs, emojis, numbers, hashtags,                 impressions metric is based on the number of user’s followers
punctuation and non-unicode characters, and all text is                      multiplied by the total number of the user’s tweets count.

                                                                             The results from all the processes before they reach the
                                                                             database are stored in a separate Spark SQL9 DataFrame
                                                                             based on the relationship shown in Figure 2. The tweets
1 https://crate.io/
                                                                             DataFrame columns hold (i) the tweet’s text; (ii) its public
2 https://developer.twitter.com/en/docs/twitter-api/tweets/search/api-
 reference/get-tweets-search-all
3 https://github.com/twintproject/twint
4 https://spark.apache.org/
5 https://www.docker.com/
6 https://pypi.org/project/tweet-preprocessor/                               8   https://www.johnsnowlabs.com/spark-nlp/
7 https://radimrehurek.com/gensim/                                           9   https://spark.apache.org/sql/

                                                                         4
Analyzing and Visualizing Twitter Conversations                                  CASCON'21, November 22 - 26 2021, Toronto, Canada

metrics: retweet_count, reply_count, like_count, quote_count;           database thanks to the compatibility of both ends to
(iii) created_at timestamp; (iv) words and frequency of the             communicate through API calls.
lexicons look up, (v) aspects found and their sentiment score;
(vi) tweet’s sentiment; (vii) elements extracted and their              In both groups, the visualizations are rich in description and
count; (viii) influence metrics; and (ix) a reference id of the         more detailed information is available while interacting with
user’s table. The users DataFrame columns hold (i) the user’s           them in a web browser.
id; (ii) its public metrics: followers_count, following_count,
tweet_count, listed_count; (iii) verified boolean; (iv) bio and         3.4.1 Personal Values, Sentiment, and Humor
(v) screen_name.
                                                                        The first group of visualizations consist of a treemap, line and
                                                                        area, and a streamgraph chart. The purpose of the treemap is
                                                                        to visualize the volume of word frequency associated with a
                                                                        personal value based on different filtering options: (a)
                                                                        cumulative of all the dataset; (b) day, month, or year range
                                                                        comparison and (c) specific dates range comparison. For all
                                                                        filtering options there is a box per personal value with an
                                                                        assigned color. Inside each box are internal boxes that
                                                                        represent the words of each personal value. Depending on the
                                                                        box, there is a text label that denotes a personal value or a
                                                                        word, with the size of the box representing the volume of the
                                                                        frequency count. If any of the filtering options are selected, the
                                                                        background of each word box will become red or green. Green
                                                                        if the end date has a higher frequency for a word compared to
                                                                        the start date, and red otherwise. If there is no difference, the
                                                                        color will be that of the personal value.

                                                                        The line and area charts are meant to show cumulative
             Figure 2. User and Tweet Relationship                      frequency of words over time, per dictionary. In these charts
                                                                        the user can drag and select specific data points in time to
3.3 Data Storage                                                        zoom in or out, to see their distribution.
CrateDB is used to store the generated DataFrames of tweets             The streamgraph’s functionality is similar to the line and area
and users. It is a horizontally scalable time-series database for       charts with the difference being that it is easier to spot their
data consultation and time filtering. Some characteristics that         distribution.
make it a good fit are that it is schema-flexible, can hold
multiple columns, exposes a Representational State Transfer
                                                                        3.4.2    Aspects and Terms
(REST) API and a PostgreSQL wire protocol. The last two
make it compatible with a broad variety of external                     The second group of visualizations is composed of four
applications and use cases and since Spark can work with Java           different charts that focus on tweets that have aspects.
Database Connectivity (JDBC) drivers, the connection between            Aspects are defined here as the attributes, features,
Spark and CrateDB can be stablished in two ways, with the               components, or relevant considerations of energy sources and
PostgreSQL JDBC 10 driver or through a connection with                  the energy industry in Canada. The aspect list was created by
SQLAlchemy11 using Pandas12.                                            consulting Natural Resource Canada's Energy Factbook,
                                                                        industry experts' listing of keywords and projects, and
3.4 Data Visualization                                                  Wikipedia entries. Some of these aspects are specific to a few
                                                                        energy sources, while others are applicable to all sources.
Two groups of visualizations are available to contextualize (a)         Once we determined our list of aspects, we searched
the frequency of personal values, sentiment, and humor in               ConceptNet [46] for related terms to improve the recall of
tweets, and (b) the mention of terms associated with an                 tweets mentioning these aspects.
aspect and what combinations of them are popular in tweets.
They are all configured and built with ZingChart13, served              A pie chart shows the representative quantity of tweets with
through the web and can communicate directly with the                   and without aspects. It is possible for a tweet to have more
                                                                        than one aspect term, whether those terms are associated
                                                                        with the same aspect or originate from different aspects. For
                                                                        instance, a tweet may contain the terms “protect” and
10 https://jdbc.postgresql.org/
11 https://www.sqlalchemy.org/                                          “environmental”; “protect” is a term under the “safety” aspect,
12 https://pandas.pydata.org/                                           whereas “environmental” is a term under the “sustainability”
13 https://www.zingchart.com/
                                                                        aspect. If there is a tweet that has two terms from the same

                                                                    5
CASCON'21, November 22 - 26 2021, Toronto, Canada C. Gutierrez et al.
parent, such as “protect” and “security” from the “safety” 4.1 The Energy East Case Study
aspect, this would be considered a combination, that is to say,
a combination “protect, safety”. In the first use case we chose to explore what people had to
say about the energy east pipeline. The project was
A sunburst chart compares the number of tweets mentioning announced on August 1, 2013 and became heavily debated
terms tied to an aspect, where each slice corresponds to its among multiple groups on economic, political, environmental,
frequency. The inner ring represents all aspects and the outer and moral grounds. To be able to understand such
one represents all combinations of terms for each aspect. perspectives and conversations we mainly looked for personal
values and custom-defined aspects to look for sentiment, i.e.,
A treemap compares the number of tweets mentioning terms concepts that would let us understand how people were
associated with an aspect. It shows the sentiment of not only feeling, how they were expressing themselves online about it
each aspect, but also each combination of terms via the colour and how this evolved through time. In addition, we looked for
of the box. Colours include: (a) red for negative; (b) light red humor and sentiment words.
for slightly negative; (c) grey for neutral; (d) light green for
slightly positive; (e) green for positive. We distinguish We started with a Twitter query search based on the
between slightly positive or negative sentiments with “#energyeast” hashtag between the dates of March 21, 2006
VADER’s range. Sentiments for term combinations are to June 17, 2021. It gave us 28,693 tweets, 111,091 retweets,
calculated by finding the mean compound of each term. Each 3,753 quotes and 4,780 replies with a total of 148,317 tweets,
mean compound found is then used to determine the overall in the period from June 7, 2013 to June 16, 2021. After
mean compound of an aspect. The treemap can be filtered by applying our preprocessing functions, lexicon dictionaries
(a) allowing the user to show or hide individual aspects on the look up and engagement calculations, we filtered the resulting
treemap and (b) selecting “all” or “range” to explore how the data to consider only tweets, quotes and replies for further
frequency of tweets and term combinations have changed analysis.
over time.
Finally, a violin chart compares the distribution and density of
mean compounds which were used to calculate the sentiments
of aspects and combinations of terms. Each violin represents
an aspect while mean compounds are displayed on the y-axis.
This chart only displays all mean compounds found overall.
3.4.3 Tweets and Users Filtering Table
With FancyGrid14, we created a tweets and users’ table. These
tables have the same functionality with the only difference
being the data represented in each of them. The user is able to
(a) search the whole table and filter by keyword; (b)
show/hide columns; (c) export the table data to a CSV; (d)
filter per individual columns and in case of a numeric column,
use the operators: , =, != to compare and (e) see the
median, average, and standard deviation of engagement of the
tweets table. In these tables, tweets, users, and links can be
Figure 3. Line and Area, and Streamgraph Chart for
clicked. There is a page number filter and a selector to pick
Personal Values Dictionary
how many rows to show. As an extra metric, there is a legend
denoting the page number and the total number of records Using the line and area chart we were able to perceive three
available. activity spikes that happened on January 22, 2016, January 27,
2016, and October 5, 2017, the last one being the most
4 Case Studies distinctive, as Figure 3 depicts. This date would then be our
main point of focus for further analysis.
To understand the potential of the platform we have
conducted two different analyses. One that aims to We decided to pick the top three personal values identified:
understand conversations around a specific topic and another achievement, self-direction, and power. Based on this set of
one that focuses on the exploration of metrics around a brand. words, we decided to investigate further with the personal
values treemap as seen in Figure 4, filtered to only this
specific date. From this visualization we noticed the words:
job (achievement - 34 words); decision (self-direction - 50
words) and victory (power - 33 words).
14 https://fancygrid.com/
6Analyzing and Visualizing Twitter Conversations CASCON'21, November 22 - 26 2021, Toronto, Canada
One more analysis that we were able to perform was to get
how many users participated in the conversation. This was
achieved through the users table that looks like Figure 6. From
this table we were able to spot that a total of 977 tweets were
done in this same date: 695 tweets; 169 quotes and 113
replies. Where 629 unique users participated.
Figure 4. Personal Values Treemap
To further understand the context, we went back to the line
and area, and the streamgraph charts but now applied to the
sentiment dictionary as seen in Figure 5. This showed us that
there were more negative (53.2%) than positive (46.8%)
words. Figure 6. Tweets and Users Table
To examine the influence of the users’ tweets, we performed a
statistical analysis of the engagement rate that includes likes,
retweets, quotes, and replies from each individual tweet per
user. As a result, we obtained an average of 0.527, a median of
0.018 and a standard deviation of 14.637. As it can be noted,
the standard deviation looks sparse, the reason for this could
be because of irregularities between users, immensely high
retweets, replies, quotes, likes, followers, and followings per
individual tweet can significantly alter the cumulative
engagement.
To conclude, based on the results that we obtained from the
above visualizations, we were able to infer that this day was
an event that was fairly equilibrated between supporters and
opposers. People showed through their messages their
discontent about such event. The conversation revolved
around concepts related to employment, worthiness and what
was the best thing to do. By looking up online through
different news sources we were able to find out that on this
Figure 5. Line and Area, and Streamgraph Chart for the
Sentiment Dictionary day the Energy East pipeline was canceled by TransCanada.
More analysis granularity was achieved with the help of the The analysis of this dataset was done in a Linux PC with 16
sunburst and treemap charts for aspects. The results that we cores - 56GB of RAM and took approximately 2 minutes to
got from filtering both charts with the same date are shown in complete all the processing and make the data available
Figures 7 and 8. They showed us that the top 3 aspects found online.
from the conversations were about: employment (29.7% -
jobs with 32 tweets); cost (18.8% - worth with 6 tweets) and 4.2 The Academic Institution Case Study
safety (14.1% - safe and protect with 4 tweets). As it is
important to know detailed information about the aspects in a The second use case consisted of gathering the user’s timeline
specific date, it is also helpful to visualize distribution from of all the accounts that are officially associated with the
the overall data. We accomplished this with the pie and the University of Alberta (UofA), Canada. This was done through a
violin charts shown in Figure 9 and 10 respectively. For the client based on the Twint scraper, to scrape users’ timeline.
first one, out of 37,226 tweets (tweets, replies and quotes), The objective was to help the communications department to
only 4,793 tweets (12.9%) have aspect sentiments. Each tweet identify accounts that should be terminated, and provide them
within the group of 4,793 contains at least one aspect term. with data on which to base their decisions.
For the second one, it showed us that there is high variability
of aspects sentiment that refer to safety, sustainability, and We used our custom table for exploratory analysis to cover
employment. the following sections:
7CASCON'21, November 22 - 26 2021, Toronto, Canada C. Gutierrez et al.
Figure 7. Sunburst Chart for Frequency of Aspect Terms Figure 8. Treemap for Frequency of Aspect Sentiments
and Terms
Figure 9. Pie Chart of Tweets without Aspects vs Tweets Figure 10. Violin Chart for Distribution and Density of
with Aspects Sentiment Compounds per Aspect
Table 1. Top 10 Engaging Tweets’ Ids from the UofA
• Tweets: Accumulation of all the tweets from the official
university’s accounts.
• UofA accounts: Individual accounts from the university.
• Other accounts tweets: Accumulation of all the tweets
from the interested external accounts.
• Other accounts: Individual accounts external to the
university’s accounts.
The engagement rate indicates how much users are
interacting with the content; the extended reach metric
captures the rate of tweets distribution to reach its audience;
and the potential impressions metric captures how many
users the content could impact. For each tweets table a 5 Discussion and Conclusions
statistical analysis was performed based on the engagement of
Data visualizations are especially useful to illustrate complex
all the tweets. And for each accounts table the same metrics
conversations, across social media platforms, to multiple user
were calculated but in an individual way to see their
groups. To meet this challenge, we have developed a robust
distribution.
and scalable platform for the analysis of three semantic
aspects of tweets - personal values, sentiment, and humor
This case study differs from the previous one, where a hashtag
expressed in them – and the public’s engagement to measure
was the main study to calculate engagement. When it is about
influence. Lastly, we develop complementary visualizations to
a brand, all the tweets that are fetched are about the accounts
enable users to gain insights on these data. We demonstrate
of interest. In this case we obtained an average of 0.124, a
the usefulness of our platform with two case studies. Our
median of 0.007 and a standard deviation of 0.669. The
platform is scalable and allows handling higher workloads via
standard deviation is fairly sparse, and we notice that there is
scale out. Moreover, it is also extensible: it is implemented
a big variability since the median is small. The next step would
with clear APIs allowing the addition of new and more
be to filter by individual account and see their individual
sophisticated analysis.
engagement rate, compare it against the cumulative, and see if
it is just an outlier that needs to be terminated or requires
There is still potential for providing more details in the
more content to make it more popular. As an example, Table 1
aforementioned charts, as well as adding more visualizations.
shows the top 10 engaging tweets’ ids from the main UofA
This includes adding more aspects - as currently there are
account with their respective engagement rate, further
only nine -, more aspect terms and term combinations, and
analysis needs to be done to propose a strategy to increase
possibly using other visualizations like stream graphs that
new posts’ engagement.
8Analyzing and Visualizing Twitter Conversations CASCON'21, November 22 - 26 2021, Toronto, Canada
may be suitable for relationships like that of personal values, competitive analysis and text mining: A case study in the
sentiment, and humor. pizza industry. Int. J. Inf. Manage. 33, 3 (2013), 464–472.
[13] Steven Hitlin. 2003. Values as the core of personal identi-
ACKNOWLEDGMENTS ty: Drawing links between two theories of self. Social Psy-
We sincerely acknowledge funding from David Milia and the chology. Q. 66, 2 (2003), 118.
Canadian Energy and Climate Nexus, Mitacs, and AI4Society at [14] Matthew Honnibal, Ines Montani, Sofie Van Landeghem,
the University of Alberta, Canada. and Adriane Boyd. 2020. spaCy:Industrial-
strengthNaturalLanguageProcessinginPython.
REFERENCES https://doi.org/ 10.5281/zenodo.1212303
[15] Minqing Hu and Bing Liu. 2004. Mining and summarizing
[1] Alan S. Abrahams, Weiguo Fan, G. Alan Wang, Zhongju
customer reviews. Proceedings of the ACM SIGKDD Inter-
John Zhang, and Jian Jiao. 2015. An integrated text analyt-
national Conference on Knowledge Discovery and Data
ic framework for product defect discovery. Prod. Oper.
Mining (KDD-2004), Aug 22-25, Seattle, Washington, USA.
Manag. 24, 6 (2015), 975–990.
[16] C. Hutto and E. Gilbert. 2014. VADER: A Parsimonious
[2] Bouktaib Adil, Fennan Abdelhadi, Bahra Mohamed, and
Rule-Based Model for Sentiment Analysis of Social Media
Hmami Haytam. 2019. A spark based big data analytics
Text.
framework for competitive intelligence. In 2019 1st In-
ternational Conference on Smart Systems and Data Sci- [17] M. E. J. 2003. Newman The structure and function of
ence (ICSSD), IEEE, 1–6. complex networks. SIAM Rev 45, 2, (2003), 167–256.
[3] Santa Agreste, Pasquale De Meo, Emilio Ferrara, Sebas- [18] Richard W. Kilby. 1993. The study of human values. Uni-
tiano Piccolo, and Alessandro Provetti. 2015. Trust net- versity Press of America, Lanham, MD.
works: Topology, dynamics, and measurements. IEEE In- [19] C. Kluckhohn. 1951. Values and value-orientations in the
ternet Comput. 19, 6 (2015), 26–35. theory of action: an exploration in definition and classifi-
[4] Hager Ahmed, Eman M. G. Younis, Abdeltawab Hendawi, cation. In T. Parsons and E. Shils (eds.). Harvard Universi-
and Abdelmgeid A. Ali. 2020. Heart disease identification ty Press, Cambridge, MA, 388–433.
from patients’ social posts, machine learning solution on [20] Peter M. Landwehr, Wei Wei, Michael Kowalchuck, and
Spark. Future Gener. Comput. Syst. 111, (2020), 714–722. Kathleen M. Carley. 2016. Using tweets to support disas-
[5] Sultan M. Al-Daihani and Alan Abrahams. 2018. Analysis ter planning, warning and response. Saf. Sci. 90, (2016),
of academic libraries’ Facebook posts: Text and data ana- 33–47.
lyt-ics. J. Acad. Libr 44, 2, (2018), 216–225. [21] M. D. P. Lee and M. Lounsbury. 2015. Filtering institution-
[6] Ebtesam Alomari and Rashid Mehmood. 2018. Analysis of al logics: Community logic variation and differential re-
tweets in Arabic language for detection of road traffic sponses to the institutional complexity of toxic waste. Or-
conditions. In Lecture Notes of the Institute for Computer ganization Science 26, (2015), 847–866.
Sciences, Social Informatics and Telecommunications En- [22] L. M. Lefsrud, C. Westbury, J. Keith, and G. Hollis. 2015. A
gineering. Springer International Publishing, Cham, 98– Basis for Genuine Dialogue: Developing a Science-Based
110. Understanding of Public/Industry Communication.
[7] Ebtesam Alomari, Rashid Mehmood, and Iyad Katib. [23] Lianne M. Lefsrud and Renate E. Meyer. 2012. Science or
2019. Road traffic event detection using twitter data, science fiction? Professionals’ discursive construction of
machine learning, and Apache spark. In 2019 IEEE climate change. Organ. stud. 33, 11 (2012), 1477–1506.
SmartWorld, Ubiquitous Intelligence & Computing, [24] Lianne Lefsrud and Achim Oberg. 2019. Heated atmos-
Advanced & Trusted Computing, Scalable Computing & phere: Organizational emotions and field structuring in
Communications, Cloud & Big Data Computing, Internet online climate change debates. Acad. Manag. Proc. 2019, 1
of People and Smart City Innovation (2019), 12132.
(SmartWorld/SCALCOM/UIC/ATC/CBDCom/IOP/SCI), [25] Vittorio Lingiardi, Nicola Carone, Giovanni Semeraro, Ca-
IEEE. taldo Musto, Marilisa D’Amico, and Silvia Brena. 2020.
[8] Chester I. Barnard. 1938. Functions of the executive (30th Mapping Twitter hate speech towards social and sexual
ed.). Harvard University Press, London, England. minorities: a lexicon-based approach to semantic content
[9] Jurafsky Daniel and James H Martin. 2020. Dependency analysis. Behav. Inf. Technol. 39, 7 (2020), 711–721.
Parsing. InSpeech and Language Processing(3rd draft [26] Duncan McCaig, Sudeep Bhatia, Mark T. Elliott, Lukasz
ed.). Chapter 14. Walasek, and Caroline Meyer. 2019. Analysis of Twitter
[10] Mary Douglas. 1966. Purity and danger. Routledge, New messages using big data tools to evaluate and locate the
York. activity in the city of Valencia (Spain) Cities 86, (2019),
[11] Joel Gehman, Linda K. Treviño, and Raghu Garud. 2013. 37–50.
Values work: A process study of the emergence and per- [27] Duncan McCaig, Sudeep Bhatia, Mark T. Elliott, Lukasz
formance of organizational values practices. Acad. Man- Walasek, and Caroline Meyer. 2018. Text-mining as a
age. J 56, 1, (2013), 84–112. methodology to assess eating disorder-relevant factors:
[12] Wu He, Shenghua Zha, and Ling Li. 2013. Social media Comparing mentions of fitness tracking technology across
9CASCON'21, November 22 - 26 2021, Toronto, Canada C. Gutierrez et al.
online communities. Int. J. Eat. Disord. 51, 7 (2018), 647– [40] Milton Rokeach. 1973. The nature of human values. Free
655. Press, New York, NY.
[28] R. Mechler. 2016. Reviewing estimates of the economic [41] Androniki Sapountzi and Kostas E. Psannis. 2018. Social
ef-ficiency of disaster risk management: opportunities networking data analysis tools & challenges. Future
and limitations of using risk-based cost–benefit analysis. Gener. Comput. Syst. 86, (2018), 893–913.
Nat. Hazards (Dordr 81, 3, (2016), 2121–2147. [42] S. H. Schwartz. 1992. Universals in the content and struc-
[29] W. Medhat, A. Hassan, and H. Korashy. 2014. Sentiment ture of values. In M. P. Zanna (ed.). Academic, San Diego,
analysis algorithms and applications: A survey, Ain Shams 1–65.
Eng. J 5, 4, (2014), 1093–1113. [43] S. H. Schwartz. 1994. Are There Universal Aspects in the
[30] Cataldo Musto, Giovanni Semeraro, Pasquale Lops, and Structure and Contents of Human.
Marco de Gemmis. 2015. CrowdPulse: A framework for [44] S. H. Schwartz. 1999. A theory of cultural values and some
real-time semantic analysis of social streams. Inf. Syst. 54, implications for work. Applied Psychology 48, (1999),
(2015), 127–146. 23–47.
[31] Evgenii Nikitin. RedditScore. [45] P. Selznick. 1957. Leadership in administration: A socio-
https://github.com/crazyfrogspb/RedditScore logical interpretation. Harper & Row, New York.
[32] A. Oberg, L. M. Lefsrud, and R. A. Meyer. 2021. Organiza- [46] Robyn Speer, Joshua Chin, and Catherine Havasi. 2016.
tional (Issue) Field Perspective on Climate Change. Eco- ConceptNet 5.5: An open multilingual graph of general
nomic Sociology: The European Electronic Newsletter knowledge.
(2021). [47] Guilherme M. Thomaz, Alexandre A. Biz, Eduardo M. Bet-
[33] N. Panagiotou, I. Katakis, and D. 2016. Gunopulos Detect- toni, Luiz Mendes-Filho, and Dimitrios Buhalis. 2017.
ing events in online social networks: definitions, Trends Content mining framework in social media: A FIFA world
Chall. cup 2014 case analysis. Inf. manag. 54, 6 (2017), 786–
[34] Viktor Pekar, Naveed Afzal, and Bernd Bohnet. 2014. UB- 801.
ham: Lexical resources and dependency parsing for as- [48] Andrew H. Van Ven, Thomas J. Peters, and Robert H. Wa-
pect-based sentiment analysis. Strouds-burg, PA, USA. terman. 1983. In search of excellence: Lessons from
[35] Thomas J. Peters and Robert H. Waterman. 1982. In America’s best-run companies. Adm. Sci. Q 28, 4, (1983),
search of excellence. Harper & Row, New York. 621.
[36] Michal Podhoranyi and Lukas Vojacek. 2019. Social media [49] Nathan Walter, Michael J. Cody, Larry Zhiming Xu, and
data processing infrastructure by using Apache spark big Sheila T. Murphy. 2018. A priest, a rabbi, and a minister
data platform: Twitter data analysis. In Proceedings of walk into a bar: A meta-analysis of humor effects on per-
the 2019 4th International Conference on Cloud Compu- suasion. Hum. Commun. Res. 44, 4 (2018), 343–373.
ting and Internet of Things - CCIOT 2019, ACM Press, New [50] Max Weber. 1905/2002. The protestant ethic and the
York, New York, USA. spirit of capitalism with other writings on the rise of the
[37] Vladimir Ponizovskiy, Murat Ardag, Lusine Grigoryan, west (4th ed.). Penguin, New York.
Ryan Boyd, Henrik Dobewall, and Peter Holtz. 2020. De- [51] Chris Westbury and Geoff Hollis. 2019. Wriggly, squiffy,
velopment and validation of the Personal Values Diction- lummox, and boobs: What makes some words funny? J.
ary: A theory–driven tool for investigating references to Exp. Psychol. Gen. 148, 1 (2019), 97–123.
basic human values in text. Eur. J. Pers 34, 5, (2020), 885– [52] Yuanbin Wu, Qi Zhang, Xuanjing Huang, and Lide Wu.
902. 2009. Phrase dependency parsing for opinion mining. In
[38] Anuja Prakash Jain and Padma Dandannavar. 2016. Text Proceedings of the 2009 Conference on Empirical Meth-
analytics framework using Apache spark and combina- ods in Natural Language Processing Volume 3 - EMNLP
tion of lexical and machine learning techniques. J. Appl. ’09, Association for Computational Linguistics, Morris-
Inf. Sci. 4, 1 (2016), 31–36. town, NJ, USA.
[39] Peng Qi, Yuhao Zhang, Yuhui Zhang, Jason Bolton, and
Christopher D. Manning. 2020. Stanza: A python natural
language processing toolkit for many human languages.
In Proceedings of the 58th Annual Meeting of the Associa-
tion for Computational Linguistics: System Demonstra-
tions, Association for Computational Linguistics, Strouds-
burg, PA, USA.
10You can also read


