Ancillaries Available - Ruben Ugarte
←
→
Page content transcription
If your browser does not render page correctly, please read the page content below
Ancillaries Available
The Data Mirage


The Data Mirage
Why Companies Fail to Actually
Use Their Data

Ruben Ugarte
The Data Mirage: Why Companies Fail to Actually Use Their Data

Copyright © Business Expert Press, LLC, 2021.

Cover design by Alison Davis

Interior design by Exeter Premedia Services Private Ltd., Chennai, India

All rights reserved. No part of this publication may be reproduced,
stored in a retrieval system, or transmitted in any form or by any
means—electronic, mechanical, photocopy, recording, or any other
except for brief quotations, not to exceed 400 words, without the prior
permission of the publisher.

First published in 2021 by
Business Expert Press, LLC
222 East 46th Street, New York, NY 10017
www.businessexpertpress.com

ISBN-13: 978-1-95334-952-1 (paperback)
ISBN-13: 978-1-95334-953-8 (e-book)

Business Expert Press Big Data, Business Analytics, and
Smart Technology Collection

Collection ISSN: 2333-6749 (print)
Collection ISSN: 2333-6757 (electronic)

First edition: 2021

10 9 8 7 6 5 4 3 2 1
To my parents, who have supported most of my crazy
 ideas including running my own business and being
     an entrepreneur. Thank you and I love you.
Description
The Data Mirage: Why Companies Fail to Actually Use Their Data is a
business book for executives and leaders who want to unlock more
insights from their data and make better decisions.
The importance of data doesn’t need an introduction or a fancy pitch
deck. Data plays a critical role in helping companies to better understand
their users, beat out their competitors, and breakthrough their growth
targets.
However, despite significant investments in their data, most
organizations struggle to get much value from it. According to Forrester,
only 38% of senior executives and decision-makers “have a high level of
confidence in their customer insights and only 33% trust the analytics
they generate from their business operations.”
This reflects the real world that I have experienced. In this book, I will
help readers formulate an analytics strategy that works in the real world,
show them how to think about KPIs and help them tackle the problems
they are bound to come across as they try to use data to make better
decisions.
Keywords
analytics; marketing strategy; growth hacking; data; KPI; dashboards;
data science; SaaS; e-commerce; mobile games; marketing attributionContents
Acknowledgements .................................................................................xi
Introduction ........................................................................................xiii
Chapter 1 The Reality of Being Data Driven and
Why Your Company Isn’t .................................................1
Chapter 2 Designing Data Strategies for the Real World .................15
Chapter 3 How to Avoid Drowning in Tool Hell and
Safeguarding Your Data ..................................................29
Chapter 4 Driving Successful Implementations, on
Budget and on Time .......................................................57
Chapter 5 Creating Reports That People
Actually Understand .......................................................73
Chapter 6 The Last Mile: Training ..................................................87
Chapter 7 Your Biggest Challenge: Actually
Using the Data ...............................................................93
Chapter 8 Analyzing Your Data and Workflows ............................103
Chapter 9 Building Experiments and Making
Better Decisions ...........................................................117
Chapter 10 Beyond the Basics: Machine Learning,
AI, and the Future ........................................................135
About the Author ................................................................................145
Index .................................................................................................147Acknowledgements
Writing this book has been an exciting journey that couldn’t have
happened without many people’s support. I want to thank my parents
and sister for their continued encouragement to be a better person.
I also want to thank Alan Weiss and Noah Fleming, who helped
shaped many of the ideas that made it into this book. I also want to thank
the clients, colleagues, and partners who have been part of my practice
over the last 5 years.
I also want to thank Scott, Charlene, and the rest of the BEP team for
making the production of this book extremely easy. A special thanks to
Exeter team for working with me through multiple iterations and fixes.
Finally, I want to thank Brian Yan Muk, Troy Liew, Tim Parkin, John
Chan, and many other friends who provided feedback on the book cover,
ideas, and overall structure. Apologies if I missed anyone and thank you
for your support!Introduction
The idea to write this book was in the back of my mind for four years.
I kept seeing companies face the same challenges over and over again.
These companies weren’t able to find much information online or in
books. Most of the content was focused on technical topics like choosing
tools or how to design visually appealing reports.
The human element of data was surprisingly missing. After all, all
this data that companies are drowning in is to be used by people. So why
wasn’t there more on how people use data or the challenges they face?
My goal in this book is to help answer these questions.
You might assume that as a Data Strategist, I think data is the answer
to every question. It might surprise you to know that I think companies
are relying too much on data. I understand the power of it but I also
respect its limitations. My work with clients has to be rooted in reality
and not in a hypothetical world.
One of the first questions that I share with clients is what game are
they playing? I want them to understand that there are different ways of
approaching data and no single approach is the “best.” Every company
has a unique makeup of skills and preferences (what we might call culture)
and data needs to be fit into this mold.
The most well-known data game is played by companies like Facebook
and Google. They collect vast amounts of data which they then use
to build better products. Better in this case means higher engagement
from their users (you and me). Their approach to data is sophisticated,
complex, and effective.
This is one game you could play. For these companies, data is their
product and they monetize it through advertising. Everything else they
do is meant to support this. Facebook has a social networking tool,
Whatsapp, Instagram, and Messenger, which could be seen as “products”
but they are all just ways in which Facebook collects data.
Google is the same. They offer free products like Gmail, Google Maps,
Android, and Google Home. However, these products are just a way for
them to collect data. If you don’t believe me, let’s look at recent quarterlyxiv INTRODUCTION
results for these companies. Advertising was 98 percent1 of Facebook’s
revenue and 83 percent2 of Google’s revenue in 2019.
Unless you’re building a similar business to Google and Facebook, this
game might not be a good fit. This means that you don’t need to make
data the most important thing in your company. You don’t need to be
“data-driven” and have data guide your every decision. Instead, you could
explore other games.
I believe most companies will benefit from a “data-supported culture.”
This means that data plays an important role in helping you make better
decisions but there’s also room for opinions and gut feelings. If you don’t
have the data on a certain question, you can still make a decision. You
aren’t paralyzed by the lack of evidence.
This last point is important because I have seen companies delay
decisions until “all the data is in.” I understand prudence but there are
also limitations to this approach. Instead, companies should focus on
building a data strategy that helps them achieve their goals while
balancing the reality of internal capabilities.
In this book, I will take you through the entire lifecycle of a data
strategy. We’ll define the ideal future, get people onboard, choose the right
technology, implement it, provide training, and mine the data for insights.
I’ll show you best practices along the way that I have learned from working
with over 75+ companies across multiple industries and 5 continents.
The principles are quite similar regardless of what your company offers.
Finally, I will help you increase the confidence in your data and the
decisions that you’re making. At the end of the day, I’m here (and clients
hire me) to help them grow their businesses.
Let’s start our journey.
Ruben Ugarte,
Vancouver, Canada
June 2020
1
https://investor.fb.com/investor-news/press-release-details/2020/Facebook-
Reports-First-Quarter-2020-Results/default.aspx
2
https://forbes.com/sites/greatspeculations/2020/05/18/10-billion-googles-
lost-advertising-revenues-due-to-the-covid-19-outbreak/#54bf0fba6f46CHAPTER 1
The Reality of Being Data
Driven and Why Your
Company Isn’t
The only way to make sense out of change is to plunge into it, move
with it, and join the dance.
—Alan Wilson Watts
There were dashboards everywhere,1 monitoring activity across the net-
work and showing the latest news from CNN, MSNBC, and Fox News.
If anything unusual happened, you would instantly see it on one of the
monitors. The company could then respond right away and prevent any
serious consequences.
This was the “War Room” that Facebook had set up to monitor the
U.S. midterm elections in 2018. The company has built special dash-
boards to monitor fake news, bots trying to spread misinformation, and
nefarious actors.
This might seem over the top for Facebook but the company has been
under ever-increasing pressure for its role in the 2016 U.S. presidential
election. It had become public that foreign organizations were able to use
Facebook to influence the outcome of that election. The “War Room” was
a response to all of this but it is unclear if it will be enough.
Facebook is an extreme example of a company that uses data to make
decisions. The company uses this data to show you exactly what you care
about when you browse your newsfeed and hopes that you stick around
for longer than necessary. Their data-driven decisions work. In 2019,
1
“Inside Facebook’s Election ‘War Room’.” Technology News, The New York Times,
https://nytimes.com/2018/09/19/technology/facebook-election-war-room.html
(accessed September 19, 2018).2 THE DATA MIRAGE
1.62 billion people used one of its products on a daily basis2 including
Whatsapp, Instagram, or Messenger.
While most companies will never reach the level Facebook has, it does
show the potential impact that data can have on any organization. This
book is your guide to getting more value out of your data.
You don’t need to go to the same level Facebook has. For them, data is
their business. Everything else is mostly there to support the collection of
data. For other businesses, data is meant to support your core value which
could be products or services.
In this book, we’ll look at everything you need to do to get data right.
Let’s start our journey at the beginning, by providing context.
Let’s Start at the Beginning
Every great story has a beginning and, for companies that are striving to
be data driven, the beginning can feel like a failure. Every single one of my
clients tells me that that they would like to go from nothing to advanced
as quickly as possible. They want to skip the beginning and jump to the
end of the story.
They assume (rightly so) that they aren’t limited by technology.
We have advanced computers that fit into our pants and self-driv-
ing cars. I’m sure we can figure out how our customers engage with
our products. The latter seems simplistic in comparison to other
technologies.
The mistake is to assume that we are talking about technical prob-
lems. In this book, we’ll talk about tools, machine learning models, and
other technical ideas but I don’t think they are the main issues that com-
panies need to solve.
Instead, my experience over the past five years tells me that the biggest
challenges are related to people and psychology. These issues manifest
when your team tells you that they don’t trust the data or when they out-
right reject a number because “it can’t be right.”
2
“We Just Shared our Community Update.” Facebook Post, Facebook, https://
facebook.com/zuck/posts/10107243286682221 (accessed on April 24, 2019).THE REALITY OF BEING DATA DRIVENAND WHY YOUR COMPANY ISN’T 3
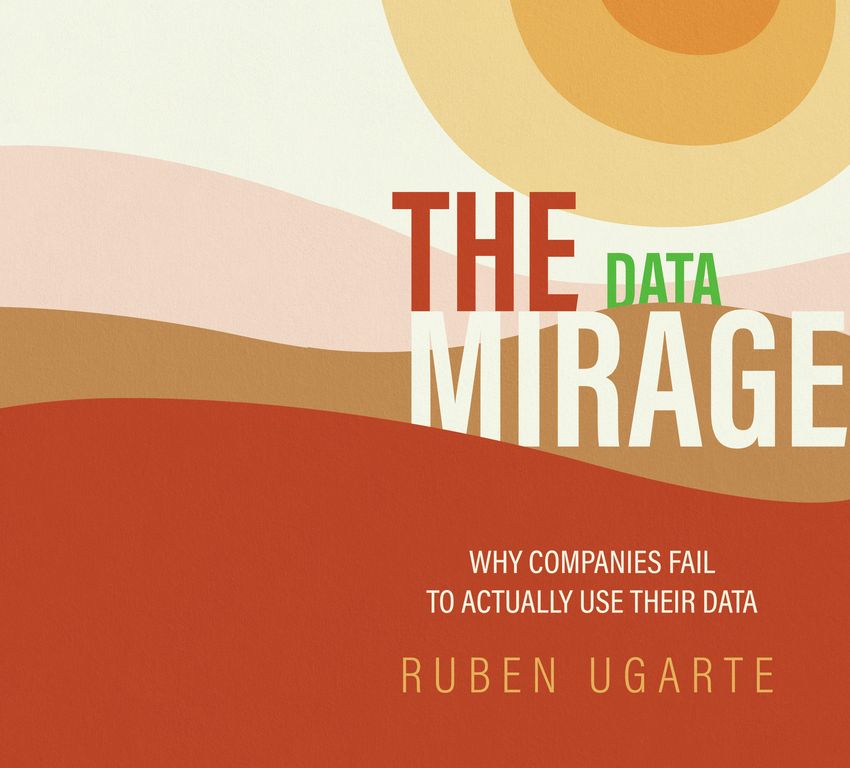
Data driven culture
Actionable insights
Reporting
Implementation
Strategy 3Ps
Figure 1.1 Data Adoption Lifecycle (DAL)
A mentor once told me that we should always look for “cause, not
blame.”3 Blaming people isn’t the solution. Instead, we need to diagnose
why this lack of trust exists or why it seems that some teams are unable to
actually use the data they have.
This is the journey that we will take in this book. I’ll give you the best
tools for your product or industry, show how advanced techniques like
machine learning can help your business, and demystify data science into
practical applications. This is what companies want when they reach out
to me but it isn’t always what they need.
Diagnosing this gap between want and need is sometimes tricky. To
help prospects understand it, I use a simple model that I call the “Data
Adoption Lifecycle (DAL)” (Figure 1.1).
Everything starts with the strategy which we will cover in Chapter 2.
Once we have a plan that makes sense, we can move on to the implemen-
tation which we will cover in Chapters 3 and 4. After collecting data, we
can go through a reporting phase which we will cover in Chapter 5.
This is where things start to get interesting. Once a company has
some reports, we need to work through all the issues to extract actionable
insights. We will cover all of these in Chapters 6 to 9.
3
“Debate Lesson.” Blog Post, Alan Weiss, https://alanweiss.com/debate-lesson/
(accessed on August 1, 2019).4 THE DATA MIRAGE
Finally, we can work on establishing a data-driven culture that isn’t
just words on a wall. We will cover this in Chapter 10.
The great thing about the DAL model is that it allows companies to
be in-between stages. You may have an ok strategy but a great implemen-
tation or solid reporting but limited insights. This represents a reality
where most companies are doing fine in some areas and could do better
in others.
In this book, my goal is to help you get better at every stage while
still focusing on driving meaningful changes in your business. That being
said, we will need to walk before running and in some cases, we’ll have
to crawl.
Walk before You Run (or Crawl)
We live in a culture of instant gratification that has changed how we think
about the world. This isn’t just something that is happening to teenagers
but everyone has had their expectations warped.
Let me give you an example from my life. I live in Vancouver, Canada,
where until recently (early 2020), we didn’t have Uber or Lyft. To catch
a cab, you either had to hail one from the street or call for one. The first
option is not something I’m personally familiar with and feels inefficient.
The second option could easily take upwards of 30 minutes before a taxi
arrived at your house.
Fast forward to today, we now have a third option: book an Uber
or Lyft. The first few times were great but when the novelty wore off, I
noticed that I would get frustrated if I had to wait more than five minutes
for the Uber/Lyft. My expectations on how quickly taxis should arrive
changed within days of the arrival of Uber and Lyft.
This is why I understand when executives feel frustrated with their
lack of data and lack of progress in this area. Why can’t we just solve this
problem and move on?
Unfortunately, moving groups of people in a specific direction takes
time. Getting people on board, shifting priorities, and making technical
changes are all time consuming. Data also suffers from a fourth limitation
which is the time it takes to actually collect it.THE REALITY OF BEING DATA DRIVENAND WHY YOUR COMPANY ISN’T 5
Most of my clients have tried to get to the future but are making little
progress. You may be running fast but if you’re doing that on a treadmill,
you won’t go anywhere. This is where the DAL comes in handy. It gives
us a simple map to understand what we need to tackle next and what we
can worry about later.
We also need to think about rebuilding the trust in data and its pur-
pose. I find that some of my clients have burned bridges trying to get data
strategies implemented. A common example is engineering teams who
have been asked repeatedly to implement tools just to see those efforts go
to waste. They eventually become skeptical of any data initiatives and this
is something that needs to be worked through.
That being said, companies can make great progress in 30 days or less
especially if you’re organized and tackle things in the right order. Before
you ever ask any of your engineers to write code, you’ll have a solid plan
that has been thought out and tested for weaknesses. That is our goal in
this book and one that we can work together on.
Case Studies of Successful Data-Driven Organizations
To understand where we are going, we need to look at those who are
already there. I want to walk you through three case studies of how com-
panies have used to drive growth within their business.
Even though these businesses might have significantly more resources
than you, remember that technical limitations are rarely the main issue
and instead they have to deal with the human problems at a larger scale
than yourself.
One of my favorite companies is Spotify, the music app service. I use
their product every day; I’m a paying user and a huge proponent of it.
They also happen to have one of the best data programs in the industry.4
One of the key aspects of the product is their curated playlists which Spo-
4
“The Amazing Ways Spotify Uses Big Data, AI And Machine Learning To Drive
Business Success.” Technology News, Forbes, https://forbes.com/sites/bernard-
marr/2017/10/30/the-amazing-ways-spotify-uses-big-data-ai-and-machine-lear-
ning-to-drive-business-success/#5a0844994bd2 (accessed on October 30, 2017).6 THE DATA MIRAGE
tify generates automatically based on popular songs. You have playlists of
the most popular Beatles songs, relevant workout songs, and songs to put
you to sleep.
Spotify uses its usage data to show every user relevant new playlists
that were built to their tastes. They also release this data to artists so they
can see what users are listening to and how they are discovering their
music. They also have their own internal framework for how to use data
to make better decisions which they call DIBB (Data-Insight-Belief-Bet).5
We’ll be talking more about these kinds of frameworks in Chapter 7.
Another great case study is Airbnb, the marketplace for finding and
booking rooms. They have used data extensively to improve the booking
process, making it easier for hosts to accept bookings and even in how
they built their data science team to be gender balanced.6
They have also contributed quite a few projects to the open source
world including Apache Superset, Omniduct, and Aersolve. Their data
teams share their learnings on a regular basis and they have found practical
ways of using machine learning to make the experience better for their
users.
Data isn’t just something for multibillion dollar companies like
Spotify and Airbnb. Companies of all sizes can take advantage of the
changes in technology and find the insights they need to grow. One of my
clients, Paymark, is an example of how smaller companies can use data as
a competitive advantage.
Paymark is a New Zealand-based payments provider. They are able
to use data to improve their product suite such as their Insights product
which provides metrics and statistics to their merchants. Based on product
data, the Paymark launched a redesign of their product which simplified
the overall experience for their customers.
Paymark is also able to use data to provide context to real-world situations.
After the Covid-19 virus started spreading to New Zealand, they were able
5
“Spotify Rhythm—how we get aligned (slides from my talk at Agile Sverige).”
Blog Post, Crisp, https://blog.crisp.se/2016/06/08/henrikkniberg/spotify-rhythm
(accessed on June 8, 2016).
6
“How Airbnb Uses Data Science to Improve Their Product and Marketing.”
Blog Post, Neil Patel, https://neilpatel.com/blog/how-airbnb-uses-data-science/
(accessed on January 23, 2020).THE REALITY OF BEING DATA DRIVENAND WHY YOUR COMPANY ISN’T 7
Aligned
strategy
Trained
people
Effective
tools
Data-starved Data-driven
companies companies
Find actionable
insights
Data
culture
Figure 1.2 Data Proficiency Level (DPL) from Data Starved to
Data Driven
to show how the virus was affecting spending patterns across the country.7
Download more successful case studies by visiting datamiragebook.com.
Let’s now look at where your company ranks when it comes to data.
I created a short assessment called DPL (Data Proficiency Level) to help
companies understand their strengths and weaknesses. Companies are
usually strong in a few areas and could use some help in others. Figure 1.2
shows what DPL looks like.
You want to rank your company (or team) on a scale of 1 to 10 across
the following categories:
Aligned Strategy: Is your team and people on the same page
when it comes to your strategy?
Trained People: Are the people in your team fully trained on
your data, tools, and processes?
Effective Tools: How effective are your current technology
choices?
7
“Virus spreads to spending patterns.” Press Release, Paymark, https://img.scoop.
co.nz/media/pdfs/2003/Paymark__Monthly_Release_Mar20_FINAL_1.docx
(accessed on March 3, 2020).8 THE DATA MIRAGE
Find Actionable Insights: How long does it take to find
insights and build reports with your data?
Data Culture: Does your company use data on a regular basis?
It doesn’t matter where your company is right now when it comes to data.
I’ll help you close the gap and tackle the biggest challenges that you are
facing and will come across as your company grows.
Hiring Unicorn Talent
We can’t begin to talk about strategy without understanding the role
people will play in that plan. Whether you call them A-players, unicorn
talent, or something else, adding the right people to the bus is important
and one of the biggest concerns for my clients.
As a side note, I’m fascinated by how the word “unicorn” has become
commonplace in our world. Unicorns are supposed to be something that
kids think about; instead, I hear it used all the time in boardrooms.
Clients are trying to find and hire the best “unicorn” talent. These
are typically people who have a strong grasp of business (marketing,
sales, etc.) but are also technically trained so they are able to code or
read code.
As you can imagine, these people aren’t common. People tend to nat-
urally organize themselves around interests, and business and engineering
aren’t a natural overlap. The education system also hasn’t historically been
designed to nurture these two different skill sets. While this is changing
rapidly, companies are still stuck trying to operate in an ever-increasing
technical world.
For my clients, I help them tackle this in two ways: externally and
internally. Externally is what most companies think about when they
think about hiring: creating job descriptions, interviewing folks, and
onboarding them. This could be an entire book on its own. I’ll talk about
the roles of people you could hire in the next chapter.
In this chapter, I want to focus on the internal option. I constantly
find myself working alongside incredibly smart and driven people but
they feel like they can’t do certain things with data because they aren’tTHE REALITY OF BEING DATA DRIVENAND WHY YOUR COMPANY ISN’T 9
“technical enough.” What they don’t realize is that they don’t need a CS
degree to get more value out of their data.
They simply need to learn a handful of skills that will be immediately
relevant to their day-to-day work. The process of teaching these skills will
be covered in Chapter 6 but here are the primary skills that every data-
driven individual needs.
Basic HTML/CSS/Javascript
The first skill that every data-driven individual needs is a basic under-
standing of the technologies that underlie digital products. These would
include HTML, CSS, and Javascript at a minimum.
This doesn’t mean that these persons could work as full-time engineer
but they understand how products are built at basic level and could write
simple lines of code or understand code that is given to them.
This is the biggest skill gap that my clients are seeing within their
teams and is a growing concern as most of the work we all do is heavily
intertwined by technology. As Andreessen Horowitz, a well-known ven-
ture capitalist, said back in 2011, “software is eating the world.”8
Human Behavior
The next skill that individuals should have is a keen understanding of
human behavior. Data points can tell you a story but this story will only
make sense if you understand how humans typically behave.
Let’s take the chart in Figure 1.3 as an example of predictable user
behavior.
We can see consistent drops in the chart which happen to correspond
to Saturday and Sunday. Based on this report and an understanding of how
humans worked, we could deduct that this product is primarily used during
work days. If this is true, that will color any other analysis that we do because
we can imagine typical persons and how they spend their work days.
8
“Why Software Is Eating the World.” Blog Post, A16Z, https://a16z.com/
2011/08/20/why-software-is-eating-the-world/ (accessed August 20, 2011).10
300k
150k
100k
Uniques
THE DATA MIRAGE
50k
0
Feb 10 Feb 12 Feb 14 Feb 16 Feb 18 Feb 20 Feb 22 Feb 24 Feb 26 Feb 28 Mar 1 Mar 3 Mar 5 Mar 7 Mar 9 Mar 11
All users
Figure 1.3 Anonymous data from a client using a tool called Amplitude91
9
“Amplitude | Product Analytics for Web and Mobile.” Homepage, Amplitude, https://amplitude.com/ (accessed on May 7, 2020).THE REALITY OF BEING DATA DRIVENAND WHY YOUR COMPANY ISN’T 11
Statistics
Next, we have statistics. This can be a dreaded topic as people get trans-
ported back to university where they spent countless hours learning what
seemed like useless techniques.
From a business perspective, we don’t need complex statistics most of
the time. Instead, we need basic skills that will affect nearly any analysis
that we do such as:
How to properly visualize and group data
How to average, max, and min a data
Understand statistical significance when running experiments
Measure the spread of the data and find outliers
If you’re a full-time data analyst or data scientist, you will need to go
beyond the basics and we will cover more advanced requirements in
Chapter 10.
Probabilities
Another skill that all individuals should understand is the use of probabil-
ities. This skill wasn’t on my radar for a few years but it has become more
important as time goes on. This skill matters because every day we are
making bets on what is likely to work and most people aren’t calculating
the correct probabilities.
Ray Dalio, founder of Bridgewater Associates, talks about determin-
ing the expected value of any decision (or bet in our context) in his book
Principles.109Let’s imagine that you’re deciding between two potential
experiments which require similar efforts. Experiment 1 has a 50 percent
probability of succeeding and a potential impact of $10,000 annually.
Experiment 2 has a 20 percent probability of succeeding but a potential
impact of $50,000 annually.
10
“Make your decisions as expected value calculations.” Linkedin Post, Ray
Dalio, https://linkedin.com/pulse/make-your-decisions-expected-value-calculations-
ray-dalio/ (accessed on October 31, 2018).12 THE DATA MIRAGE
The expected value of experiment 1 is $5,000 ($10,000 × 50 percent)
and experiment 2 has an expected value of $10,000 ($50,000 × 20 percent).
Based on these numbers, it would make more sense to run experiment 2 as
it has a higher expected value even though the probability of success is lower.
The skill of probability involves understanding these kinds of com-
parisons and also being able to quickly run the numbers on any set of
decisions or experiments that your team is considering.
Storytelling
The final skill that all individuals should learn is the ability to tell stories.
Data points and charts on their own tend to be boring. It’s the story
behind them that makes them interesting. If we go back to the chart
under the human behavior section, it was the story of how people are
using this product during work days that made it interesting. We could
expand on this by explaining how users feel when they use the product or
why their usage is so predictable.
Humans are wired for stories, and being able to tell a coherent story
with your data is a critical skill. If you have ever been stuck in a boring
meeting where someone is sharing numbers and the torture seems to go
on forever, it was likely due to the lack of stories. We don’t care about
numbers despite how “good” they might be. We care about the human
story behind them.
As you can imagine, finding individuals that have all these skills will
be extremely rare but that’s not the point. Instead, you can focus on teach-
ing these skills through training and coaching. This is the approach that
my clients have used with great success and without having to go to the
end of the earth to find the “perfect” employee.
Do Job Titles Matter?
Since we are talking about hiring people, we also need to briefly touch
upon job titles. It seems that job titles are always changing in our industry
and I constantly find myself confused as to what someone actually does.
We don’t just have marketers but we have growth marketers or growth
hackers or growth ninjas. As a side note, I have no idea how “ninja”
became a potential job title.THE REALITY OF BEING DATA DRIVENAND WHY YOUR COMPANY ISN’T 13
That being said, how much do titles matter? Do you need the latest
version or should you stick with more traditional values? The answer: it
depends.
Based on my experience, having modern titles tends to attract the
right candidates especially if you’re hiring for something that is relatively
new. Marketers with a more technical background and with experience
working with digital products will likely know what “growth marketer” or
“demand generation specialist” means.
The caveat is that you will need to gauge how your local market thinks
about titles. I find that my clients in San Francisco can be quite specific with
their titles because everyone is up to date with how roles and departments
are changing. My clients in other cities and countries might not be aware
of these trends yet and you’ll simply end up repelling potential candidates.
Conclusion
This chapter is the pre-takeoff announcement that you hear on any flight.
I need us to calibrate expectations, show you why companies struggle to be
data driven, and give you a glimpse into what the best companies are doing.
We also briefly talked about people and the skills that you need to
look for in your team. While we won’t cover how to hire in this book, we
will talk about how to use training and coaching to nurture the internal
unicorn talent that your organization already has.
That being said, we can move on and start designing a strategy that
can survive contact with the real world. We’ll talk about getting the right
people onboard, choosing KPIs and much more.
Chapter Summary
Technology is rarely the limited factor for companies who
want to use data but people and psychology are.
You can use DAL to determine in what areas your company
performs well and what areas need help.
Trust in data is important and something that needs to be
repaired and maintained.
You can hire externally or internally for “unicorn” talent but
focus on the right skills.Index
A/B testing, 125–126, 130 Conservative adoption, 68
Accuracy, 70 Consistent, 66
Aggressive adoption, 68 Conversion data, 41
Airbnb, 6 Copy, 126
Algorithms, 137 Correlation, 85, 127–133
Aligned strategy, 7 Cost, 68
Amazon, 140 data, 41
Amplitude, 10 reduction, 140–141
Analytics CRM, 44
descriptive, 70 Customer
maturity, 70–71 acquisition, 107–108
prescriptive, 70–71 retention, 108–109
stack, 50 satisfaction, 47
Anchoring bias, 98 success performance, 111–112
Apple, 33
Area charts, 77–78 Dashboards, 1, 20, 21, 40, 42, 48, 71,
Artificial intelligence (AI), 138 74, 76, 90, 91, 101, 103, 105,
Assumption Scoring, 51–53, 68 113, 118
Attribution, 31–33 Data
mobile app, 33, 35 adoption, 91, 93–95
models, 35–36 analysts, 20, 41
offline, 35 architect, 20
web, 33, 34 culture, 8
Audience, format for, 80–81 engineer, 20
Automated machine learning, 136 engineering, 138
Automation, 40 foundation, 53–54
Averages, 84 ingestion, 41–42
portability, 54
Bar charts, 78, 79 privacy, 54–55
Business questions, 30–31
analyst, 21 schema, 63–67
strategy, 18, 100 scientist, 20
Business intelligence (BI), 138 Data Adoption Lifecycle
(DAL), 3–5
Causation, 85, 127–133 Data analysis, 86, 103–106, 138
Choices, 49–51 customer acquisition, 107–108
Clustering illusion, 98 customer retention, 108–109
Cohort analysis, 37–38 customer success performance,
Communication, 39–40 111–112
Compliance teams, 60 machine learning and AI, 113–114
Confirmation bias, 85, 98 process performance, 110–111
Congruence bias, 98 qualitative, 112–113148 INDEX
Data-Insight-Belief-Bet (DIBB), 6, 124 Fraud, 46
Data Proficiency Level (DPL), 7 Fraud detection, 139–140
Data science, 135, 137–139 Funky data, 95–99
cost reduction, 140–141 Funnels, 37
fraud detection, 139–140 Further analysis, 130
fundamentals, 136–137
innovation, 141 GDPR, 55
recommendations, 140 Group training, 89
right data, 142 Growth hacking, 12
right people, 142–143
right projects, 143 HTML/CSS/Javascript, 9
Data strategy, 15 Human behavior, 9
challenges, 26–27 Human design, 83–85
KPIs, 23–26
people, 16–20 Idea capture, 120–121
process, 17, 21–22 Implementation, 57–58
providers, 17, 22–23 data schema, 63–67
roles, 20–21 measuring success, 70–71
Data-supported culture, 137 ownership, 62–63
Decision-making, 49, 117 team onboard, 58–62
ability, 18 Individual training, 89
A/B testing, 125–126 Innovation, 141
copy, 126 Insights, 118–120
correlation and causation, 127–133
and experiments, 120–125 Job title, 12–13
feature adoption, 126
insights and WDIM, 118–120 Knowledge and wisdom, 91
machine learning, 126–127 KPI, 22–26, 48, 80
Deep learning, 138
Documentation, 89 Lack of interest, 27
Lagging indicators, 23–24
E-commerce, 32, 37 Last Touch model, 36
Effective tools, 7 Leading indicators, 23–24
Engineering teams, 59 Learning, 123–125
Errors, 46–47 Legal teams, 60
Event properties, 64
Events, 64 Machine learning, 114, 126–127,
Event segmentation, 39 136, 137, 139
Experiment design, 121–122 Machine learning engineer, 20
Extract, Transform, Load (ETL), 42, Management teams, 48–49, 62
43 Marketing attribution, 31, 32
Marketing campaigns, 25, 31, 37, 50,
Failure work, 61 83, 95, 104–108, 117, 119,
Feature adoption, 126 128, 141
Feedback mechanism, 75 Marketing teams, 61
Financial ratios and metrics, 45 Marriage Counselor, 99–100
Find actionable insights, 8 Measurement, 122
First Touch model, 36 Measuring Team Skills (MTS), 17–18, 88INDEX 149
Minimal Detectable Effect (MDE), Right data, 142
122 Right people, 142–143
Mobile app attribution, 33, 35 Right projects, 143
Mobile games, 29, 87 ROI, 84
Multichannel attribution model, 141
Sales processes, 43–45
Naming convention, 66 Sales teams, 61
Net Promoter Score (NPS), 113 Segment.com, 41, 43, 55, 67
Small Data, 74–75
Offline attribution, 35 Software companies, 51
Overconfidence effect, 99 Software product, 64–65
Ownership, 62–63 Spotify, 5–6, 124, 125
Stacks, 50
People skills, 100 Statistics, 11
People strategy, 16–20 skills, 100
Pie charts, 78, 79 StitchFix, 140
Prescriptive Analytics, 70–71 Storytelling, 12
Pricing, 68–69 Success, measuring, 70–71
Prioritization, 121 Systematic problem solving, 100
Privacy, 41–42
Probabilities, 11–12 Team onboard, 58–62
Probability thinking, 17 Technical expertise, 17
Process performance, 110–111 Technical issues, 46–47
Process strategy, 17, 21–22 Technical skills, 100
Production-ready, 50 3Ps (People, Process, and Providers),
Product teams, 61 16–23
Providers strategy, 17, 22–23 Time periods, 81–83
Pushback from other teams, 26 Trained people, 7
Training
Qualitative data analysis, 112–113 lifecycle, 89
success, 90–91
Reactive training, 89 tools, 89–90
Recommendations, 140 Trust, 27, 101
Reports, 73–76
and analysis, 86 User attributes, 64
building, 90
change and segments, 83 Value per insight, 69
and charts, 77–80 Visually appealing, 76–77
format for audience, 80–81
human design, 83–85 Web attribution, 33, 34
KPIs, 80 What Does It Mean (WDIM)
less is more, 83 question, 118–120
time periods, 81–83 Wisdom, 91
visually appealing, 76–77 Wrong tools, 26The Data Mirage
RUBEN UGARTE
Why Companies Fail to Actually Use Their Data
Ruben Ugarte
The Data Mirage: Why Companies Fail to Actually Use Their Data is a business
book for executives and leaders who want to unlock more insights from their
data and make better decisions.
The importance of data doesn’t need an introduction or a fancy pitch deck.
Data plays a critical role in helping companies to better understand their
users, beat out their competitors, and breakthrough their growth targets.
However, despite significant investments in their data, most organizations
struggle to get much value from it. According to Forrester, only 38% of
senior executives and decision-makers “have a high level of confidence in
their customer insights and only 33% trust the analytics they generate from
their business operations.”
THE DATA MIRAGE
This reflects the real world that I have experienced. In this book, I will help
readers formulate an analytics strategy that works in the real world, show
them how to think about KPIs and help them tackle the problems they are
bound to come across as they try to use data to make better decisions.
Ruben Ugarte is an expert in data and decision making. He has worked with
over 75+ companies from 5 continents and all company stages to use data to
make higher quality decisions. These decisions helped companies significant-
ly boost performance, increase profitability, dramatically lower costs, and
make their teams world-class. He also maintains a popular blog that has been
read by over 100,000 readers. He currently resides in Vancouver, Canada.
Big Data, Business Analytics, and Smart Technology Collection
Mark Ferguson, Editor
ISBN: 978-1-95334-952-1You can also read