Annual Investor Update - July 2021 - New Fortress Energy
←
→
Page content transcription
If your browser does not render page correctly, please read the page content below
July 2021

Annual
Investor
Update

Executive Summary

                              Last 12 months have been extraordinary for NFE

                       Jamalco CHP,
          Miami          Jamaica                Shannon,                                                             1   Greatly expanded our footprint
      Liquefier, USA                             Ireland
                       Montego Bay,                                                                                      from 3 to 11 LNG import terminals &
                          Jamaica                                                                                        facilities(1)
                         San Juan,
                        Puerto Rico
La Paz,                                                                                                              2   Completed construction of
Mexico                    Old Harbour,                                                                                   several terminals & facilities
                            Jamaica       Barcarena, Brazil
                                                                                                                         San Juan, PR
                                                               Colombo, Sri Lanka
 Puerto Sandino,
                                                                                                                         La Paz, Mexico
                                           Suape, Brazil                                                                 Puerto Sandino, Nicaragua
   Nicaragua
                                                                                                                         (expected September)
                                         Sergipe, Brazil

                                                                                                                     3   Launched Fast LNG
                                      Santa Catarina, Brazil         Terminals & assets as of July 2020
                                                                                                                         & contracted 100% of current gas
                                                                     Additional terminals & assets since July 2020       demand
                                                                     FSRU

                                                                                                                     4   Sustainability focus on clean fuels
                                                                     FLNG
                                                                                                                         goal to reach net-zero carbon emissions
                                                                                                                         by 2030

                                                                                                                                                               2
Executive Summary
                          Impact of these activities will be reflected in
                           Illustrative Annualized Op. Margin Goal(2)
Q4 2021 expected to be first “clean quarter” with Illustrative Annualized Op. Margin Goal of $1.5bn by end of 2023

                        2021                          2022                        2023
                       $500mm                         $1.1bn                        $1.5bn
                    Illustrative Annualized      Illustrative Annualized       Illustrative Annualized
                        Op. Margin Goal              Op. Margin Goal               Op. Margin Goal

                 Q4 expected to be first        new Brazil terminals            expect to reach
                   “clean quarter”(3)            expected online            run-rate at all terminals
                                                    end of Q1                   by end of 2023

                                                                                                              3
Question 1

What are our expectations for operating
        margin through 2023?

                                          4
Operating Margin

                                        ~$1.6bn(4) Illustrative Op. Margin Goal
                                                                                            Committed GPD          Total Volumes                                       18.8mm
                            20.0mm
                                                                                                                                                            13.7mm
                                                                                                                                     9.7mm       11.0mm
                                                                                                        6.5mm
                            10.0mm
                                                                                    4.2mm                        3.7mm 6.9mm                                5.8mm      5.9mm
                                         1.4mm          1.5mm         2.6mm                     2.4mm                                3.4mm       4.1mm
                                                                                                                       3.2mm
                                    -
                                             Q1           Q2           Q3           Q4        FY’21      Q1        Q2         Q3         Q4         FY’22     FY’23    Run-Rate
 Committed GPD
 Jamaica & US                               894k         994k        1,008k        980k       968k      1,038k    1,014k    1,095k      1,114k     1,065k     1,123k    1,123k
 Puerto Rico                                545k         518k         838k         608k       621k      471k       889k      889k       889k        785k      889k       889k
 Mexico                                       -            -           80k         465k       136k      564k       564k      564k       564k        564k      564k       564k
 Nicaragua                                    -            -           95k         649k       186k      695k       695k      695k       695k        695k      695k       695k
 Brazil                                       -            -          613k        1,328k      485k      885k       70k       157k       852k        491k      1,454k    1,454k
 Sri Lanka                                    -            -            -            -          -         -         -          -             -        -       1,034k    1,192k
                      (5)
 Committed GPD                             1,440k       1,513k       2,634k       4,030k     2,397k     3,654k    3,232k    3,400k      4,114k     3,600k    5,760k     5,918k
                (6)
 Likely GPD
 Brazil                                       -            -            -            -          -       1,453k    2,063k    4,319k      4,860k     3,174k     4,921k    5,447k
 Ireland                                      -            -            -            -          -          -         -         -           -          -        833k     5,000k
 Operating Terminal Growth                    -            -            -          144k        36k      1,361k    1,572k    1,993k      1,993k     1,930k     2,226k    2,458k
 Total Volumes Expected(7)                 1,440k       1,513k       2,634k       4,174k     2,433k     6,468k    6,867k    9,713k     10,967k     8,704k    13,740k   18,823k

 Illustrative Op. Margin Goal less
 SG&A(12) ($mm's)
 Expected Illustrative Op. Margin
                                            $33          $130         $171         $184       $518      $220       $255      $285       $313       $1,073     $1,498    $1,651
 Goal
 (-) SG&A(12)                               (45)         (35)          (35)         (35)      (150)      (38)      (38)      (38)        (38)       (150)     (150)     (150)
 Expected Illustrative Op. Margin
                                            ($12)        $95          $136         $149       $368      $182       $217      $247       $276        $923     $1,348     $1,501
Goal less SG&A
                                                                                                                                                                                  5
      Note: SG&A forecast for Q2 through Q4 is based on an annualized SG&A cost of $150mm
Market Opportunity

                     Each of our markets has unique characteristics & opportunities
                                                                                                                                     NFE Expected Volumes (GPD)
                                                                                  Electricity                   %
                                                                          GDP     consumed      Installed   electricity      Total         Total
                                    Annual                 GDP           annual   per capita    Capacity    generated     Committed(5)    Likely(6)     Total        Total
              Population          growth rate             (USD)          growth     (kWh)         (MW)      by thermal     (Run-Rate)    (Run-Rate)   (Run-Rate)   Capacity(8)

  Brazil            211mm              0.7%            $1,800 bn         3.7%       2,413       150,000        21%          1,454k        5,447k       6,901k       33,457k

 Jamaica            3mm               0.44%              $17 bn          0.7%        949         1,078         83%          1,062k         535k        1,597k        6,740k

Puerto Rico         3mm                0.3%             $105 bn          1.2%       6,493        5,000         96%           889k          727k        1,616k        2,700k

  Mexico
                    0.8mm             3.24%               $7 bn          3.8%                     750          95%           564k         1,016k       1,580k        1,800k
  (BCS)                                                                             4,875

Nicaragua           6.5mm             1.24%              $13 bn          4.5%        552         1,500         55%           695k          180k         875k         2,400k

  Ireland           5mm                1.5%             $389 bn          5.5%       5,712        10,652        66%             -          5,000k       5,000k       10,000k

 Sri Lanka          22mm               0.6%              $84 bn          2.3%        578         4,046         54%          1,192k           -         1,192k        6,000k

  United
                    328mm              0.5%           $21,430 bn         2.2%      11,515       1,117,475      61%          5,918k        12,905k     18,823k       63,197k
  States

              (i)    Data from: BNEF Climatescope, World Bank, and EIA
                                                                                                                                                                        6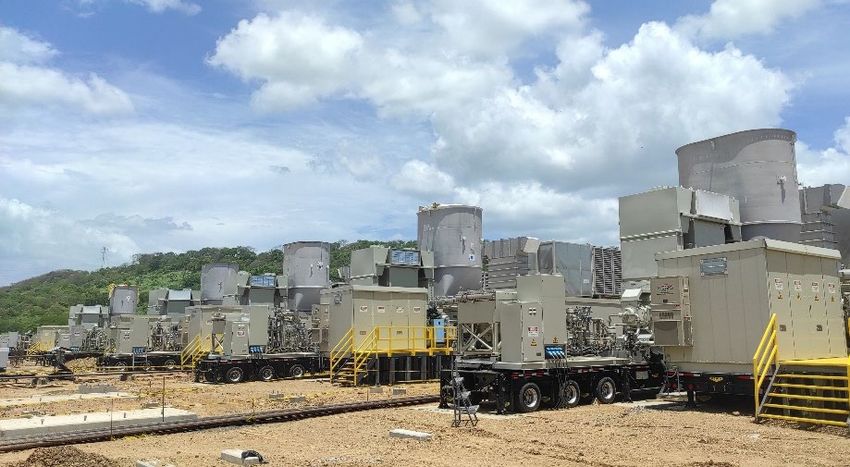
Brazil

              Brazil: declining gas supply & critical power shortages amidst growth
 Brazil is in urgent need of reliable, competitive LNG to supply and decarbonize growing power, industrial, and transport needs

Country overview                                                                  Majority of power is                               Brazil’s energy system faces
                                                                                  intermittent hydro(i)                              two main challenges
“New Gas Law” passed Apr-2021 to end Petrobras monopoly

                                                                                                                                         1     Eastern seaboard largely
                                                                                                                 21% thermal
                                                Barcarena
                                                Terminal
                                                                                                                                               connected by pipeline
                                            1
                                                                                                                                               has historically been
                                                                        Suape
                                                                       Terminal                                                                supplied with gas by
                                                                       2                     Brazil’s power
                                                                                                                                               sources now in decline
                                                                                                sources                                        (Bolivia, Petrobras)
                                                               3
                                                                       Sergipe
                                                                       Terminal
                                                                                                                     79% renewable
                                                                                                                                         2     Consistent decline in
                                                                                                                                               hydro conditions
                                                                                                                                               resulting in intermittent
                                                                                                                                               power and critical
                                            4       Santa Catarina
                                                      Terminal
                                                                                                                                               shortages
      NTS Pipeline
     TAG Pipeline
                                                                                            65% of Brazil’s power is                           Water inflows at largest reservoir
 Bolivian Pipelines                                                                                                                            (Itaipu) at 20-year lows & 50%
Gasbol (TBG) & Rio                                                                              hydroelectric                                  below average
        San Miguel

                  (i)   ONS (National Electric Grid Dispatch Agency)
                                                                                                                                                                                    7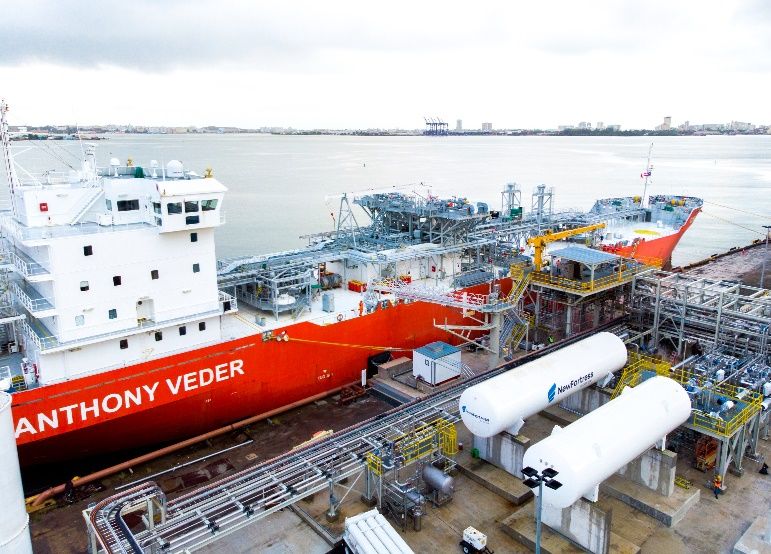
Brazil

                         Pursuing two main opportunities in Brazil
          Significant opportunity to decarbonize Amazon & replace declining and high-priced gas supply

          Decarbonize Amazon                                                 Replace declining &
                                                                            high-priced gas supply
   Barcarena terminal can help decarbonize
   Amazon by converting from HFO to gas                             Suape & Santa Catarina terminals designed to
                                                                        connect into high-volume pipelines
            1                            2
 Sole gas supply to serve    Convert over 3 GW of off-
large industrial customers    grid, oil-based power
at mouth of Amazon river     demand “up river” to gas

                                                                      Supply high-volume        Provide stable power
                                                                  customers in undersupplied   to regions dependent
                                                                     regions that face high    on intermittent hydro
                                                                      transport fees & gas
                                                                           shortages

                                                                                                                       8
Brazil

3 new terminals under development(9) expected online(10) in Q1 2022
                  Barcarena                             Santa Catarina

                                                                                                                 Volumes (GPD)

                                      (11)                                     (11)                   Committed(5)    Likely (6)   Total    Capacity (8)

    Commence Operations: expected            Commence Operations: expected            Barcarena           979k         857k        1,835k     9,559k
    January 2022                             March 2022
    Status: EPC contract finalized           Status: EPC contract expected July’21    Suape               268k         2,514k      2,782k     9,559k
    Development Start Date: 2017             Development Start Date: 2016
                                                                                      Sergipe (50%)       207k            -        207k       4,780k
                    Suape                                   Sergipe
                                                                                      Santa Catarina        -          2,077k      2,077k     9,559k

                                                                                       Total Volume      1,454k       5,448k       6,901k    33,457k

    Commence Operations: expected Q1
    2022
    Status: Finalizing PPA transfer          Status: in operation

    Development Start Date: 2018
                                                                                                                                                       9
Puerto Rico

     Puerto Rico is largely unconnected to pipelines & reliant on oil-based fuels
                                                                                 Puerto Rico needs more reliable, environmentally-friendly power

  Territory overview(i)
                                                                                                                               Majority of power is                       Puerto Rico’s energy system
                                                                                                                               thermal and oil-based(ii)                  faces three main challenges
                                                              Vega Baja
                                             Barceloneta                                      Isla Grande G.I.S.                           4% renewable
  Victoria                 Hatillo                                       Dorado       Viaducto

               San Sebastian                Dos Bocas
                                                                                          Hato Rey
                                                                                                Martin
                                                                                                    Pena
                                                                                                           Palmer
                                                                                                                    Fajan
                                                                                                                                                                            1     3,000 MW of power is
Anasco

               Mayaguez
                                Caonillas                                                 Monacillos
                                                                                                      Benwind
                                                                                                          Canovanas
                                                                                                                                                                                  not connected to
               Planta
                                                    Toro Negro
                                                                      Comerio                Juncos
                                                                                          Caguas
                                                                                                               Rio
                                                                                                               Blanco
                                                                                                                      Daguao
                                                                                                                                                                                  pipelines
                                                                       Barranquitas                          Humacao
                                                           Juana Diaz                   Cayey
         Acacias                            Canas                                                           Yabucoa
                                                                                                          Shel                              Puerto Rico’s
                   San German                   Ponce       Pattern
                                                            Wind
                                                                        Santa
                                                                        Isabel        Jobos
                                                                                                Maunabo                                    power sources                    2     Power is located far
                                Guanica
                                                            Farm
                                                                                                                                                                                  away from where
              230 KV transmission lines                                                                                                                                           people are
              115 KV transmission lines

              115 KV underground lines
                                                                                                                                                            96% thermal
              230 KV transmission center

              115 KV transmission center
                                                                                                                                                                            3     Thermal power is
              Standalone peakers                                                                                                                                                  primarily coal &
                                                                                                                                   67% of Puerto Rico’s power                     oil-based
                                                                                                                                     comes from coal & oil

                    (i)
                    (ii)
                            PREPA investor presentation
                            PREPA investor presentations, third-party research, and internal management estimates
                                                                                                                                                                                                         10
Puerto Rico
Pursuing three main strategies in Puerto Rico
Significant opportunity to help decarbonize Puerto Rico while providing more reliable, efficient power
Supply Build new Supply large
existing gas-fired industrial
power plants power users
Serve existing Strategically Provide large
gas plants located to serve industrial users
high-demand (Pfizer, Coke, etc.)
Convert areas with energy
oil-fueled plants security
11Puerto Rico
Puerto Rico facility commissioned during COVID
Committed volumes(5) at ~900k GPD with additional ~725k GPD likely (6)
Updates
100+ loads completed
despite COVID-19
6+ customers
Volumes (GPD)
Committed(5) Likely(6) Total Capacity(8)
889k 727k 1,616k 2,700k
12Jamaica
Jamaica’s energy system has been greatly decarbonized since our arrival
Jamaica still has further opportunities for decarbonization, particularly in the marine sector
Country overview(i) Majority of power Jamaica’s energy system
is thermal(i) faces two main challenges
81%
64%
17% renewable
1 Older power plants
83% thermal
% electricity need to be
generated decarbonized
from gas
27% Jamaica’s
power sources
22% 22%
2 The marine industry
0% (cruise and container
ships) need to be
2015 2016 2017 2018 2019 2020
decarbonized
Since our arrival in Jamaica, gas-fired Gas now accounts for
generation has increased significantly ~80% of power generation
(i) Jamaica Integrated Resource Plan, third-party research, internal management estimates 13Jamaica
Pursuing two main opportunities in Jamaica
Significant opportunity to decarbonize Jamaica’s old power plants and the marine industry
Decarbonize old power plants Marine bunkering
There are incremental opportunities to
complete Jamaica’s decarbonization by
converting old power plants to gas IMO 2020 Significant interest from
cruise & container
industries for bunkering
14Jamaica
Our Jamaica terminals are serving over 21 customers
Committed volumes(5) at ~1,000k GPD with additional ~535k GPD likely(6)
Montego Bay
Volumes (GPD)
3 Committed(5) Likely (6) Total Capacity (8)
assets
Montego Bay 406k 120k 526k 740k
21+ Old Harbour 656k 415k 1,071k 6,000k
customers
NFE terminal
Jamalco
Old Harbour Total Volume 1,062k 535k 1,597k 6,740k
NFE customer
Montego Bay Old Harbour Jamalco
15Mexico
BCS, Mexico is an energy “island” & highly reliant on oil-based fuels
Significant growth constrained by lack of power with need for environmentally-friendly options
Territory overview
Majority of power is La Paz’s energy system faces
thermal and oil-based(i) three main challenges
5% renewable
1 Isolated from rest of
country’s energy system
2 Vast majority of power
La Paz
BCS power
sources
comes from oil-based
fuels, at odds with
sustainability goals
95% thermal
3 Growing rapidly but
Peninsula further isolated constrained by power
by San Andreas Fault (significant demand
75% of BCS’s power comes from resorts & water
from HFO & diesel desalination)
(i) CENACE power plant data and third-party dispatch study commissioned by NFE 16Mexico
Pursuing four main opportunities in BCS
Several paths to grow our business in the region
Supply Create own Convert existing Bunkering
existing CFE merchant power plants to gas
plants with gas
17Mexico
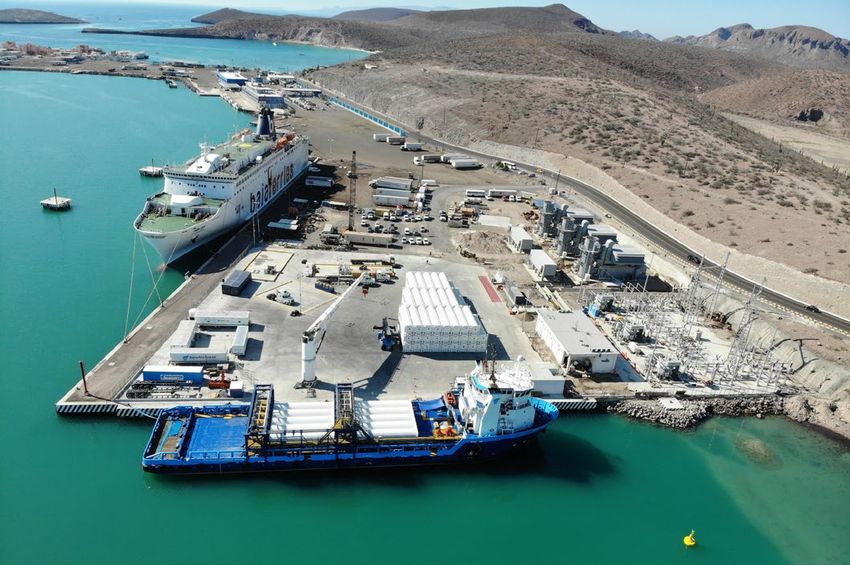
La Paz, Mexico terminal began operations this month
Committed volumes(5) at ~560k GPD with additional ~1,000k GPD likely (6)
Updates
Commenced operations
on July 14, 2021
First use of NFE’s proprietary
ISOFlex system
Power plant expected online in
next quarter
Volumes (GPD)
Committed(5) Likely(6) Total Capacity(8)
GPD 564k 1,016k 1,580k 1,800k
18Nicaragua
Nicaragua suffers from critically limited energy supply
High dependency on antiquated power plants & oil-based fuels
Majority of power is Nicaragua’s energy system
Country overview thermal and oil-based(i) faces two main challenges
45% renewable
1 Antiquated legacy
power plants create
inefficiencies
Nicaragua’s
power sources
2 Critically limited energy
supply: Nicaraguans
55% thermal consume one twentieth
of the electricity of the
average American
NFE terminal
Antiquated oil plant
55% of Nicaragua’s power
comes from oil
(i) BNEF Climatescope 19Nicaragua
Pursuing three main strategies in Nicaragua
Opportunity to address critical domestic energy needs as well as serve additional nearby markets
Baseload Exporting Supply large
power power industrial
users
NFE’s 300 MW plant Excess power can serve Terminal is strategic hub
provides baseload power neighboring countries for supplying gas to
large industrial users
Enables the Sold via SIEPAC across Central America
decommissioning of transmission line
legacy plants Terminal strategically
located near growing
industrial zone
20Nicaragua
Nicaragua terminal coming online(10) in next 60 days
Committed volumes(5) at ~700k GPD with additional ~180k likely (6)
Updates
Will feature NFE’s proprietary
ISOFlex system
Expected online date:
September 2021
Volumes (GPD)
Committed(5) Likely(6) Total Capacity(8)
GPD 695k 180k 875k 2,400k
21Ireland
Ireland suffers from a shortage of baseload power & single source for gas
Energy security is a critical issue for the country
Country overview Gas is expensive and Ireland’s energy system faces
supply is depleting(i) two main challenges
1 Expensive UK imports
with no alternative;
indigenous supply to
deplete by 2025
2 Lack of available
baseload power for
increasing demand
and growth in data
centers
Ireland’s gas market is expected to
NFE terminal
reach 6 MTPA by 2025 with no
alternative to expensive UK imports
(i) Third-party research and internal management estimates 22Ireland
Pursuing two main strategies in Ireland
Securing Ireland’s energy future
Build LNG Build new
import terminal thermal generation
Ireland's first LNG import Strategically locate thermal
terminal generation
Displace expensive UK imports Serve increasing demand for
data centers and base load
Sell gas to Ireland’s existing power
utility and industrial customers
23Ireland
Our Ireland terminal development is progressing on time
~5,000k GPD likely volumes(6)
(11)
Updates Volumes (GPD)
August 2021 March 2022 Q1 2022 Q3 2022 2H 2023
Committed(5) Likely(6) Total Capacity(8)
Permits Permits NTP & Pipeline Terminal GPD - 5,000k 5,000k 10,000k
submitted in hand equipment construction commences
delivery start operations
24Sri Lanka
Sri Lanka is reliant on antiquated oil plants and oil-based fuels
Sri Lanka has no existing gas infrastructure amidst a growing population and high power costs
Sri Lanka is heavily reliant on Sri Lanka’s energy system
Country overview oil-based fuels(i) faces three main challenges
46% renewable 1 22mm population on
island entirely reliant on
fuel imports
2 Lack of available
Sri Lanka’s
power sources baseload power plants
resulting in high
electricity cost
($0.15+ avg. power)
54% thermal
NFE terminal
3 ~1 GW of existing
Antiquated oil plant
and/or planned gas
54% of Sri Lanka’s generation, but no
power is generated current gas
from coal & oil infrastructure
(i) Ceylon Electricity Board; Long-Term Generation Expansion Plan 25Sri Lanka
Pursuing three main strategies in Sri Lanka
Opportunity to introduce natural gas to the country
Sri Lanka’s first Existing New baseload
LNG import baseload power power
terminal
Construct LNG terminal Invest in existing 300 MW Signed MOU with LTL
4km offshore of Yugadanavi Power Plant Holdings to construct new
Colombo 350 MW gas-fired power
Configured to run dual-fuel plant on 20-year
Sole source of gas with natural gas government PPA
supply to main power
complex, Kerawalapitiya Combined cycle; most New 300 MW gas-fired
efficient thermal plant in power plant bid launched;
country bids due in Sep. 2021
26Sri Lanka
Sri Lanka terminal is making significant progress
~1,200k GPD committed volumes(5)
Volumes (GPD)
Committed(5) Likely (6) Total Terminal
capacity (8)
300 MW
560k - 560k
Yugadanavi
350 MW -
632k 632k
New Plant
Total Volume 1,192k - 1,192k 6,000k
Yugadanavi Power Plant
Updates
July 2021 Aug 2021 Q4 2021 Q4 2022 Q1 2023
Signed Framework Definitive Agreement Fully permitted for LNG Terminal commences COD of new 350
Agreement w/ for acquisition of Terminal before year end operations MW plant
government & MOU w/ existing 300 MW
LTL Holdings plant
27Question 2
How exposed are you to commodity risk?
28Gas Supply
LNG markets are currently tight
Near-term tightness alleviated in future years as additional supply comes online
Price curves(i)
Current tightness driven by: Outlook: 12
10
8
disruptions due to Currently
$/MMBtu
1
6
weather events high prices 4
will decline
2 increasing Chinese 2
in coming -
demand 2022 2023 2024 2025 2026 2027
years as new
TTF JKM HH
LNG supply
20% Chinese share of comes online 200 LNG supply additions(ii)
global LNG demand
MTPA (cumulative)
15%
150
10%
100
5%
0% 50
2000
2001
2002
2003
2004
2005
2006
2007
2008
2009
2010
2011
2012
2013
2014
2015
2016
2017
2018
2019
2020
2021 YTD
0
2022 2023 2024 2025 2026 2027
Canada Indonesia Mauritania
Mexico Mozambique Nigeria
Qatar Russia US
(i) ICE Exchange, NYMEX 29
(ii) Goldman Sachs ResearchGas Supply
Our gas exposure is covered on current committed volumes(5)
We have minimal exposure on committed volumes(5)
at operational facilities
Committed Demand from 2022 2023 2024 2025
Operational (kGPD) (10)
Sergipe, Brazil 389 207 207 207
We have purchased enough gas Jamaica 1,004 1,065 1,065 1,065
Miami 62 62 62 62
to cover committed volumes Puerto Rico 785 889 889 889
from operational terminals Mexico 564 564 564 564
Nicaragua 695 695 695 695
Total Demand (cargoes) 32 32 32 32
# Cargoes purchased 28 32 32 32
Exposure to gas prices is Net need 4 0 0 0
minimal
Committed Demand from 2022 2023 2024 2025
In Development (kGPD)(9)
Suape, Brazil 22 268 268 268
Barcarena, Brazil 80 979 976 979
Sri Lanka - 1,034 1,192 1,192
Total Demand (cargoes) 1 21 22 22
As we get closer to operations in Brazil & Sri Lanka, we will cover these volumes
30Gas Supply
Our goal is to reduce or eliminate commodity risk to our business
We have purchased gas to meet our demand For next 6 years,
we have purchased
Supplier 2022 2023 2024 2025 2026 2027
167 cargoes,
equivalent to $3.2bn
Shell 14 14 14 14 8 8
Cheniere 10 16 16 16 14 10
Ocean LNG 3 2 2 2 2 2
Long-term, we intend
Total Supply
(# of Cargoes)
27 32 32 32 24 20 to supplement our portfolio
by self-generating
a significant portion of
167 cargoes our LNG from FLNG
31Fast LNG
What is FLNG?
FLNG is a liquefier built on a ship that can access stranded offshore gas fields
7
FLNGs
in world
(operational or under
development)
NFE owns
50%
of Hilli(13)
FLNG
FLNG Hilli
32Fast LNG
How big is the opportunity?
Currently only a few FLNGs servicing significant amount of stranded gas
37
28 85
296
19 14
76 133
91 133 Europe
20
13 218 Eurasia
50
109 102
North America
Middle East
673
50
508 51
63
56 Africa 159 94
28 26
46 44
Latin America Reserves over production ratios (no. of years) Technically recoverable resources (trillion cubic meters) Asia Pacific
Proven reserves R/P ratio Conventional
Technically recoverable resources Unconventional
R/P ratio
Source: IGU Global Gas Report 2020 33Fast LNG
How does Fast LNG work?
Fast LNG is less expensive and faster than traditional FLNG
Fast LNG is a mobile, floating natural gas liquefaction platform
Floating LNG (FLNG) cryogenic flexible
ship to ship transfer
(5 years ago) hose system
liquefier
storage vessel
jackup rig
LNGC
FSRU converted to
floating liquefier
Allows Built using existing Benefits gas
• Expensive to build
liquefaction of marine infrastructure, asset owners,
(billions of dollars)
stranded such as jack-up rigs customers
• 4-5 year lead time
offshore gas or semi-submersible and the
vessels environment
34Fast LNG
What have we done?
Expected to commence operations on our first Fast LNG facility in Q4 2022
We purchased 3 jack-up rigs We’re shrinking footprint & weight of equipment
Need ~75k-100k square feet of deck space
(11)
Timeline
March 2021 June 2021 September 2021 July 2022 Q4 2022
Declared FID Engineering & Assembly Installation Commence
procurement operations
35Fast LNG
What is the goal?
Accessing stranded gas is a win-win for both NFE and our partners
Our benefits Partner benefits
Faster, with Cheaper, with costs Significant returns Domestic gas
development time of construction for shareholders production and use
~$500mm less than 18 months ~$500mm benefits governments
for
1.4MTPA Generate LNG at Satisfies our Significant returns Provides gas for local
~50% market cost demand for governments industries, leading to
economic growth
36Fast LNG
Next steps
Select field for our Commence
first deployment in operations
30-60 days in Q4 2022
37Question 3
How do we pay for our growth?
38Liquidity
What is the current financing situation?
NFE maintains a simple balance sheet and capital structure
Total Capitalization Deleveraging as Projects Turn Online
$11.2 bn
Base Case
Debt 3.7x
$2.95bn NFE Corporate $4.6 bn
$1.6bn Asset Backed
41%
Equity
2.9x
$138mm Preferred Equity
$6.5bn NFE Market Cap
$6.6 bn
59%
Run-Rate YE 2023 (15)
Op. Margin(2) (-)
cash SG&A(14) $1,543 mm $1,950 mm
• NFE total leverage of 3.7x going to < 3.0x
• Ample NFE corporate debt service coverage of 8.2x (committed(5) + likely(6)) and 5.3x (committed(5))
39Liquidity
What is the growth plan?
We need $1.6bn to finance our growth plan
Funding Needs ($mm)
Mexico + Nicaragua $250
1 Fast LNG (remaining) $475
$1.6bn
total
Brazil (Terminals + Suape Power Plant)
Sri Lanka
$350
$300
= needs
Ireland Terminal $150 (over 2
Other Capex (Small Scale / Drydock / Ship Reactivation) $100
years)
Total Uses ~$1,625
NFE can fund the capex need via cash from operations, financings against unencumbered assets or asset sales
40Liquidity
What is our capital plan?
We plan to finance unencumbered marine vessels and monetize select assets
Funding Sources ($mm)
New LC Facility (80% of $75 available) Signed $60
Jamalco Sale Leaseback (net) Signed and $100mm committed $280
Ship Financings (net) Signed and $300mm committed $800(16)
Nanook, Power Plants, and Other Asset Sales In process $400+
(over ~$2bn of net value possible)
Total Sources $1,600
Capital plan fully finances terminals in development(9) & 1 Fast LNG unit with no need for equity issuance
41Question 4
What is our sustainability plan?
42Clean Fuels
The carbon emissions crisis needs an immediate solution
We want to lead the energy transition by supplying customers with clean, hydrogen-based fuels
The carbon emissions situation
Carbon dioxide emissions have risen exponentially
Fossil fuels like coal, oil and gas are major sources of the
We are
51 billion tons(i) of greenhouse gases emitted each year. 7% focused on
40
19% Where do our decarbonizing
Global carbon 31% emissions come
30
dioxide
emissions(ii)
from?
transport &
industry with
Billion tons of CO2
Industry
16% Power
Transport
27%
20 Agriculture
Other
clean, hydrogen-
10 based fuels
~75% of all GHG emissions
0 come from three main sectors, all of which are
1850 1900 1950 2000 large consumers of fuels(iii)
(i) “How to Avoid a Climate Disaster” by Bill Gates, page 3
(ii)
(iii)
ICOS Data supplement to the Global Carbon Budget 2020; CICERO Center for International Climate Research, Figures from the Global Carbon Budget 2020
“How to Avoid a Climate Disaster” by Bill Gates, page 55
43Clean Fuels
Hydrogen as a clean fuel solution
Most of today’s hydrogen is produced with significant carbon dioxide emissions
Where is hydrogen
Hydrogen Hydrogen Production
commonly found today?
H
H H
H C H
Steam Methane Reforming
• Most abundant element in H • Vast majority of hydrogen comes from
the universe steam methane reforming (SMR)
methane
• Burns clean and contains • Natural-gas based process that emits
zero carbon 10 kg CO2 / kg H2(i)
• Smallest molecule (H2) O • Responsible for 830 million tons(ii) of
makes it difficult to transport CO2 emissions per year, or ~3% of
H H
and store global emissions(iii)
water
(i) U.S. Department of Energy Office of Scientific and Technical Information: Criteria Air Pollutants and Greenhouse Gas Emissions from Hydrogen Production in U.S. Steam Methane Reforming Facilities
(ii)
(iii)
International Energy Agency
International Energy Agency; ICOS
44Clean Fuels
Blue ammonia is an ideal carrier molecule for hydrogen
Make hydrogen Remove and Add nitrogen Produce blue
via SMR sequester all CO2 from air ammonia
Why blue ammonia?
• Efficient hydrogen carrier
• Clean, carbon-free fuel
• Easily transported in liquid form
• Compatible with existing pipeline infrastructure
45Clean Fuels
We are building a clean fuels company
We will sell blue ammonia as a carbon-free fuel to power, transport & industry
Our strategy
CO2
Buy an existing Make it blue by Produce & sell blue
ammonia facility or capturing and ammonia as a clean
build our own sequestering CO2 hydrogen-based fuel
Implementation plan
1 2 3
Hire a Buy or build Capitalize
management an ammonia our business
team facility separately
46Clean Fuels
Illustrative blue ammonia economics
Countries and companies are Real economic implications for carbon emitters will
increasingly placing a price on carbon(i) accelerate the transition to clean fuels like blue ammonia
2000 2021
places with carbon taxes
7 61 or price mechanisms in
place today Illustrative blue ammonia • Assumes a gas feedstock
economics(17) cost of $3/MMBtu
highest tax rate per
$20 $137 emitted ton of CO2 in
place today
(single plant)
• Estimated cost to produce
blue ammonia will be
~$140/ton
• Estimate a near-term price
opportunity of $200-300/ton
Capex $300mm for blue ammonia
Volume 1,000 tons/day
• Pricing upside as more
Op. Margin(2) $50mm(ii) countries adopt carbon taxes
(i) World Bank; Tax Foundation
(ii) Assumes price of $250/ton blue ammonia and $15mm annual revenue from carbon sequestration credits 47Sustainability
We have also published our first annual Sustainability Report
The report includes our: Our goal is to be as transparent as
possible for investors
approach to sustainability
We have used industry standard
2020 accomplishments & future targets
reporting including:
emissions footprint
SASB
environmental record
TCFD
social investments
UN Sustainable
governance data Development Goals
Click here to view our Sustainability Report
48Question 5
What is our valuation expectation
assuming we achieve these goals?
49Valuation
Base case supports ~$82 to $120/share
Base Case
Valuation @ 15x (Committed + Likely, Run-Rate YE 2023)
$bn
15x 20x
Illustrative Annualized
Op. Margin Goal(2) 1.6 1.6
(-) Cash SG&A(14) 0.1 0.1
Subtotal 1.5 1.5
(x) Multiple (18) 15 20
Total Enterprise Value 23 31
(-) Consolidated Debt(19) (6.2) (6.2)
Equity Value 17 25
(/) Shares 206mm 206mm
$ per share $82 $120
50Appendix
51Appendix
Key modeling assumptions
1) Volumes
• Committed Run-Rate volumes of 5.9mm gpd including 1.1mm Jamaica, 0.9mm PR, 0.6mm Mexico, 0.7mm Nicaragua, 1.2mm Sri Lanka, 1.5mm Brazil
• Additional likely volumes of 12.9mm gpd including Ireland (5.0mm) and Brazil terminals (5.4mm) and organic growth from current terminals (2.6mm)
2) HH & LNG Price
• NFE assumes Henry Hub of $3.50 for 2021 remaining, $3.00 for 2022 and $2.75 long term
• NFE has purchased cargoes for its committed volumes through 2027 at a weighted average pricing structure of 115% HH + $2.56
• Long term open LNG for likely volumes is priced at an assumed at 115% HH + $2.50
3) Vessels, FOB-DES
• NFE assumes weighted average shipping costs of ~$0.50/MMBtu for its currently committed volumes and $0.75-$1.00/MMBtu for its
projects in development
• Vessels economics include charters to third parties for all owned vessels only with Run-Rate economics reflecting the following vessels
excluded as a result of utilization at one of NFE’s downstream terminals: Grand, Freeze, Penguin, and Celsius
4) FLNG
• NFE will build one 1.2 MTPA Fast LNG facility at $550mm capex
• The facility will produce ~2mm GPD and will earn an expected $2.00/MMBtu margins or ~$120mm per year
52Disclaimers
IN GENERAL. This disclaimer applies to this document and the verbal or written comments of any person presenting it. This document, taken together with any such verbal or written comments, is referred to
herein as the “Presentation.”
FORWARD-LOOKING STATEMENTS. Certain statements regarding New Fortress Energy Inc. (together with its subsidiaries, “New Fortress Energy,” “NFE,” the “Company,” “we” or “us”) in this Presentation may
constitute forward-looking statements within the meaning of the Private Securities Litigation Reform Act of 1995. You can identify these forward-looking statements by the use of forward-looking words such as
“outlook,” “believes,” “expects,” “by,” “converts” “approaches” “nearly” “potential,” “continues,” “may,” “will,” “should,” “could,” “seeks,” “approximately,” “predicts,” “intends,” “plans,” “estimates,” “anticipates,”
“target,” “goal,” “projects,” “contemplates” or the negative version of those words or other comparable words. Forward-looking statements include: Any forward-looking statements contained in this
presentation, including statements regarding goal to reach net-zero carbon emissions by 2030; Q4 2021 expected to be first “clean quarter”; new Brazil terminals expected online end of Q1; expect to reach
run-rate at all terminals by end of 2023; committed and likely GPD and volumes; NFE expected volumes; opportunities and strategies in Brazil, Puerto Rico, Jamaica, Mexico, Nicaragua, Ireland, and Sri Lanka;
commencement of terminal operations and projected online and first gas dates; alleviation of LNG market tightness in future years; we intend to supplement our portfolio by self-generating a significant
portion of our LNG from FLNG; expected first gas on and next steps for Fast LNG facility; ability to deleverage; projected funding needs; plan to finance unencumbered marine vessels and monetize select
assets; expected funding sources; ability to supply customer’s with clean, hydrogen-based fuels; blue ammonia strategy and implementation plan. For a discussion of some of the risks and important factors
that could affect such forward-looking statements, see the sections entitled “Risk Factors” and “Management’s Discussion and Analysis of Financial Condition and Results of Operations” in the Company’s
previous public filings with the U.S. Securities and Exchange Commission (the “SEC”), which will be made available on the Company’s website (www.newfortressenergy.com). In addition, new risks and
uncertainties emerge from time to time, and it is not possible for the Company to predict or assess the impact of every factor that may cause its actual results to differ from those contained in any forward-
looking statements. Such forward-looking statements speak only as of the date of this Presentation. NFE expressly disclaims any obligation to release publicly any updates or revisions to any forward-looking
statements contained herein to reflect any change in the Company's expectations with regard thereto or change in events, conditions or circumstances on which any statement is based.
PAST PERFORMANCE. Our operating history is limited and our past performance is not a reliable indicator of future results and should not be relied upon for any reason.
ILLUSTRATIVE ECONOMICS. Illustrative economics (including of Operating Margin and Blue ammonia economics) are hypothetical value based on specified assumptions that are aspirational in nature rather
than management’s view of projected financial results. Actual results could differ materially and the hypothetical assumptions on which this illustrative data is based are subject to numerous risks and
uncertainties, including particular risks and uncertainties introduced due to the novel coronavirus and its broad and ongoing impact on the worldwide economy.
53Endnotes 1. “11 terminals and facilities” refer to our 6 operational LNG import terminals and facilities: Montego Bay, Jamaica; Old Harbour, Jamaica; San Juan, Puerto Rico; La Paz, Mexico; Puerto Sandino, Nicaragua (expected September 2021); and Sergipe, Brazil, plus our 5 LNG import terminals and facilities in development: Shannon, Ireland; Barcarena, Brazil; Suape, Brazil; Santa Catarina, Brazil; and Colombo, Sri Lanka. 2. “Illustrative Annualized Operating Margin Goal” means our goal for Operating Margin under certain illustrative conditions, presented on a run rate basis by multiplying the average volume we expect to sell on a gallons per day basis, multiplied by 365, or for the relevant quarter, multiplied by four. “Operating Margin” means the sum of (i) Net income / (loss), (ii) Selling, general and administrative, (iii) Depreciation and amortization, (iv) Interest expense, (v) Other (income) expense, net (vi) Contract termination charges and Loss on Mitigation Sales, (vii) Loss on extinguishment of debt, net, and (viii) Tax expense (benefit), each as reported on our financial statements. Operating Margin is mathematically equivalent to Revenue minus Cost of sales minus Operations and maintenance, each as reported in our financial statements. Operating Margin is a Non-GAAP Financial Measure. This goal reflects the volumes of LNG that it is our goal to sell under binding contracts multiplied by the average price per unit at which we expect to price LNG deliveries, including both fuel sales and capacity charges or other fixed fees, less the cost per unit at which we expect to purchase or produce and deliver such LNG or natural gas, including the cost to (i) purchase natural gas, liquefy it, and transport it to one of our terminals or purchase LNG in strip cargos or on the spot market, (ii) transfer the LNG into an appropriate ship and transport it to our terminals or facilities, (iii) deliver the LNG, regasify it to natural gas and deliver it to our customers or our power plants and (iv) maintain and operate our terminals, facilities and power plants. There can be no assurance that the costs of purchasing or producing LNG, transporting the LNG and maintaining and operating our terminals and facilities will result in the Illustrative Annualized Operating Margins reflected. For the purpose of this Presentation, we have assumed an average Operating Margin between $3.88 and $4.60 per MMBtu for all downstream terminal economics, because we assume that (i) we purchase delivered gas at a weighted average of $6.40 in 2021, $6.09 in 2022, and $6.01 in 2023 via current long term contracts, (ii) our volumes increase over time, and (iii) we will have costs related to shipping, logistics and regasification similar to our current operations because the liquefaction facility and related infrastructure and supply chain to deliver LNG from Pennsylvania or Fast LNG (“FLNG”) does not exist, and those costs will be distributed over the larger volumes. For Hygo + Suape assets we assume an average delivered cost of gas of $6.00 in 2021 and $6.15 in 2022, and $6.35 in 2023 based on industry averages in the region and the existing LNG contract at Sergipe. Hygo + Sergipe incremental assets include every terminal and power plant other than Sergipe, and we assume all are Operational and earning revenue through fuel sales and capacity charges or other fixed fees. For Vessels chartered to third parties, this illustration reflects the revenue from ships chartered to third parties, capacity and tolling arrangements, and other fixed fees, less the cost to operate and maintain each ship, in each case based on contracted amounts for ship charters, capacity and tolling fees, and industry standard costs for operation and maintenance. We assume an average Operating Margin of $67k to $134k per day for ten vessels and the revenue from the existing tolling agreement for the Hilli FLNG going forward. For Fast LNG, this illustration reflects the difference between the delivered cost of open LNG of $5.66 per MMBtu based on the delivered cost of open market LNG less Fast LNG production cost. Management is currently in multiple discussions with counterparties to supply feedstock gas at pricing ranging between $1.00 and $3.00 per MMBtu, multiplied by the volumes for one Fast LNG installation of 1.2 MTPA per year. These costs do not include expenses and income that are required by GAAP to be recorded on our financial statements, including the return of or return on capital expenditures for the relevant project, and selling, general and administrative costs. Our current cost of natural gas per MMBtu are higher than the costs we would need to achieve our Illustrative Annualized Operating Margin Goal, and the primary drivers for reducing these costs are the reduced costs of purchasing gas and the increased sales volumes, which result in lower fixed costs being spread over a larger number of MMBtus sold. References to volumes, percentages of such volumes and the Illustrative Annualized Operating Margin Goal related to such volumes (i) are not based on the Company’s historical operating results, which are limited, and (ii) do not purport to be an actual representation of our future economics. We cannot assure you if or when we will enter into contracts for sales of additional LNG, the price at which we will be able to sell such LNG, or our costs to produce and sell such LNG. Actual results could differ materially from the illustration and there can be no assurance we will achieve our goal. 54
Endnotes
3. “Clean quarter” means the first quarter where all our developments with committed GPD, excluding Sri Lanka, are expected to contribute meaningfully to earnings and normalizes for any
   planned or unplanned maintenance events that may be experienced during the quarter. The Committed GPD, Likely GPD, and Total Volumes reflect management’s best estimates of
   average volumes produced for each location over each quarter. These volume estimates reflect terminals and facilities operating at full capacity with full permitting for each quarter,
   including average maintenance outages and average weather downtimes, all of which are subject to outside factors beyond our control.

4. The Committed GPD, Likely GPD, and Total Volumes reflect management’s best estimates of average volumes produced for each location over each quarter. These volume estimates
   reflect terminals and facilities that are fully permitted and operating at our expected volume performance for each quarter. These volumes have been adjusted to account for maintenance
   outages and average expected weather downtimes, all of which are subject to outside factors beyond our control. “Likely GPD” refers to contracts and potential expected operating
   margin volumes for which management currently believes will probably be awarded to the Company.

5. “Committed Volume”, “Committed Portfolio” “Committed GPD” or references to Commitments means our expected volumes to be sold to customers under binding contracts and awards
   under requests for proposals. Some, but not all, of our contracts contain minimum volume commitments, and our expected volumes to be sold to customers reflected in our “Committed
   Volumes” are substantially in excess of such minimum volume commitments. Our near-term ability to sell these volumes is dependent on our customers’ continued willingness and ability
   to continue purchasing these volumes and to perform their obligations under their respective contracts. If any of our customers fails to continue to make such purchases or fails to perform
   its obligations under its contract, our operating results, cash flow and liquidity could be materially and adversely affected. References to Committed Volumes in the future and percentages
   of these volumes in the future should not be viewed as guidance or management’s view of the Company’s projected earnings, is not based on the Company’s historical operating results,
   which are limited, and does not purport to be an actual representation of our future economics. “Total Capacity” refers to the technical, regulatory or physical limitation on our facility’s
   volume capacity, which could be our physical or permissioned capability to deliver LNG to the facility, landed or floating storage capacity at the facility, the loading or unloading rate of
   ISO containers, LNG or natural gas to or from the facility, or the technical capacity of the regasification equipment. For our projects in development, these capacity volumes represent our
   estimates of the limiting technical, regulatory or physical factor based on regulatory, technical and engineering advice that management has received.

6. “Likely GPD” refers to contracts and potential expected operating margin that management currently has a high probably that will be awarded to the Company. “Online” “Operational” “In
   Operation” or “Turning On” with respect to a particular project means we expect gas to be made available within thirty (30) days, gas has been made available to the relevant project, or
   that the relevant project is in full commercial operations. Where gas is going to be made available or has been made available but full commercial operations have not yet begun, full
   commercial operations will occur later than, and may occur substantially later than, our reported Operational date. We cannot assure you if or when such projects will reach full commercial
   operations. Actual results could differ materially from the illustrations reflected in this presentation and there can be no assurance we will achieve our goals.

7. “Total Volumes - Base Expectation” means total of Committed GPD and Likely GPD.

8. “Total Capacity” refers to the technical, regulatory or physical limitation on our facility’s volume capacity, which could be our physical or permissioned capability to deliver LNG to the
   facility, landed or floating storage capacity at the facility, the loading or unloading rate of ISO containers, LNG or natural gas to or from the facility, or the technical capacity of the
   regasification equipment. For our projects in development, these capacity volumes represent our estimates of the limiting technical, regulatory or physical factor based on regulatory,
   technical and engineering advice that management has received.

                                                                                                                                                                                                  55
Endnotes
9. “In Construction”, “Under Construction”, Development”, “In Development” or similar statuses means that we have taken steps and invested money to develop a facility or FLNG vessel,
including procuring land rights and entitlements, negotiating or signing construction contracts, and undertaking active engineering, procurement and construction work. Our
development projects are in various phases of progress, and there can be no assurance that we will continue progress on each development as we expect or that each development will
be Completed or enter full commercial operations. There can be no assurance that we will be able to enter into the contracts or obtain the necessary regulatory and land use approvals
required for the development , construction, and operation of these facilities on favorable terms, as expected or at all. Additionally, the construction of facilities is inherently subject to the
risks of cost overruns and delays, and these risks of delay are exacerbated by the COVID-19 pandemic. If we are unable to construct, commission and operate all of our facilities as
expected, or, when and if constructed, they do not accomplish our goals, or if we experience delays or cost overruns in construction, our business, operating results, cash flows and
liquidity could be materially and adversely affected.
10. “Online”, “Operational”, “In Operation” or “Turning On” with respect to a particular project means we expect gas to be made available within thirty (30) days, gas has been made available
to the relevant project, or that the relevant project is in full commercial operations. Where gas is going to be made available or has been made available but full commercial operations
have not yet begun, full commercial operations will occur later than, and may occur substantially later than, our reported Operational date. We cannot assure you if or when such projects
will reach full commercial operations. Actual results could differ materially from the illustrations reflected in this presentation and there can be no assurance we will achieve our goals.NFE
owns 50% of Hilli means 50% of the common units in Golar Hilli LLC (“Hilli LLC”), the owner of Golar Hilli Corporation (“Hilli Corp”), the disponent owner of the Hilli. The acquired interest in
Hilli LLC represents the equivalent of 50% of the two liquefaction trains, out of a total of four, that have been contracted to Perenco Cameroon SA and Société Nationale Des
Hydrocarbures pursuant to a Liquefaction Tolling Agreement.
11. This image is a rendering of a project that is not complete. “Run Rate” means the date on which management currently estimates the initial ramp-up of operations on a particular facility will
be over, and full commercial operations will be running at a sustainable level. Volumes of LNG and natural gas that we are able to deliver and sell through a particular facility may keep
increasing after the Run Rate date due to additional large or small scale customers being added for service by any particular facility, so the Run Rate does not represent the date on which
management expects the relevant facility to be operating at its Capacity Volume. Capacity Volume operations of such projects will occur later than, and may occur substantially later than,
Run Rate. We cannot assure you if or when such projects will reach the date Run Rate or full Capacity Volume. Actual results could differ materially from the illustration and there can be
no assurance we will achieve our goal.
12. SG&A means annualized fiscal year 2021 SG&A of $150mm.
13. NFE owns 50% of Hilli means 50% of the common units in Golar Hilli LLC (“Hilli LLC”), the owner of Golar Hilli Corporation (“Hilli Corp”), the disponent owner of the Hilli. The acquired
interest in Hilli LLC represents the equivalent of 50% of the two liquefaction trains (T1 and T2), out of a total of four, that have been contracted to Perenco Cameroon SA and Société
Nationale Des Hydrocarbures pursuant to a Liquefaction Tolling Agreement. We do not participate in any material profit from T3 and T4 if/when they are contracted.
14. Cash SG&A means annualized fiscal year 2021 SG&A of $150mm less $50mm of non-cash charges, non-capitalizable development expenses, transaction and integration costs associated
with merger and capital market transactions.
15. “Run Rate” means the date on which management currently estimates the initial ramp-up of operations on a particular facility will be over, and full commercial operations will be running at
a sustainable level. Volumes of LNG and natural gas that we are able to deliver and sell through a particular facility may keep increasing after the Run Rate date due to additional large or
small scale customers being added for service by any particular facility, so the Run Rate does not represent the date on which management expects the relevant facility to be operating at
its Capacity Volume. Capacity Volume operations of such projects will occur later than, and may occur substantially later than, Run Rate. We cannot assure you if or when such projects will
reach the date Run Rate or full Capacity Volume. Actual results could differ materially from the illustration and there can be no assurance we will achieve our goal.
56Endnotes
16. $800mm assumes the ultimate size of the debt we expect to incur to finance the ships.
17. Illustrative blue ammonia economics is based upon management’s current expectations for capex and volume related to a single plant.
18. Multiples are based on management’s current estimates and views. Actual results may vary materially.
19. $6.2 billion consolidated debt is the company’s total consolidated debt as of March 31, 2021 as adjusted for various subsequent events that occurred in the second quarter, plus $1.6
billion of anticipated funding sources as of July 20, 2021 (see slide 41 for more information).
57You can also read