Application of DSSAT crop simulation model to estimate the optimum dose of nitrogen fertilizer for the rice variety J-104
←
→
Page content transcription
If your browser does not render page correctly, please read the page content below
Cultivos Tropicales, 2020, vol. 41, no. 2, e01 abril-junio
ISSN impreso: 0258-5936 Ministerio de Educación Superior. Cuba
ISSN digital: 1819-4087 Instituto Nacional de Ciencias Agrícolas
 http://ediciones.inca.edu.cu

 Original article
 Application of DSSAT crop simulation model to estimate the optimum
 dose of nitrogen fertilizer for the rice variety J-104

 Osmel Rodríguez-González1*
 René Florido-Bacallao1
 Mario Varela-Nualles1
 Déborah González-Viera1
 Ramsés Vázquez-Montenegro2
 Lázaro Alberto Maqueira-López3
 Rogelio Morejón-Rivera3

 1
 Instituto Nacional de Ciencias Agrícolas (INCA), carretera San José-Tapaste, km 3½,
 Gaveta Postal 1, San José de las Lajas, Mayabeque, Cuba. CP 32 700
 2
 Instituto de Meteorología. Casa Blanca, Regla, Cuba. CP 11 700
 3
 Unidad Científico Tecnológica de Base "Los Palacios". Km 1½ carretera La Francia, Los
 Palacios, Pinar del Río, Cuba. CP 22900

 *
 Author for correspondence: osmel@inca.edu.cu

 ABSTRACT
 The rice (Oryza sativa L.), is one of the cereals of greater production worldwide. Cuba is one
 of the highest consumer countries in Latin America; with values of around 72 kg per capita
 per year. So far, the national production only satisfies 50 % of the needs. In spite of the large
 amount of resources that are destined to the production of rice cultivation, the yields that are
 currently obtained do not satisfy the existing demand nor are economically justified. The
 present work was developed with the objective of applying the DSSAT crop simulation
 model to estimate the optimal nitrogen fertilizer dose based on the expected yield of the rice
 variety J-104. To calibrate the model, three experiments were evaluated in the Los Palacios
 Base Scientific Technological Unit, belonging to the National Institute of Agricultural
Osmel Rodríguez-González, René Florido-Bacallao, Mario Varela-Nualles, Déborah González-Viera, Ramsés Vázquez-Montenegro,
 Lázaro Alberto Maqueira-López y Rogelio Morejón-Rivera

 Sciences (INCA), in different sowing dates. For the simulation, the runs of the model were
 made for different doses of nitrogen, varying them from 150 to 200 kg ha-1, with an interval
 of 10 kg ha-1 and the other parameters of the model were kept constant. The results show that
 the model is able to describe adequately the dependence of the yields with the level of
 nitrogen applied and the recommended dose to obtain the best yields.
 Key words: calibration, simulation models, yield

 INTRODUCTION
 Rice (Oryza sativa L.), is one of the cereals with the highest production worldwide and,
 together with wheat, meat and fish, constitute the basis of human nutrition. The 75 % of the
 world population includes it in their daily food diet and may exceed, in some cases, the
 consumption of other cereals (1,2).
 The Food and Agriculture Organization of the United Nations (FAO) reported that world
 production of this cereal in 2017 exceeded 0.6 % the previous year's campaign, reaching
 503.9 million tons. World rice utilization is also to increase by 1.1 % forecast. Human
 consumption should represent the totality of this increase, and allow an increase in world
 consumption per capita to 53.7 kg (3).
 Cuba is one of the highest consuming countries in Latin America; with values of around 72
 kg per capita per year. So far, national production only meets 50 % of the needs and these
 are completed with imports (3).
 Our country invests large sums in the import of this cereal for human consumption. The costs
 are getting higher and, in turn, they are difficult to acquire in the international market. That
 is why each area planted to rice cultivation must be obtained with high yields to satisfy the
 growing needs of the population with an efficient and rational use of resources.
 Despite the large amount of resources that are destined to the production of the crop, the
 yields that are currently obtained do not satisfy the existing demand nor are they
 economically justified. In the country, rice cultivars have a yield potential that exceeds 7.0 t
 ha-1 (4). However, despite the fact that in Cuba there are favorable climate and soil conditions
 for the growth and development of this cereal, in 2016 the yield did not exceed 3.7 t ha-1 (5).
 As in other crops, nitrogen is the main limiting factor in rice production. Its availability is
 considered essential because it is a basic component in all organic molecules involved in
Cultivos Tropicales, 2020, vol. 41, no. 2, e01 abril-junio
ISSN impreso: 0258-5936 Ministerio de Educación Superior. Cuba
ISSN digital: 1819-4087 Instituto Nacional de Ciencias Agrícolas
 http://ediciones.inca.edu.cu

 plant growth and development. It promotes the rapid growth of the plant and increases the
 size of the leaves, the number of spikelets per panicle, the percentage of full spikelets and the
 protein content in the grain (6).
 Today more than ever, increased food production depends on the prudent use of nitrogen.
 Furthermore, issues such as climate change, climate variability, soil and long-term carbon
 sequestration, effects on food security and environmental sustainability have become
 important aspects.
 Knowing adequately the nitrogen dynamics in the different stages of development of the rice
 plant, to be able to elaborate cheaper and low environmental impact alternatives are aspects
 of special importance and should be a priority object of professional updating. The need for
 information in decision-making is becoming more crucial every day and there is a significant
 gap between the information that is needed and that traditionally generated through
 disciplinary research. For this purpose, a tool such as crop simulation models is very useful.
 Ecophysiological based simulation models have been developed over the past 10 years for a
 significant number of crop systems. These are from other empirical models distinguished by
 their explicit representation of physical and biological processes such as photosynthesis, dry
 matter production, leaf area growth, plant development, nutrient cycling,
 and energy balance (7).
 Crop simulation models have proven to be tools that allow evaluating available resources,
 evaluating a large number of plant-environment-management interactions and facilitating
 decision-making, quantifying production risk from a probability analysis taking historical
 series of daily climate data and soil characteristics (8). The successful use of the culture model
 depends on the proper calibration of the models. The determination of the genetic coefficients
 (9)
 of a cultivar can be obtained from the appropriate calibration of the model . Crop models
 calibrated with cultivar parameters can be used to analyze and interpret different future
 scenarios due to modifications that may be proposed in crop management, changes in weather
 conditions or for yield forecasting, among other indicators (10).
 DSSAT is a popular model of cultivation used in more than 100 countries for more than
 (7)
 20 years . It is a microcomputer software package, which provides an interface for
 crop-soil simulation models, soil and climate data, and programs to evaluate management
 strategies.
Osmel Rodríguez-González, René Florido-Bacallao, Mario Varela-Nualles, Déborah González-Viera, Ramsés Vázquez-Montenegro,
 Lázaro Alberto Maqueira-López y Rogelio Morejón-Rivera

 For this reason, the objective of this work is to apply the DSSAT modeling tool to estimate
 the optimum dose of nitrogen fertilizer for the J-104 rice variety.

 MATERIALS AND METHODS
 Crop models have a working principle that goes from calibration, through validation, to
 simulation. To develop this research, the work was into two stages divided; the first to carry
 out the calibration of the model by obtaining the values of the genetic coefficients of the rice
 variety studied and the second to perform the simulations of the yield when using different
 nitrogen doses.

 Calibration
 To obtain the values of the genetic coefficients of the J-104 rice variety, data were taken from
 experiments carried out at the Los Palacios Base Scientific-Technological Unit (UCTB-LP),
 belonging to the National Institute of Agricultural Sciences; located in the southern plain of
 the Pinar del Río province (22° 44 ’north latitude and 83° 45’ west longitude, at 60 m a.s.l).
 Three planting dates were used corresponding to the cold or dry season, which in Cuba covers
 from November to February (11) (Table 1).

 Table 1. Sowing dates used in the experiments
 Nu Cold or dry season (November-February)
 Day Month Year
 1 15 Enero 2004
 2 2 Diciembre 2004
 3 10 Febrero 2005
 Source: Own elaboration

 The medium-cycle variety J-104, which has a semi-dwarf indica plant type, was used. Its
 leaves are deep green in color, good initial vigor and high ability of tillering; it stands out for
 its high performance potential; for these reasons, it becomes a producer favorite.
 The sowing was by broadcast carried out, with a norm of 120 kg ha-1 of seeds to ensure at
 least 320 plants per m2. Experimental plots of 64 m2 of surface and four replications were
 used.
Cultivos Tropicales, 2020, vol. 41, no. 2, e01 abril-junio
ISSN impreso: 0258-5936 Ministerio de Educación Superior. Cuba
ISSN digital: 1819-4087 Instituto Nacional de Ciencias Agrícolas
 http://ediciones.inca.edu.cu

 The phytotechnical work was as recommended in the Technical Instructions for the
 Cultivation of Rice carried out (11). Water availability was throughout the crop cycle ensured.
 Pest and weed control were carried out effectively. Fertilization was by applying K 2O and
 P2O5 at the time of sowing carried out, at a rate of 60 kg ha-1 of both; 100 kg ha-1 of nitrogen
 was also applied, fractionated during the crop cycle, applying 25 % of the total in each
 fertilization. Triple superphosphate (46 % P2O5), potassium chloride (60 % K2O) and urea
 (46 % N) were used as carriers (11).

 Collection of data
 The duration in days of the three phenological phases of the culture was evaluated in each
 experimental plot. The rice plant has three main vegetative phases: the vegetative phase,
 comprises the days elapsed from emergence to the cotton point; the reproductive phase, from
 the cotton point until the anthesis stage ends; and maturation, from anthesis to the maturity
 of the grain. Each phase was identified when more than 50 % of the experimental plot showed
 the characteristics of these stages.
 The determination of the agricultural yield and its components (number of panicles per m2,
 number of grains per panicle, percentage of empty grains and mass of 1000 grains) was
 carried out in each experimental plot. An area of 1 m2 was taken, with two replications in
 each replica and the values were expressed in t ha-1, at 14 % grain moisture. For panicles per
 m2, the counting method was used in an area of 0.50 m2, with four repetitions per plot. For
 the number of grains per panicle, 20 panicles were taken at random. These were shelled, the
 empty grains were separated from the filled ones and they were counted. For the mass of
 1000 grains, two samples were taken per plot of 1000 filled grains, which were weighed on
 an analytical balance.

 Preparation of input files
 Six input files were created to run the CERES-Rice model inserted in DSSAT v4.6: file X,
 file A, file T, soil file, climate file and genetic coefficients file.
 Files A and T stored the values of the physiological variables observed in the experiments
 and subsequently compared them with the values simulated by the model for calibration.
Osmel Rodríguez-González, René Florido-Bacallao, Mario Varela-Nualles, Déborah González-Viera, Ramsés Vázquez-Montenegro,
 Lázaro Alberto Maqueira-López y Rogelio Morejón-Rivera

 File X stored field conditions, experimental treatments and simulation options. Most of this
 file is the management data of crop production, separated into several sections.
 The soil in the area where the experiments were carried out is classified as Hydromorphic
 Gley Nodular Ferruginous Petroleum, according to the Cuban Soil Classification 2015 (12).
 For the preparation of the climate file, the values of the meteorological variables (maximum
 and minimum temperatures and daily rainfall) of the months in which the experiments were
 carried out, obtained from the Paso Real de San Diego Meteorological Station in Los
 Palacios, were used about 3 km from the experimental area.

 Calibration of the model
 The CERES – Rice model for DSSAT needs to be calibrated by obtaining eight genetic
 coefficients (P1, P2O, P2R, P5, G1, G2, G3 and G4). The P coefficients are those that
 consider phenological aspects of the crop, such as flowering and maturation.
 The G coefficients are to the potential yield of a specific variety related (13) (Table 2).

 Table 2. Description of the CERES-Rice genetic coefficients
 Coefficient Definition
 P1 Degrees days of accumulated heat from seedling emergence during which the rice plant does not respond to
 changes in the photoperiod.
 P2O Critical photoperiod or the longest duration of the day in which development occurs at maximum speed.
 P2R Degree to which the phasic development leading to the initiation of the panicle is for each hour of increase
 delayed in the photoperiod above P2O.
 P5 Degrees days of accumulated heat from the beginning of grain filling until physiological maturity.
 G1 Number of spikelets, potential estimated from the number of spikelets per gram of dry weight of the main culm
 in anthesis.
 G2 Weight of a grain under ideal growing conditions, that is, light, water and non-limiting nutrients and absence of
 pests and diseases.
 G3 Relative tillering coefficient when cultivating IR64 under ideal conditions.
 G4 Temperature tolerance coefficient, usually 1.0 for varieties grown in normal environments.
 Source: Own elaboration with information taken from (14)
Cultivos Tropicales, 2020, vol. 41, no. 2, e01 abril-junio
ISSN impreso: 0258-5936 Ministerio de Educación Superior. Cuba
ISSN digital: 1819-4087 Instituto Nacional de Ciencias Agrícolas
 http://ediciones.inca.edu.cu

 The calculation of the degrees days of accumulated heat (GDCA) (Equation 1) was carried
 out taking into account the duration of the phenological phases reached by the crop on the
 different planting dates and the temperature records, by adding the degrees
 days heat (GDC) (15).

 −
 = ∑ − [1]
 2

 where: Tmax is the maximum daily air temperature; Tmin is the minimum daily air
 temperature and Tbase is the base temperature in which the process of interest does not take
 place and in this case, it was taken at 9 ºC.
 The coefficients were adjusted by the manual method of trial and error until the less
 than 5 % was achieved between the values observed in the experiments and those simulated
 by the model, on the dates of anthesis and physiological maturity, mass of 1000 grains and
 grain yield (14).
 (16)
 and d-index were also calculated , with the following equations
 (Equations 2, 3 and 4):

 ( − )2
 = √∑ =1 [2]

 ( − ) 2
 √∑
 =1
 = 100 ∗ ̅̅̅̅
 [3]

 ∑ =1( − )
 2
 = 1 − ∑ ̅̅̅̅ ̅̅̅̅ |)2
 [4]
 =1 (| − |+| −

 ̅̅̅̅ –
 where: and - simulated and observed values, n is the number of observations; if
 mean of the values.
 It is feasible to use the above equations, since a useful tool to test the goodness of fit
 of simulation models and represents a global measure between observed and simulated
 values; the value closest to zero indicates good performance in the simulation (17).
 RMSEn was used to give a percentage measure of the relative difference between simulated
 and observed values on anthesis and physiological maturity dates, 1000 grain mass, and grain
Osmel Rodríguez-González, René Florido-Bacallao, Mario Varela-Nualles, Déborah González-Viera, Ramsés Vázquez-Montenegro,
 Lázaro Alberto Maqueira-López y Rogelio Morejón-Rivera

 yield. A simulation can be considered Excellent if the RMSEn is less than 10 %, Good if it is
 between 10 and 20 %, Reasonable if it is between 20 and 30 % and Bad if it is greater than
 30 % (18). It is proposed that d must be close to one (16).

 Simulation
 To carry out the simulations, the file of the experiment carried out in January 2004 was, taken
 and entered into the seasonal analysis tool included in DSSAT. The sensitivity analysis of
 the grain yield to the application levels of nitrogen fertilizer was carried out creating six
 experiments where the fertilizer doses were varied from 150 to 200 kg ha−1 of nitrogen with
 an interval of 10 kg ha−1 of nitrogen and the other model parameters were kept constant as
 defined in the calibration.
 For the simulation with the different nitrogen do5ses, the phenological phases of the fourth
 leaf, start of tillering, active tillering and cotton point were selected and the percentage of the
 fractionations were calculated from the dose recommended in the Technical Instructions for
 Rice (19) to obtain a yield of 6 t ha-1.
 The model run was performed to obtain the grain yield values for these experiments and they
 were compared to determine the best of them.

 RESULTS AND DISCUSSION
 Calibration
 The values of the genetic coefficients that determine the vegetative and reproductive growth
 for the variety J-104 are presented in Table 3. These summarize, quantitatively, how a
 particular variety responds to environmental factors. The determined values are in the range
 of values described in the CERES-Rice User Manual (20).

 Table 3. Values of the genetic coefficients for the variety J-104
 P1 P2O P2R P5 G1 G2 G3 G4
 (ºC) (h) (ºC) (ºC) (spikelets (g)
 per
 gram)
 600.0 10.00 200.4 350.5 45.11 0.025 1.00 1.129
 Source: Own elaboration
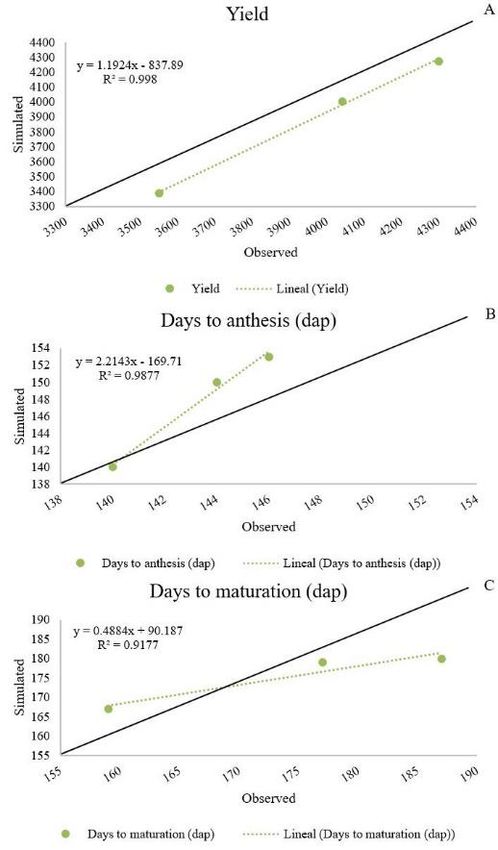
Cultivos Tropicales, 2020, vol. 41, no. 2, e01 abril-junio
ISSN impreso: 0258-5936 Ministerio de Educación Superior. Cuba
ISSN digital: 1819-4087 Instituto Nacional de Ciencias Agrícolas
 http://ediciones.inca.edu.cu

 Table 4 shows the comparison of the observed and simulated values, in terms of grain yield,
 1000 grain mass, days before anthesis and days at maturation, as well as the indicators of
 goodness of fit of the model. The predicted grain yields were in agreement with those
 observed with = 97.66 kg ha-1 and d = 0.98. Similar behavior had the values of the
 days before anthesis and the days at maturation with = 5.32 days and 6.2 days
 respectively, with d = 0.66 and 0.87 respectively. It is valid to highlight that although d is
 (4,14)
 below 0.9, there are authors who consider these values as satisfactory . In all the cases
 evaluated, the RMSEn behaved with values less than 10 %, which shows the excellence of
 the simulations carried out by the model.
 Other authors reported a higher RMSE value (305.2 kg ha-1), compared to that obtained in
 this investigation, for the yield of the LP-5 rice variety in the town of Los Palacios, Cuba (4).
 In Northwest India, the absolute RMSE for both anthesis and maturity was 6 days and the
 d-index was 0.72 and 0.96 for anthesis and maturity dates, respectively, that agrees with the
 results of this investigation (21).

 Table 4. Goodness of fit indicators for yield, 1000 grain mass, days before anthesis and days at
 physiological maturation
 Yield Mass of 1000 grains Days before la Days to maturation
 (kg ha-1) (g) anthesis (dap)
 (dap)
 Experiment

 January 2004 3550 3387 25.0 25.0 140 140 159 167

 December 2004 4300 4274 25.0 25.0 144 150 177 179

 February 2005 4042 4005 25.0 25.0 146 153 187 180

 97.663 0 5.323 6.245

 (%) 2.46 0 3.71 3.58

 D 0.98 - 0.66 0.871

 Simulated values and – observed values
 Source: Own elaboration

 Figure 1 shows the behavior of the observed and simulated values on the line (1: 1) and the
 determination coefficient (R2). It can be seen that the models are of good fit since R2> 90 %
 in all cases, which also confirms that the predicted values are very similar to those observed.
Osmel Rodríguez-González, René Florido-Bacallao, Mario Varela-Nualles, Déborah González-Viera, Ramsés Vázquez-Montenegro,
 Lázaro Alberto Maqueira-López y Rogelio Morejón-Rivera

 In general, the model underestimated the average yield obtained and overestimated the
 observed values for days before anthesis and days at maturation. These differences in the
 average estimates of the parameters studied are quite small and support the good statistical
 metrics presented in this study.

 dap: days after planting
 Source: Own elaboration

 Figure 1. Behavior of the observed and simulated values for yield (a), days before anthesis (b) and
 days at maturation (c)
Cultivos Tropicales, 2020, vol. 41, no. 2, e01 abril-junio
ISSN impreso: 0258-5936 Ministerio de Educación Superior. Cuba
ISSN digital: 1819-4087 Instituto Nacional de Ciencias Agrícolas
 http://ediciones.inca.edu.cu

 Therefore, the results of this study suggest that the DSSAT model can be used to calculate
 genetic coefficients with a considerable degree of precision to model the performance of the
 J-104 rice variety, in the dry season, and its physiological components in Cuba.

 Simulation
 Figure 2 shows the performance behavior of the variety J-104 rice for the six nitrogen doses
 used in the simulations. The highest yield value was obtained for the dose of 200 kg ha-1 of
 nitrogen with 6363 kg ha-1, achieving an efficiency of 31.8 kg of rice per kg of nitrogen
 applied. This yield was 1627 kg ha-1 higher than the 150 kg ha-1 nitrogen variant, which
 achieved the lowest yield.
 Therefore, the results of this study suggest that the model DSSAT can be used to calculate
 genetic coefficients with a considerable degree of precision to improve the yield of the J-104
 rice variety, in the little rainy season and its physiological components in Cuba.

 Source: Own elaboration

 Figure 2. Simulated yield for the different nitrogen doses

 Studies carried out show that the nitrogen level influences significantly the agricultural yield
 and its components, since the varieties IACuba28 and J-104 showed the highest response
Osmel Rodríguez-González, René Florido-Bacallao, Mario Varela-Nualles, Déborah González-Viera, Ramsés Vázquez-Montenegro, Lázaro Alberto Maqueira-López y Rogelio Morejón-Rivera with the maximum applied level, 140 and 180 kg ha-1 of nitrogen in the wet and dry campaigns, respectively (22). An optimal dose of 225 kg ha-1 of nitrogen has also been reported when adjusting a quadratic model, varying the doses from 0 to 300 kg ha-1 of nitrogen (6). CONCLUSIONS Obtaining the genetic coefficients of the J-104 rice variety allowed us to establish that the DSSAT model can be used to model the performance of rice and its physiological components under Cuban conditions. The model is able to adequately describe the dependence of the yields with the applied nitrogen level; obtaining the highest yield when using the dose of 200 kg ha-1 of nitrogen. BIBLIOGRAPHY 1. Méndez P. infoarroz.org [Internet]. 2018 [cited 24/03/2020]. Available from: http://www.infoarroz.org/portal/es/index.php 2. Maqueira LA, Roján O, Torres K, Duque D, Torres W. Duración de las fases fenológicas, su influencia en el rendimiento del arroz (Oryza sativa L.). Cultivos Tropicales. 2018;39(1):68–73. 3. FAO. Seguimiento del mercado del arroz de la FAO. Vol. XXI. 2018. 4. Hernández Córdova N, Soto Carreño F, Florido Bacallao R, Plana Llerena R, Caballero Núñez A, Maqueira López LA, et al. Utilización de un modelo de simulación para la predicción del comportamiento de algunos cereales en las condiciones de Cuba. Cultivos Tropicales. 2016;37(1):78–84. 5. ONEI. Capítulo 9: Agricultura, ganadería, silvicultura y pesca. Vol. 37. 2017. 7 p. 6. Guzmán R, Vedia A, Maquera L, Hee Baek E, López A, Vales M. Respuesta del cultivo de Arroz de Secano (Oryza sativa L.) a diferentes niveles de fertilización nitrogenada, Municipio de Yapacani, departamento de Santa Cruz, verano 2015/16. Revista científica de investigación INFO-INIAF. 2016;1(7):54–9. 7. Jones JW, Hoogenboom G, Porter CH, Boote KJ, Batchelor WD, Hunt LA, et al. The DSSAT cropping system model. European journal of agronomy. 2003;18(3–4):235–65. 8. Hernández N, Soto F, Caballero A. Modelos de simulación de cultivos: Características y usos. Cultivos Tropicales. 2009;30(1):00–00.
Cultivos Tropicales, 2020, vol. 41, no. 2, e01 abril-junio
ISSN impreso: 0258-5936 Ministerio de Educación Superior. Cuba
ISSN digital: 1819-4087 Instituto Nacional de Ciencias Agrícolas
 http://ediciones.inca.edu.cu

 9. Choudhury AK, Ishtiaque S, Sen R, Jahan M, Akhter S, Ahmed F, et al. “Calibration and
 Validation of DSSAT Model for Simulating Wheat Yield in Bangladesh.” Haya: The
 Saudi Journal of Life Sciences. 2018;3(4):356–64.
 10. Rodríguez-González O, Florido-Bacallao R, Varela-Nualles M. Aplicaciones de la
 modelación matemática y la simulación de cultivos agrícolas en Cuba. Cultivos
 Tropicales. 2018;39(1):7.
 11. MINAG, IIG, JICA. Instructivo técnico cultivo de arroz, edit. Instituto de Investigaciones
 del Arroz, La Habana. 2001. 82 p.
 12. Hernández A, Pérez J, Bosch D, Castro N. Clasificación de los suelos de Cuba 2015.
 Ediciones INCA: Mayabeque, Cuba, 2015.
 13. Satapathy SS, Swain DK, Herath S. Field experiments and simulation to evaluate rice
 cultivar adaptation to elevated carbon dioxide and temperature in sub-tropical India.
 European Journal of Agronomy. 2014;54:21–33.
 14. Lamsal A, Amgai LP, Giri A. Modeling the sensitivity of CERES-Rice model: An
 experience of Nepal. Agronomy Journal of Nepal. 2013;3:11–22.
 15. Maqueira López LA, Torres de la Nova W, Pérez Mesa SA, Díaz Paez D, Roján Herrera
 O. Influencia de la temperatura ambiental y la fecha de siembra sobre la duración de las
 fases fenológicas en cuatro cultivares de arroz (Oryza sativa L.). Cultivos Tropicales.
 2016;37(1):65–70.
 16. Willmott CJ. Some comments on the evaluation of model performance. Bulletin of the
 American Meteorological Society. 1982;63(11):1309–13.
 17. Ray M, Roul PK, Baliarsingh A. Application of dssat crop simulation model to estimate
 rice yield in Keonjhar district of Odisha (India) under changing climatic conditions. Int.
 J. Curr. Microbiol. App. Sci. 2018;7(4):659–67.
 18. Raes D, Steduto P, Hsiao TC, Fereres E. Chapter 2—Users guide. Reference Manual:
 AquaCrop, Version. 2018;4:1–164.
 19. Instructivo Técnico Cultivo de Arroz [Internet]. 2014 [cited 24/3/2020]. Available from:
 https://isbn.cloud/en/9789597210863/instructivo-tecnico-cultivo-de-arroz/
 20. Singh U, Ritchie JT, Godwin DC. A User’s Guide to CERES Rice, V2. 10. International
 Fertilizer Development Center Muscle Schoals; 1993.
Osmel Rodríguez-González, René Florido-Bacallao, Mario Varela-Nualles, Déborah González-Viera, Ramsés Vázquez-Montenegro,
 Lázaro Alberto Maqueira-López y Rogelio Morejón-Rivera

 21. Timsina J, Singh U, Singh Y, Lansigan FP. Addressing sustainability of rice-wheat
 systems: testing and. In: Proceedings of the International Rice Research Conference.
 1995. p. 17.
 22. Peña LR, Ávila J, Peña R. Efecto de la densidad de siembra y la fertilización nitrogenada
 sobre el rendimiento agrícola y sus componentes de las variedades de arroz IACuba 28
 y J 104. Revista Cubana del Arroz. 2001;3(1):43–50.
You can also read