OrigamiSet1.0: Two New Datasets for Origami Classification and Difficulty Estimation
←
→
Page content transcription
If your browser does not render page correctly, please read the page content below
OrigamiSet1.0: Two New Datasets for Origami
                                                 Classification and Difficulty Estimation
arXiv:2101.05470v1 [cs.CV] 14 Jan 2021

                                              Daniel Ma1 , Gerald Friedland1,2 , and Mario Michael Krell1,2
                                                              1
                                                               University of California, Berkeley
                                                  2
                                                      International Computer Science Institute, Berkeley

                                                                          January 15, 2021

                                                                                Abstract
                                                   Origami is becoming more and more relevant to research. However,
                                               there is no public dataset yet available and there hasn’t been any research
                                               on this topic in machine learning. We constructed an origami dataset
                                               using images from the multimedia commons and other databases. It con-
                                               sists of two subsets: one for classification of origami images and the other
                                               for difficulty estimation. We obtained 16000 images for classification (half
                                               origami, half other objects) and 1509 for difficulty estimation with 3 differ-
                                               ent categories (easy: 764, intermediate: 427, complex: 318). The data can
                                               be downloaded at: https://github.com/multimedia-berkeley/OriSet.
                                               Finally, we provide machine learning baselines.

                                         1     Introduction
                                         Origami is the art of paperfolding. The term arises specifically from the Japanese
                                         tradition, but that tradition has been practiced around the world for several
                                         centuries now [4]. In addition to being a recreational art form, in recent years,
                                         origami has increasingly often been incorporated into the work and research of
                                         mathematicians and engineers.
                                             In the 1970s for example to solve the problem of packing large, flat membrane
                                         structures to be sent into space, Koryo Miura used origami: he developed a
                                         method for collapsing a large flat sheet to a much smaller area so that collapsing
                                         or expanding the sheet would only require pushing or pulling at the opposite
                                         corners of the sheet [13]. Similarly, Robert Lang is using computational origami-
                                         based research to help the Lawrence Livermore National Laboratory to design
                                         a space telescope lens (“Eyeglass”) that can collapse down from 100 meters in
                                         diameter to a size that will fit in a rocket with roughly 4 meters in diameter [7,
                                         11]. In the field of mathematics, Thomas Hull is investigating enumeration of
                                         the valid ways to fold along a crease pattern (i.e., a diagram containing all the

                                                                                     1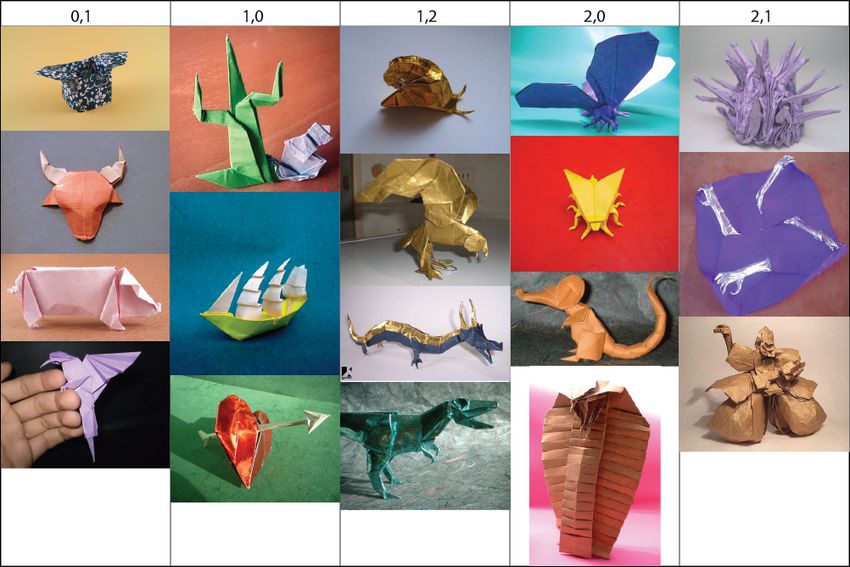
creases needed to create a model) such that it will lie flat. He uses approaches
from coloring in graph theory to solve the problem [6]. In medicine, Kuribayashi
et al. used origami to design a metallic heart stent that can be easily threaded
through an artery before expanding where it needs to be deployed [10].
    In other words, origami is becoming an established part of science. To
support research on origami, we decided to generate a new large origami dataset.
Part of it comes from filtering it out from the multimedia commons [2]. The
multimedia commons comprise information about a dataset of 99 Million images
and 800000 videos that have been uploaded on Flickr under creative commons
license (YFCC100M) [19]. This work is part of a bigger project that creates a
framework around this data to support multimedia big data field studies [9].
    Datasets are crucial for new developments and major progress in machine
learning. In particular, datasets of images have allowed researchers to make
significant advances in the field of computer vision. For example, ImageNet
[3], a dataset of millions of images and corresponding noun labels, has been a
useful resource in creating and benchmarking large-scale algorithms for image
classification. The German Traffic Sign Detection Benchmark Dataset [5] has
a practical use for self-driving vehicles to detect traffic signs in order for them
to act appropriately. The MNIST database [12], a vast database of handwrit-
ten numeric digits, has been used for training and testing various classification
techniques on image recognition.
    Here, we introduce two new datasets which we collectively call OrigamiSet1.0.
The two datasets together consist of more than 15, 000 images. In this paper,
we first describe the properties of the datasets themselves in Section 2. Next, we
provide baseline evaluations for distinguishing images of origami from images
that contain no origami (Section 3.1) as well as image-based difficulty estimation
of origami models (Section 3.2). We conclude in Section 4.

2     OrigamiSet1.0
First, we describe the dataset to distinguish origami images from normal images
and then we introduce the dataset for difficulty estimation. The data can be
downloaded at: https://github.com/multimedia-berkeley/OriSet.

2.1    Origami Image Classification
This dataset consists of 8, 011 images containing origami and 7, 976 images that
do not contain origami. The majority of the origami images were scraped from
two major origami databases: Oriwiki [14] and GiladOrigami [1]. Before scrap-
ing both websites for images, we contacted the administrators of both databases,
asking for permission to scrape the images. The Oriwiki administrators are un-
reachable, but Gilad Aharoni gave us permission to use his images in our dataset
(Gallery only).

                                        2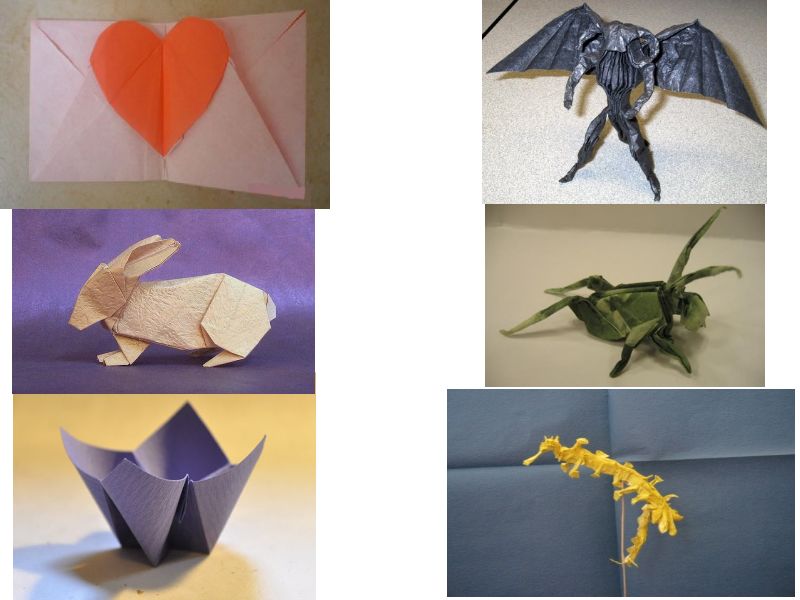
2.1.1 Scraping procedure
To scrape the images from Oriwiki, we found that each model’s page was as-
signed a Model ID number included in the URL of the page, so we wrote a
Python script that iterated through every Model ID number between 0 and
99, 999, retrieving the image from the corresponding model’s page. Afterwards,
we noticed that a significant portion of the retrieved images were placeholder
images. So we removed those, which resulted in 3, 934 images from Oriwiki. As
for GiladOrigami, unlike Oriwiki, each model image did not have its own page
or model ID number. Instead, we went through the gallery section of the site
and scraped all the origami images from each page in the gallery by hand. We
note that the gallery does not contain all of the images of the site, but scraping
from GiladOrigami has produced 2, 140 images of origami.
The remainder of the origami images were taken from the YFCC100M data
browser [8]. Starting with the search term origami resulted in over 13, 000
images, but more than 30% of the images did not contain origami. Due to a
tag cloud visualization, we used papiroflexia and origamiforum as search terms
which generated a more reliable, albeit smaller set of results. After some minor
hand-cleaning, which involved removing non-origami images as well as images
containing people, we obtained 1, 937 origami images.
2.1.2 Data properties and non-origami class creation
In this section, the properties of the origami images in our dataset are described.
In our diverse set, each of the models itself is the main focus of the image. For
example, all of these images do not contain humans or human body parts.
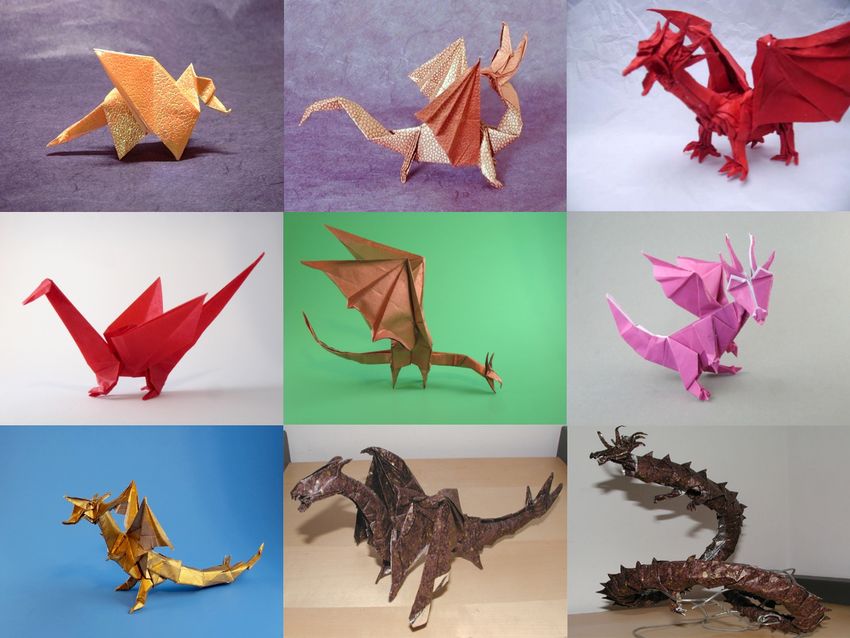
Furthermore, there is generally only one model in the center of the image. In
addition, there were many images of models that were meant to represent the
same topic. For example, there were multiple instances of dragons; some were
very simplistic, while others incorporated much more details in the wings, head,
and appendages of the model (see Figure 1).
To explore the diversity of the dataset as well as its relation to the ImageNet
dataset, we applied a VGG16 neural network [17] to the YFCC100M origami
images that was trained on ImageNet with 1000 common classes. ImageNet
does not include the class origami.
We found that the top-1 predictions were spread among 263 different classes,
while the top-5 predictions were spread among 529 classes. The most common
classes that appeared are shown in Table 1. As one can tell, our origami images
were very often classified as items that are similar to paper-folding and origami
(such as envelope or handkerchief ) as well as things that involve paper (such as
paper towel or carton). In some cases, some images were classified as objects
that an origami model was meant to represent such as flowers, candles, or bugs.
With these labels in mind, we generated a non-origami class by using the
ILSVRC2011 validation data [16]. For each label, excluding pinwheel, envelope,
carton, paper towel, packet, and handkerchief, we gathered the first 8 examples,
producing 7976 non-origami images.
3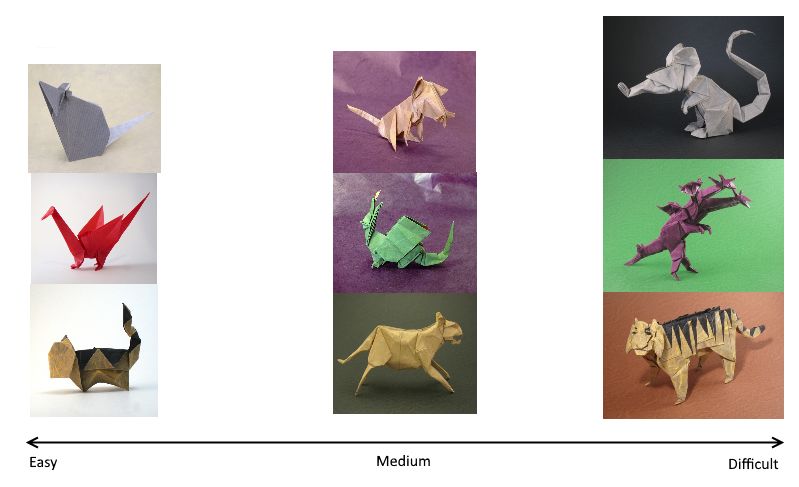
Figure 1: For some model topics, (such as dragons, Santa Claus, pandas, etc.),
there are multiple models that were meant to represent the same topic. This
example contains 9 different dragon models [1, 14].

2.2    Difficulty Estimation
To the best of our knowledge, there is no single useful standard for defining
the difficulty of an origami model. Some heuristics to estimate the difficulty of
folding a model include the number of creases involved or the number of steps
included in the diagrams in the model. However, such data is not easily avail-
able for a large number of models and collecting such data might be infeasible.
Instead, we estimate difficulty based on the appearance of the model.
    At first, we used difficulty levels that were assigned to the origami images
that we scraped from the Oriwiki database [14]. These difficulty levels were
assigned by the uploading user. Each difficulty label was a value between 1
and 5, where 1 represents low difficulty and 5 represents high difficulty. Again,
we used the VGG16 features. However this time, we trained an algorithm to
predict the difficulty of an origami model. However, training a classifier could
not produce any useful result (see Section 3.2). A likely reason for the low
performance is that the labeling of difficulties by users is inconsistent or even
wrong. This can be seen in Figure 2 where the images show a clear discrepancy
between the difficulty label and the perceived difficulty. Thus, we provide our
own difficulty labels.
    We picked a subset of 1509 images of origami from the set of images used for
origami image classification, hand-assigning each image a difficulty of 0 (easy),
1 (intermediate), or 2 (complex). In the end, there were 764 easy images,
427 intermediate images and 318 complex images. Several assumptions and

                                       4
Top-1 Top-5
name n name n
pinwheel 243 envelope 788
envelope 243 pinwheel 518
carton 117 carton 499
paper towel 76 packet 328
honeycomb 71 handkerchief 314
lampshade 41 paper towel 302
rubber eraser 39 rubber eraser 238
handkerchief 37 candle 218
pencil sharpener 35 lampshade 192
shower cap 34 wall clock 168
Table 1: Top-i predictions for our extracted YFCC100M subset (n = number
of occurrences).
guidelines were followed in labeling the difficulty of the models in these images.
In particular, each image was assigned a difficulty based on the assumption
that the model in the image was made from a single sheet of paper. Images
containing modular models (i.e., models made from multiple pieces of paper)
and tessellations (i.e., models with repeating patterns), as complex as they
appear, usually involve folding an easy sequence of folds repetitively. Table 2
contains general guidelines that were used for assigning a difficulty to each model
and Figure 3 provides some examples.
Easy (0) - Contains very little detail
- Appears very “flat”, i.e. has very few layers of paper
- Appearance may consist of a collection of simple geometric shapes
- Has very few appendages, most of which are wide
- Boxes and airplanes in most cases fall under this difficulty
Intermediate (1) - Moderate amount of detail
- Moderate number of appendages that are somewhat narrow
- Inclusion of toes or fingers to appendages
- Contain two objects in a single model, although one object
may be significantly smaller than the other (e.g. man with violin)
- Some shaping to add curves and a 3D appearance to the model
Complex (2) - Highly detailed
- Large number of appendages
- High resemblance to the subject the model is supposed to represent
- Contains several objects in a single model
- If a model contains only two objects, the two objects are about
the same size
- Significant amount of shaping
- Insects tend to fall in this category, especially if the models have
long, narrow appendages
Table 2: Guidelines for assigning difficulty levels (see also Figure 3).
5Figure 2: Examples of wrong difficulty assignment in the Oriwiki database [14].
On the left are images of models that are ranked as very difficult when they
appear to actually be easy or intermediate models. On the right are images of
models that are rated as very easy when they actually appear to be complex.
One concern regarding our difficulty estimation is that in the process of
hand-labeling difficulty, some models are actually more difficult or easier than
they appear. For example, a model with many appendages will be classified as
difficult according to our heuristic, but the actual difficulty of the model may
be intermediate instead. Here, future contributions to the dataset are welcome
to provide corrections or new variants. Note, however, that visual judgement
of the difficulty cannot be as accurate as a real estimated related to the folding
procedure.
3 Machine Learning Evaluation
Apart from the creation of the datasets, we also want to present and explore
two machine learning challenges on this data to encourage data analysis and
algorithm development for this kind of data. It is meant to be seen as a first
baseline and to quantify the challenges.
3.1 Origami Classification
In the first setting, we want to distinguish origami from non-origami images.
6Figure 3: Examples of images from the GiladOrigami database [1] classified as
easy, medium, and difficult (see also Table 2) from three different topics: tiger,
dragon, and rat.
3.1.1 General Processing Setup
For generating features of all our images we used the VGG16 neural network
model implemented in MXNet. In particular, each image’s features were gener-
ated by taking the output right before the last layer of the model. In addition, a
list of labels was created to denote whether the resulting feature vector belongs
to an origami image (1) or to a non-origami image (-1). With these features
and labels, we evaluated multiple classifier models using Scikit-learn’s [15] 5-fold
cross-validation function.
3.1.2 Classifier Comparison Results
We compared multiple kernels of SVC models as well as the logistic regression
model provided by scikit-learn [15], all on default settings. Table 3 shows the
accuracy scores for each model.
3.1.3 Discussion
We note that a majority of the classifiers’ accuracy scores are actually quite
close, so it is difficult to say which classifier has the best performance. However,
the results indicate that a good classification is possible with our data and that
with further tuning, scores around 99% should be possible.
7Table 3: Origami classification estimation: 5-fold cross-validation scores for
different models on default settings
Classifier Accuracy Score
SVC: Linear Kernel 0.9674 ± 0.0049
SVC: RBF Kernel 0.9705 ± 0.0051
SVC: Poly Kernel 0.9746 ± 0.0063
SVC: Sigmoid Kernel 0.9215 ± 0.0128
Logistic Regression 0.9707 ± 0.0071
3.2 Origami Difficulty Estimation
Similar to the Origami Image Classification setup, we again used the output
vector right before the last layer of the VGG-16 neural network as the feature
for each image. As before, we looked at how well several models on default
settings could predict the difficulty based on the values provided by the users
of the Oriwiki [14] database. We performed a 5-fold cross-validation on the
same classifiers that we used earlier in Section 3.1, but produced R2 scores as
well as balanced accuracy scores to account for the fact that the images are not
distributed very evenly across the different difficulty labels [18].
Table 4: Difficulty Estimation: 5-fold CV Scores of Different Models using
Oriwiki Labels
Classifier Balanced Accuracy Score R2 Score
SVC: Linear Kernel 0.2775 ± 0.0220 −0.5751 ± 0.0842
SVC: RBF Kernel 0.4488 ± 0.0451 −0.5383 ± 0.1282
SVC: Poly Kernel 0.3202 ± 0.0170 −0.4513 ± 0.1022
SVC: Sigmoid Kernel 0.2931 ± 0.0470 −0.737 ± 0.0832
Logistic Regression 0.3034 ± 0.0233 −0.4958 ± 0.0879
Table 4 clearly shows that useful difficulty estimation is not possible with
the labels from the Oriwiki database. For this reason, we decided to label a
subset of the origami images by hand (see Section 2.2). With these labels, we
again fit the data to several models on default settings and got significantly
better accuracy and R2 scores (see Table 5).
Table 5: Difficulty Estimation: 5-fold CV Scores of Different Models using our
Labels
Classifier Balanced Accuracy Score R2 Score
SVC: Linear Kernel 0.7581 ± 0.0151 0.5631 ± 0.0716
SVC: RBF Kernel 0.7826 ± 0.0217 0.6293 ± 0.1323
SVC: Poly Kernel 0.7854 ± 0.0172 0.6158 ± 0.0948
SVC: Sigmoid Kernel 0.7223 ± 0.0281 0.5822 ± 0.1516
Logistic Regression 0.7625 ± 0.0101 0.5738 ± 0.0789
83.2.1 Evaluation setup
To further improve on this classifier, we decided to tune the kernel and C hyper-
parameters of the SVC. Hence, we used the GridSearchCV class of the scikit-
learn package to find the hyperparameters that provided the highest score. We
passed in all the possible default kernels of the SVC as well as powers of 10
ranging from 10−4 to 10 for the C hyperparameter as arguments to iterate over
to find the parameter that provides the highest 5-fold cross-validation balanced
accuracy score.
3.2.2 Results
We found that an SVC with a polynomial kernel with C = 0.1 provided the
highest possible score, giving us a balanced accuracy of 0.7913 ± 0.0219. Fig-
ure 4 shows several of the images that were classified incorrectly using these
parameters for the SVC.
Figure 4: A collection of images that were wrongly classified. The first number in
each column represents the labeled difficulty, while the second number represents
the predicted difficulty.
3.2.3 Discussion
Keeping in mind, that difficulty estimation is a challenging task and that guess-
ing would result in a balanced accuracy of 0.3333, our results show that a
difficulty estimation with machine learning and our three difficulty levels is in
general possible.
94 Conclusion
In this paper, we introduced OrigamiSet1.0, which provides images for the
origami classification as well as difficulty estimation. Our empirical results show
that our data can be successfully used for these two machine learning challenges.
Future challenges are to estimate the number of folds that a model con-
tains as well as to classify what an origami model is supposed to represent.
Furthermore, the existing approaches can be improved in performance. For ex-
ample, randomizing background, lighting, and paper texture (if possible) can
be helpful augmentation techniques on the training data and also more tailored
classification algorithms can improve performance. However, this requires an
extension of the dataset in size as well as information content. We hope this
paper encourages the interested reader to contribute more data.
Acknowledgments
This work was supported by a fellowship from the FITweltweit program of the
German Academic Exchange Service (DAAD), by the Undergraduate Research
Apprenticeship Program (URAP) at University of California, Berkeley, and
by grants from the U.S. National Science Foundation (1251276 and 1629990).
(Findings and conclusions are those of the authors, and do not necessarily rep-
resent the views of the funders.)
References
[1] G. Aharoni, 2017. http://www.giladorigami.com/.
[2] J. Bernd, D. Borth, C. Carrano, J. Choi, B. Elizalde, G. Friedland, L. Got-
tlieb, K. Ni, R. Pearce, D. Poland, K. Ashraf, D. A. Shamma, and
B. Thomee. Kickstarting the Commons: The YFCC100M and the YLI
corpora. In Proceedings of the 2015 Workshop on Community-Organized
Multimodal Mining: Opportunities for Novel Solutions (MMCommons ’15),
pages 1–6. ACM, 2015.
[3] J. Deng, W. Dong, R. Socher, L.-J. Li, K. Li, and L. Fei-Fei. Imagenet:
A large-scale hierarchical image database. In Computer Vision and Pat-
tern Recognition, 2009. CVPR 2009. IEEE Conference on, pages 248–255.
IEEE, 2009.
[4] K. Hatori. History of origami in the east and the west before interfusion.
In Fifth International Meeting of Origami Science, Mathematics, and Ed-
ucation (Origami 5), pages 3–11. A K Peters/CRC Press, Jun 2011. 0.
[5] S. Houben, J. Stallkamp, J. Salmen, M. Schlipsing, and C. Igel. Detec-
tion of traffic signs in real-world images: The german traffic sign detection
benchmark. In Neural Networks (IJCNN), The 2013 International Joint
Conference on, pages 1–8. IEEE, 2013.
10[6] T. C. Hull. Coloring connections with counting mountain-valley assign-
ments. Origami6 : I. Mathematics, page 3, 2015.
[7] R. A. Hyde, S. N. Dixit, A. H. Weisberg, and M. C. Rushford. Eyeglass:
a very large aperture diffractive space telescope. In H. A. MacEwen, edi-
tor, SPIE 4849, Highly Innovative Space Telescope Concepts, 28, page 28.
International Society for Optics and Photonics, Dec 2002.
[8] S. Kalkowski, C. Schulze, A. Dengel, and D. Borth. Real-time analysis
and visualization of the YFCC100m dataset. In Proceedings of the 2015
Workshop on Community-Organized Multimodal Mining: Opportunities for
Novel Solutions (MMCommons ’15), pages 25–30. ACM, 2015.
[9] M. M. Krell, J. Bernd, D. Ma, J. Choi, D. Borth, and D. Friedland. Field
studies with multimedia big data: Opportunities and challenges, 2017. sub-
mitted.
[10] K. Kuribayashi, K. Tsuchiya, Z. You, D. Tomus, M. Umemoto, T. Ito, and
M. Sasaki. Self-deployable origami stent grafts as a biomedical application
of Ni-rich TiNi shape memory alloy foil. Materials Science and Engineering:
A, 419(1–2):131–137, Mar 2006.
[11] R. J. Lang. From flapping birds to space telescopes: The modern science
of origami. In 6th Symposium on Non-Photorealistic Animation and Ren-
dering (NPAR), page 7, 2008.
[12] Y. LeCun, C. Cortes, and C. J. Burges. Mnist handwritten digit database.
AT&T Labs [Online]. Available: http://yann. lecun. com/exdb/mnist, 2,
2010.
[13] K. Miura. Map fold a la Miura style, its physical characteristics and appli-
cation to the space science. Research of Pattern Formation, pages 77–90,
1994.
[14] Oriwiki origami database, 2017. http://www.oriwiki.com/.
[15] F. Pedregosa, G. Varoquaux, A. Gramfort, V. Michel, B. Thirion, O. Grisel,
M. Blondel, P. Prettenhofer, R. Weiss, V. Dubourg, J. Vanderplas, A. Pas-
sos, D. Cournapeau, M. Brucher, M. Perrot, and E. Duchesnay. Scikit-
learn: Machine learning in Python. Journal of Machine Learning Research,
12:2825–2830, 2011.
[16] O. Russakovsky, J. Deng, H. Su, J. Krause, S. Satheesh, S. Ma, Z. Huang,
A. Karpathy, A. Khosla, M. Bernstein, A. C. Berg, and L. Fei-Fei. ImageNet
Large Scale Visual Recognition Challenge, Sep 2014.
[17] K. Simonyan and A. Zisserman. Very deep convolutional networks for
large-scale image recognition. In International Conference on Learning
Representations (ICLR 2015), Sep 2015.
11[18] S. Straube and M. M. Krell. How to evaluate an agent’s behaviour to in-
frequent events? – Reliable performance estimation insensitive to class dis-
tribution. Frontiers in Computational Neuroscience, 8(43):1–6, Jan 2014.
[19] B. Thomee, B. Elizalde, D. A. Shamma, K. Ni, G. Friedland, D. Poland,
D. Borth, and L.-J. Li. YFCC100M: The new data in multimedia research.
Communications of the ACM, 59(2):64–73, Jan 2016.
12You can also read