ASSESSING VULNERABILITIES AND COSTS OF POWER OUTAGES TO EXTREME FLOODS IN SURIGAO CITY, PHILIPPINES
←
→
Page content transcription
If your browser does not render page correctly, please read the page content below
International Journal of GEOMATE, June., 2021, Vol.20, Issue 82, pp.7-14
  ISSN: 2186-2982 (P), 2186-2990 (O), Japan, DOI: https://doi.org/10.21660/2021.82.6308
  Geotechnique, Construction Materials and Environment

          ASSESSING VULNERABILITIES AND COSTS OF POWER
           OUTAGES TO EXTREME FLOODS IN SURIGAO CITY,
                          PHILIPPINES

            *Lessandro Estelito Garciano1, Renan Ma. Tanhueco1, Aujhen Torres2 and Hiroshi Iguchi2
           1
               Faculty, De La Salle University, Philippines; 2Student, De La Salle University, Philippines;

       *Corresponding Author, Received: 26 Dec. 2020, Revised: 02 Feb. 2021, Accepted: 23 Feb. 2021

ABSTRACT: Surigao city is a coastal community located in the north eastern part of the county. It is
vulnerable to rain-induced floods and storm surges. Although direct flood damage to electrical infrastructure
is rare, power outages are applied to prevent electrocution in communities. In this regard, the authors
investigated several local districts in Surigao city to observe the vulnerability of households to power outages
caused by flood events. This information will help the local network operator, Surigao del Norte Electric
Cooperative (SURNECO), reduce power interruption and inconvenience. This study simulates flood events of
5,10,25 and 50-year 24-hour rainfall-flood event against a backdrop of an electrical distribution network and
geotagged households in four urban coastal barangays. Results show that the estimated power loss for two (2)
days is about US$ 8000 per day of outage. The depth and velocity (d-v) product also shows that about 22% of
the households are affected specifically for a 50-year 24-hour rainfall-flood event. The cost model based on a
two-day power loss duration analysis shows that the loss range is from US$7,781 to US$8,676 for the different
return periods. The household survey also shows that the average inconvenience loss is about US$ 11/hour.

Keywords: Extreme flood, Power outage, Resilient community, D-v product

1. INTRODUCTION                                                                   Most of the fragility curves focus on structures;
                                                                              however, this study takes on a household-centric
     Many countries in the world experience extreme                           approach. Instead of focusing on lifeline structure,
flood inundations. Severe storms or typhoons                                  the authors propose to look at the vulnerability of
generally bring heavy precipitation after making                              the households to different flood depths leading to
landfall. During extreme flooding, unfortunate                                power outage. To illustrate the framework, the
situations happen such as loss of power, loss of                              approach is applied to a small city in the Philippines.
functionality of lifelines, loss of medical services                          Flood modeling and simulation are used with
and often lead to deaths [1– 4]. The Philippines is                           geographic information system (GIS), and showed
no stranger to this phenomenon. Every year, about                             the vulnerability of the households to different flood
20 to 30 typhoons enter the Philippine Area of                                heights, the corresponding monetary risk to the
Responsibility (PAR). After making landfall, these                            power producer and the inconvenience loss to the
typhoons bring about heavy downpour and flooding                              households.
over a wide area. In November 2020 Typhoon
Ulysses (International name: Vamco) made landfall                             2. METHODOLOGY
in the Philippines causing widespread power outage
[5]. Raging flood waters (function of velocity and                            2.1 The Approach
depth) also pose a risk to households and livelihood
[6].                                                                              The research focuses on quantifying power
     Electric power lifelines are indispensable                               outage losses based on decisions by service
systems in modern society. If this critical lifeline is                       provider to ensure life safety during extreme
damaged and becomes unavailable due to an                                     flooding. In this paper we consider flood hazard
extreme event, the power provider incurs losses,                              characteristics such as extreme depths and the d-v
and end-use consumers are inconvenienced, and                                 (depth-velocity) product and its effects on
their activities are restricted. With the current trend                       households. The approach to loss estimation
to improve power reliability and resilience, power                            involves three parts, namely: a) development of
utility providers adapt measures to reduce outage                             vulnerability curves for power loss due to extreme
and consequently money loss. This is good for the                             flooding of the power supplier, b) possible
supply side. On the demand side, end-use                                      household damage due to the depth-velocity (d-v)
consumers, can be at risk and be faced with                                   product [7] and c) the estimated inconvenience loss
considerable burden from power outage because of                              of the households due to the power outage. Flood
their geographic location.                                                    hazard vulnerability was quantified using the flood

                                                                        7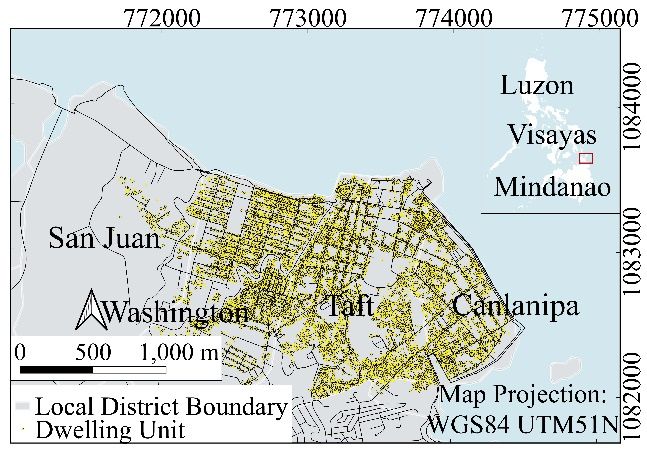
International Journal of GEOMATE, June., 2021, Vol.20, Issue 82, pp.7-14

depth and velocity combinations (d-v product). Use          Table 1 Average monthly rainfall in Surigao City
of this product is useful to index vulnerability of                 (Source: weather-atlas.com)
community and its assets. Thresholds had been
identified for indicating a) stability of people to          Month     Monthly         Month        Monthly
walk [8] or drive [9] through a flood; b) potential                    Average                      Average
damage to structures [10] and as c) constraints for
                                                                      Rainfall (in                  Rainfall
land use planning. Ranges of products d-v < 2.0
                                                                         mm)                        (in mm)
unsafe for people and vehicles, d-v < 4.0 generally
makes it unsafe for people and vehicles, and                 January     582.3          July          137.8
buildings vulnerable to structural damage.                   February    389.2        August          113.3
Increasing d-v > 4.0, generally indicates unsafe              March      283.5       September        122.4
conditions for vehicles, people and all buildings are         April      196.3        October         216.0
considered vulnerable to failure [11]. Figure 1                May       123.5       November         378.3
presents the framework of this research.                       June      114.2       December         429.4

                                                            2.3 Flood Modelling and Simulation

                                                                The two-dimensional flood inundation model
                                                            was developed using HEC-.HMS 4.3 [18] for the
                                                            flow model and the HEC-RAS 5.0 [19] for the
                                                            inundation model. These models are based on ease
                                                            of developing the 2-D model with a digital terrain
                                                            model (DTM) of ten (10) meter grid resolution. The
                                                            channel cross sections and alignments were derived
                                                            from river bathymetry in 2011 and validated in
                                                            2018. Tide elevations were used for the outflow
                                                            boundary condition. Flood canals and storm
                                                            drainage were not integrated into the model due to
                                                            lack of surveys on the sewers.

Fig. 1 The framework of the research

2.2 The Study Area

    The study area is Surigao City (9°41’16” N,
125°29’30” E), the capital city of Surigao del Norte
in the Philippines. The city falls under the Type II
climate (with four main climate regimes) [23] thus
has a pronounced maximum rainfall starting in
November to January. Table 1 shows the average
monthly rainfall in Surigao City. Based on the table,
January has the highest rainfall (wettest), and
August is the driest month (lowest rainfall).               Fig. 2 Surigao city urban areas. The yellow dots are
    The study areas of the research cover the urban                 the consumers.
barangays of San Juan, Washington, Taft and
Canlanipa, and shown in Fig. 2. As of August 1,                 Four flood models, each representing a
2015, the population of these four barangays                hypothetical rainfall flood event were constructed
reached 62,093 [16]. The light-yellow dots in this          and shown in Table 2. Hyetographs for 5, 10, 25 and
figure are the 14,387 consumers in the urban                50-year design rainfall return periods were based on
barangays and gathered through a geo-tagging                the Rainfall Intensity Duration Frequency (RIDF)
survey of households connected to the electrical            tables obtained from PAGASA weather station
power system managed by SURNECO (Surigao                    located in Surigao City [16]. The alternating block
Del Norte Electric Cooperative). which is the local         method [17] was applied on the RIDF data to
electric power provider. At present, it supplies            produce the hypothetical 24-hour distribution
power to 57,728 households and has an annual peak           rainfall with the maximum intensity occurring on
load demand of 25 MW [17].                                  the 12th hour (i.e. middle peak).

                                                        8
International Journal of GEOMATE, June., 2021, Vol.20, Issue 82, pp.7-14
Table 2 Rainfall totals with Return Period The lower bound of the flood depth range was
(Source: PAGASA, 2017) set at 0.5m to consider a typical height of the power
outlet from the ground floor elevation of a dwelling
Return Period (yrs) Rainfall Depth (mm) unit. Using GIS tools, depth values from the flood
5 308.9 map were extracted and assigned to each dwelling
10 377.8 unit and were further categorized using the flood
25 464.9 depth hazard ranges. A plot of the water depth d (x-
50 529.5 axis) against the number of households (y-axis) over
the flooding period and the total number affected
Flood simulation provided information on flood based on the highest flood depth on grid (10m) was
characteristics in terms of water depth (d-[m]), flow used to develop the vulnerability curve.
velocity (v-[m/s]) and inundation time (t) under
depth d > 0.5m. Based on simulation runs, the 2.4.2 Risk curve for power for power producers
period of flooding for the different rainfall events A risk curve for the [temporary] power outage
was about 48 hours. The hazard for a consumer was derived from the following parameters: (a) the
(here defined as equivalent to one household in one number of affected households for each MRI; and
dwelling unit [DU]) was based on its location in the (b) average residential electricity rate in Peso (or
inundated area. This study uses the flood depth (d ≥ US$) per kWh. Their product results in the power
0.5m) and the product of flood depth and velocity loss in peso (or US$) in one hour. The risk curve is
(d-v) as indicators of threats to life safety and then a plot of the power loss on the x-axis against
building vulnerability to failure. The water depth is the inverse of the MRI on the y-axis.
measured by the difference between the flood
elevation and the dwelling units’ (DU) ground floor 2.5 Damage Possibility Based on d-v Value
elevation. Here, a DU’s ground floor elevation was
taken to be same as the ground elevation. These To develop the safety and damage possibility
were estimated using the digital terrain model table, categories using the criterion of Smith et al
values and were assumed accurate to within ± 0.2m. [10] and a distribution of d-v values over the
Elevation transects, taken in 2011 were also used to inundated areas were categorized and interpreted as
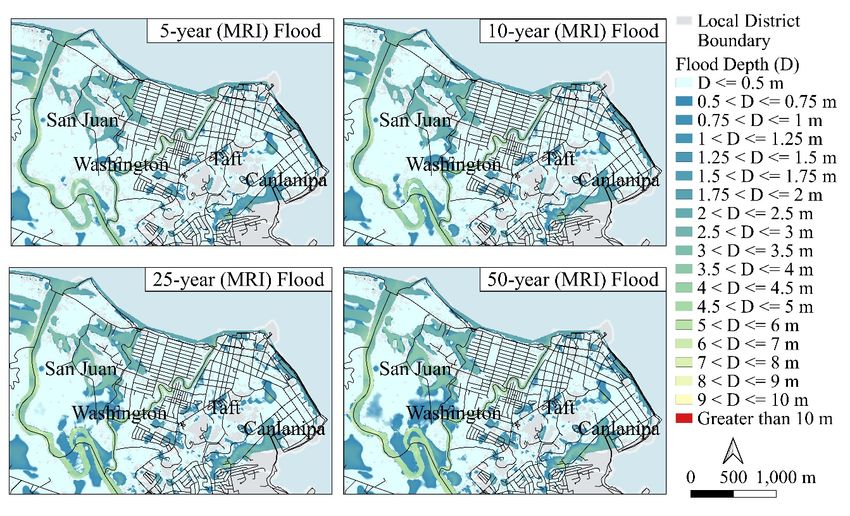
check precision of the DTM elevation. Figure 3 follows:
shows the extent and depth distribution of the flood
depths for the different return periods. • d-v < 2 m2/s means unsafe for people and
vehicles;
2.4 Vulnerability and Risk Curves
• 2m2/s ≤ d-v < 4 m2/s means unsafe for vehicles
2.4.1 Power loss vulnerability curves for and people, and buildings that are less robust are
households vulnerable to failure;
To develop the vulnerability curves for power
loss, three flood depth hazard ranges were • d-v ≥ 4 m2/s means unsafe for vehicles and
people, and all building types are considered
considered, and the corresponding number of
vulnerable to failure.
consumers affected were counted for each range:
• 0.5 ≤ d < 1.5 m 2.6 Inconvenience Loss Due to Power Outage
• 1.5 ≤ d < 3.0 m A survey was conducted to estimate the
monetary equivalence of the inconvenience
• d > 3.0 m experienced by a household during a power outage.
Table 3 Flood affected consumers (d ≥ 0.5m)
Consumers not affected Consumers affected
5-yr 10-yr 25-yr 50-yr 5-yr 10-yr 25-yr 50-yr
Barangays MRI MRI MRI MRI MRI MRI MRI MRI
Canlanipa 2,366 2,346 2,298 2,282 719 739 787 803
San Juan 193 192 192 192 47 48 48 48
Taft 6,189 6,178 6,135 6,098 428 439 482 519
Washington 4,110 4,110 4,110 4,110 335 335 335 335
12,858 12,826 12,735 12,682 1,529 1,561 1,652 1,705
9International Journal of GEOMATE, June., 2021, Vol.20, Issue 82, pp.7-14
Fig. 3 Depth distribution under different return period floods
800 800
Canlanipa
600 600 Taft
No. of consumers affected
No. of consumers affected
Taft
Canlanipa
400 400
San Juan
200 200
San Juan
Washington Washington
0 0
0 10 20 30 40 50 0 10 20 30 40 50
Total no. of hours of rainfall (5-year MRI) Total Hours of Rainfall (10-year MRI)
Canlanipa Canlanipa
800 800
No. of consumers affected
600 600 Taft
Taft
No. of consumers affected
400 400
200 San Juan 200
San Juan
Washington Washington
0 0
0 10 20 30 40 50 0 10 20 30 40 50
Total Hours of Rainfall (25-year MRI) Total Hours of Rainfall (50-year MRI)
Fig 4. Hourly number of households affected for flood depths of different MRIs (in 48 hours)
10International Journal of GEOMATE, June., 2021, Vol.20, Issue 82, pp.7-14
A total of 1.021 households were surveyed, and Table 4 provides a summary of the potential
respondents were asked to affirm the power losses revenue loss for each hypothetical flood events.
during flood events, list the inconveniences it Figure 6 gives the risk curve. Annual expected
brought to them and rate each item (1 is least revenue loss based on the three probabilities is
important and 4 is most important) listed according US$ 1,447.5.
to importance to address the concern. Finally,
respondents gave estimated costs of the Table 4 Potential Revenue Loss during Flooding
inconvenience (in pesos) based on their responses
in a one-hour power outage.
Power Power
Return Consumers
Loss Loss
3. RESULTS AND DISCUSSION Period affected
(PhP) (US$)*
5 1,529 389,027 7,781
3.1 Flood Simulated Results
10 1,561 397,169 7,943
25 1,652 420,322 8,406
The results of the flood modelling are extreme
50 1,705 433,807 8,676
flood heights with the following mean recurrence
*Exchange rate = 50 PhP/ US dollar
intervals (MRIs): 5, 10, 25 and 50 years. Table 3
presents the flood affected consumers under d ≥
0.5m. It shows that barangays Taft, Canlanipa and
Washington have the greatest number of consumers
affected by flooding. Furthermore, the count under
a five-year rainfall- flood event practically
identifies the affected consumers. Figure 4 shows
the hourly distribution of affected consumers under
different MRIs. The number of affected persons
peak during the 20th hour of the simulated flooding.
An initial estimate of the length of time of power
outage is 48 hours (2-days) based on the period of
flood event with depth d ≥ 0.5m.
3.2 Vulnerability Curve for Power Loss
Fig. 6 Risk curve for power loss due to flooding
A plot of the percentage of consumers affected
with the three ranges is shown in Figure 5 and Based on the results, flood events under the 5-
represents the depth-based vulnerability curves for year MRI in Surigao city already gives an indication
power loss. A summary of the total number of of the number of consumers affected and an
consumers affected is shown again in Table 4. If a estimate of cost of outage. An increase in number of
household consumes an average of 12 kWh/day consumers affected appear to be gradual with an
[22] and the average household electricity rate is increase in flood magnitude.
PhP 10.60 / kwh, then the estimated power loss for
two (2) days is roughly 0.2 million pesos each day 3.3 Vulnerability of Households
of outage.
The result of the flood simulations generated
information that included the product of the water
depth and velocity for different return periods. With
this, the damage that can be incurred due to flood
for all MRIs can be estimated using the categories
from the adjusted Clausen criterion.
Table 5 gives a distribution of affected
households under the different d-v ranges. More
than 90% of the households in the local districts of.
Canlanipa, Washington, and Taft fall under d-v < 2
m2/s and generally makes it “unsafe for people and
vehicles” for all MRIs. While structures may be of
lesser concern, life safety becomes the primary
concern.
Fig. 5. Vulnerability curves for power loss
11International Journal of GEOMATE, June., 2021, Vol.20, Issue 82, pp.7-14
Table 5 d-v distribution of households
Bgy. Canlanipa Bgy. San Juan
5-yr 10-yr 25-yr 50-yr 5-yr 10-yr 25-yr 50-yr
d-v ranges MRI MRI MRI MRI MRI MRI MRI MRI
d-vInternational Journal of GEOMATE, June., 2021, Vol.20, Issue 82, pp.7-14
household was done on a macro level. To further P10/S2/020, prepared by the Water Research
improve the output, the authors suggest conducting Laboratory, University of New South Wales,
a micro-level assessment of each household Sydney, 2011.
considering other parameters such as typology, wall [10] Smith, G. P., Davey, E. K. and Cox, R. J., Flood
type, household flood defense, among others. hazard, Technical report 2014/07, Water
Research Laboratory, University of New South
REFERENCES Wales, Sydney, 2014.
[11] Smith, G. P. and Wasko, C. D., Australian
[1] Amoguis M. T., Power underwhelming: Why Rainfall and Runoff Revision Project 15: Two-
are there power outages, Business World dimensional simulations in urban areas -
(2019). https://www.bworldonline.com/power- representation of buildings in 2D numerical
underwhelming-why-are-there-power-outages/ flood models, prepared by the Water Research
(accessed June 15, 2020). Laboratory, University of New South Wales,
[2] Bella T. and Epstein K., Torrential rain in Sydney, 2012.
Houston leaves roads flooded and schools [12] Australian Disaster Resilience Handbook 7
closed. The Washington Post (May 2019). Managing the Floodplain: A Guide to Best
https://www.washingtonpost.com/nation/2019 Practice in Flood Risk Management in
/05/10/really-genuinely-scary-torrential-rain- Australia (AIDR 2017), pp. 31 – 34, 2017.
houston-strands-cars-leaves-thousands- [13] Australian Disaster Resilience Guideline 7-3
without-power/ (accessed July 4, 2020). Flood Hazard (AIDR 2017), pp. 10 – 14, 2017.
[3] Johnston, E. In flood-hit area of Okayama, [14] Costabile, P., Costanzao, C., De Lorenzo, G.
residents shocked by scale of destruction. The and Macchione, F, Is local flood hazard
Japan Times (July 2018). assessment in urban areas significantly
https://www.japantimes.co.jp/news/2018/07/1 influenced by the physical complexity of the
0/national/flood-hit-area-okayama-residents- hydrodynamic inundation model? Journal of
shocked-scale-destruction-say-recovery-take- Hydrology 580, pp. 124231, 2020.
years/ (accessed Dec. 1, 2020). [15] D’Ayala, D., Wang, K., Smith, H., Massam, A.,
[4] CARE. Cyclone Idai and Floods Cause and Filipova, V. Flood vulnerability
Massive Destruction, Deaths in Mozambique, assessment of urban traditional buildings in
Zimbabwe and Malawi. Reliefweb (Mar 2019). Kuala Lumpur, Malaysis, Natural Hazards and
https://reliefweb.int/report/mozambique/cyclo Earth System Sciences. pp. 1 - 30, April 15,
ne-idai-and-floods-cause-massive-destruction- 2020.
deaths-mozambique-zimbabwe-and/ (accessed [16] Surigao City Planning and Development Office,
Jul 4, 2020). Surigao City Land Use, 2014.
[5] Crismundo, K. Power to be restored as soon as [17] Surigao Del Norte Electric Cooperative
flood subsides in Cagayan: DOE. Philippine (SURNECO), Household connection survey
News Agency (Nov. 2020). data in urban barangays of Surigao City, 2016
https://www.pna.gov.ph/articles/1121921 [18] HEC-HMS 4.3, Hydrologic Modelling System,
(accessed Dec 1, 2020). Technical Reference Manual, Hydrologic
[6] Dela Cruz E., Philippine paddy rice losses from Engineering Center, Institute for Water
typhoon exceed forecasts. Reuters (Sep 2018). Resources, US Army Corp of Engineers, 2000
https://www.reuters.com/article/us-asia-storm- [19] HEC-RAS ver.5., River Analysis System,
philippines-rice/philippine-paddy-rice-losses- Hydraulic Reference Manual, Hydrologic
from-typhoon-exceed-forecasts- Engineering Center, Institute for Water
idUSKCN1LX03W/ (accessed Dec 1, 2020). Resources, US Army Corp of Engineers, 2016
[7] Pistrika A. and Jonkman S., Damage to [20] The Philippine Atmospheric, Geophysical and
residential buildings due to flooding of New Astronomical Services Administration,
Orleans after hurricane Katrina. Natural Rainfall intensity-duration-frequency table.
Hazards, 54: 413 – 434, 2010. Surigao City Weather Station, 2012.
[8] Cox, R. J., Shand, T. D. and Blacka, M. J., [21] Chow V.T. Maidment R. II. Mays L.W.,
Australian Rainfall and Runoff Revision Applied Hydrology. McGraw-Hill series in
Project 10: Appropriate safety criteria for water resources and environmental engineering,
people, Stage 1 report P10/S1/006, prepared by 1988.
the Water Research Laboratory, University of [22] Department of Energy (DOE) and National
New South Wales, Sydney, 2010. Statistics Office (NSO). The 2011 Household
[9] Shand T. D., Cox, R. J., Blacka, M. J. and Energy Consumption Survey (HECS).
Smith, G. P., Australian Rainfall and Runoff Available online:
Revision Project 10: Appropriate safety criteria https://psa.gov.ph/sites/default/files/HECS%2
for vehicles - literature review, Stage 2 report 02011.pdf
13International Journal of GEOMATE, June., 2021, Vol.20, Issue 82, pp.7-14
[23] Department of Science and Technology
(DOST). Climate of the Philippines.
Copyright © Int. J. of GEOMATE. All rights reserved,
Available online:
including the making of copies unless permission is
http://bagong.pagasa.dost.gov.ph/information/ obtained from the copyright proprietors.
climate-philippines
14You can also read