AUTOMATIC EVALUATION OF HUMAN OOCYTE DEVELOPMENTAL POTENTIAL FROM MICROSCOPY IMAGES
←
→
Page content transcription
If your browser does not render page correctly, please read the page content below
AUTOMATIC EVALUATION OF HUMAN OOCYTE DEVELOPMENTAL POTENTIAL FROM
MICROSCOPY IMAGES
Denis Baručić? Jan Kybic? Olga TeplᆠZinovij Topurko† Irena Kratochvı́lová‡
?
Department of Cybernetics, Faculty of Electrical Engineering, Czech Technical University in Prague, Czech Republic
arXiv:2103.00302v1 [eess.IV] 27 Feb 2021
†
Department of Obstetrics and Gynecology, The First Faculty of Medicine and General Teaching Hospital, Czech Republic
‡
Institute of Physics of the Czech Academy of Sciences, Czech Republic
ABSTRACT
Infertility is becoming an issue for an increasing number of
couples. The most common solution, in vitro fertilization, re-
quires embryologists to carefully examine light microscopy
images of human oocytes to determine their developmental
potential. We propose an automatic system to improve the
speed, repeatability, and accuracy of this process. We first lo-
calize individual oocytes and identify their principal compo-
nents using CNN (U-Net) segmentation. We calculate several Fig. 1. Example of an input image and the corresponding
descriptors based on geometry and texture. The final step is expert segmentation. Classes background, cytoplasm, zona
an SVM classifier. Both the segmentation and classification pellucida, polar body, and cumulus cells are denoted in black,
training are based on expert annotations. The presented ap- blue, green, red, and yellow, respectively. The green and red
proach leads to the classification accuracy of 70%. frames denote viable and nonviable oocytes, respectively.
Index Terms— human oocytes, fertilization, microscopy,
classification, segmentation In this work, we aim to replace this subjective process
by an automatic evaluation of the developmental ability of
1. INTRODUCTION oocytes from digitized light microscopy images to improve
its speed, repeatability, and accuracy. We present a proof-of-
Infertility has been an issue for several years and is expected concept solution on a small dataset, showing the viability of
to further grow. Nowadays, the most common solution for this approach.
an infertile couple is in vitro fertilization (IVF). One of the
important steps is choosing the best oocytes to be fertilized,
1.1. Previous work
since, for practical, ethical, and legal reasons, it is not feasible
to fertilize more than a few of them — and even fewer can be To the best of our knowledge, the task of fully automatic
implanted. oocyte developmental potential assessment has not been ad-
The situation is easier when a patient’s own oocytes are dressed before. The closest work to ours is Manna et al. [1].
used and are, therefore, more readily available. In this case, They feed LBP texture features to an ensemble of shallow
the embryologists attempt to fertilize almost all collected neural networks and try to predict whether an oocyte or em-
oocytes that are not apparently damaged. The knowledge bryo (i.e., fertilized oocyte) will lead to birth. However, their
gained from these attempts can be used later to determine the approach requires manual segmentation and has a different
apriori developmental potential of newly collected oocytes, classification target. Since multiple embryos are usually im-
reducing both the cost and the failure rate of the IVF. This planted, the outcome is only certain in the relatively few cases
is especially important when the oocytes come from a donor. (12 in [1]) when all or none implanted embryos lead to birth.
In this case, each oocyte is very valuable, and it is important Furthermore, many embryos are not implanted but frozen, and
to determine its developmental potential reliably. Currently, the pregnancy outcome might not be known for years or not
this is performed by an expert, who carefully examines the at all. For this reason, here we have chosen to predict an em-
oocytes under a microscope. The selection process requires bryo’s ability to start the correct development, which can be
extensive experience, is time-consuming, and is done out- determined relatively quickly and for all embryos.
side the optimal environment, so it is desirable to shorten the Classification of embryo quality was targeted in [2]. The
process as much as possible. authors worked with an extensive database of 50 000 embryo
©2020 IEEE. Personal use of this material is permitted. Permission from IEEE must be obtained for all other uses, in any current or future media, including
reprinting/republishing this material for advertising or promotional purposes, creating new collective works, for resale or redistribution to servers or lists, or
reuse of any copyrighted component of this work in other works.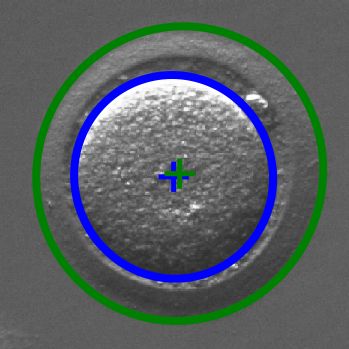
[x1,y1]
[x2,y2]
...
+ +
++ –
–
+ + ––
–
1 2 3 4 –
5
Fig. 2. The classification pipeline. (1) Binary segmentation. (2) ROI extraction. (3) Five class segmentation. (4) Feature
extraction. (5) Classification.
images and proposed a method based on deep learning to clas- 3. METHOD
sify the embryos into three quality classes. Time-lapse anal-
ysis predicting the number of cells in embryos was proposed The proposed pipeline is depicted in Fig. 2.
in [3].
Classification of swine cumulus oocyte complexes (i.e., 3.1. Oocyte localization
before stripping away the cumulus cells, unlike in our data)
was considered in [4]. The authors examined the number of We first perform a binary segmentation of the cytoplasm (cc)
cumulus cell layers and the homogeneity of the cytoplasm versus the remaining classes because the cytoplasm is clearly
and used random forests for the automatic classification of distinguishable in the images. We use a U-Net [7] CNN with
oocytes. For segmentation, a semi-automatic (snake) method MobileNetV2 [8] as the encoder, the standard mirroring de-
was used. Pure texture analysis has appeared to be useful for coder, and a pixel-wise softmax final layer. MobileNetV2 is
cytoplasm clustering [5] or cytoplasm segmentation [6]. a fast architecture with a relatively low number of parame-
ters. The extra speed is desirable when the tool is deployed in
a production environment. The network was trained for 500
1.2. Proposed approach epochs until convergence. We used the Dice loss in combina-
tion with the ADAM optimizer (learning rate 10−4 ). To pre-
This paper describes a fully automatic approach to clas- vent overfitting, multiple data augmentation methods (shifting
sify oocytes in light microscopy images (see Fig. 1) into and rotation, contrast and brightness adjustments, and blur-
two categories, viable and nonviable, where viable oocytes ring) were applied to the training images during training.
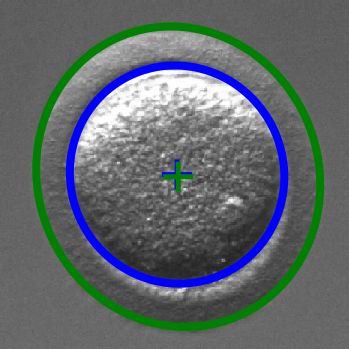
have a good potential of becoming well-developed embryos. Connected foreground components smaller than 104 pix-
We learn from subjective expert annotations of individual els are suppressed. The threshold was picked so that it does
oocytes. Our approach, described in Sec. 3, consists of five not rule out any viable oocytes, the area of which is always
consecutive stages — localization, patch extraction, segmen- more than 4 · 104 pixels. Regions of interest (ROI) of size
tation, feature extraction, and classification. 416 × 416 are extracted from around the centers of gravity of
the remaining foreground components (see Fig. 3).
2. DATA
3.2. Oocyte segmentation
Our anonymized dataset consists of 34 greyscale images of Once the ROIs are extracted, they are segmented into the five
groups of oocytes after cumulus cells denudation. The images classes described in Sec. 2 using another CNN. Since the pb
of 1392×1040 pixels were acquired using Nikon Diaphot 300 or cc classes are more challenging, we use the U-Net with the
inverted microscope, Eppendorf (Hamburg, Germany) micro- powerful ResNet50 architecture [9] as the encoder, trained for
manipulation system equipped with a thermoplate (Tokai Hit, 600 epochs, which was sufficient for convergence. The rest of
Japan). Each image contains 1 ∼ 7 oocytes. the procedure is identical to Sec. 3.1. Example segmentations
The ground truth (GT) segmentations (see Fig. 1) were are shown in Fig. 4.
created using the GIMP software. We considered four classes:
background (bg), cytoplasm (ct), zona pellucida (zp), polar 3.3. Feature extraction
body (pb), and cumulus cells (cc). Furthermore, from obser-
vations of the development, we knew the number of viable Using the segmentation from the previous section, for each
oocytes yj in each image j. The individual oocytes were clas- oocyte (ROI) we compute the 24 features described below.
sified as viable or nonviable by the embryology expert (OT). First, to handle the case where the ROI contains parts of
Skipping incompletely visible oocytes yielded 50 viable and several oocytes, we keep only the largest ct and zp compo-
53 nonviable oocytes. nents. We also suppress pb components smaller than 500 pix-
2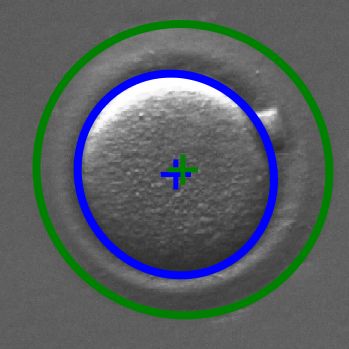
Fig. 3. Example of an input image (left) and two ROIs ex-
tracted from the image.
                                                                       Fig. 4. Three extracted ROIs in the top row and the corre-
els (for a bad oocyte, it is possible to have multiple pb com-         sponding predicted segmentations (denoted as colored areas)
ponents, so we cannot just keep the largest).                          and expert segmentations (outlined).
    Ellipses are fitted to the boundary of the ct class and to
the outer boundary of the zp class by least squares fitting (see
                                                                       on a training dataset of 83 randomly selected oocytes (ROIs),
Fig. 5). We calculate the following features based on the cy-
                                                                       yielding the validation accuracy Aval ≈ 74%. The remaining
toplasm ellipse:
                                                                       20 ROIs were used for testing (Sec. 4.4).
  • mean axis µc = ac +b2 ,
                           c
                       q
                              a2
  • eccentricity ec = 1 − b2c , ac ≥ bc ,
                              c

  • compactness γc = acSbcc π ,                                                                4. RESULTS
where ac , bc are the estimated semi-axes, and Sc is the area
of the ct component. The features µz , ez , γz are calculated          We first analyze the human expert’s accuracy, and then evalu-
similarly for the zp class. We also define the misalignment            ate the three stages of the pipeline separately.
m = kcc − cz k, the Euclidean distance between the ellipse
centers, and the ratio of the cytoplasm and zona pellucida ar-
                                                                       4.1. Expert accuracy
eas, r = SSzc , inspired by [5].
    Regarding polar bodies, two features are used: the number          The oocyte labels created by the embryologist are used to
of connected components, npb , and the total area, Spb . The           train the classifier. Since these labels are subjective, we eval-
presence of cumulus cells is not related to the oocyte quality         uate their expected error using the reliably known number of
but may influence the other features, hence we also calculate          viable oocytes yj as a reference.
the total area of cumulus cells Scc , which completes the 11                Given image j, we denote nj the number of oocytes and
geometrical features.                                                  ŷj the number of oocytes labeled as viable by the expert. The
    The remaining 13 features describe the texture of the cyto-                                                         PN
                                                                       mean absolute error of the expert MAE = N1 j=1 |yj − ŷj |,
plasm, which appears to be important [1]. The first 10 texture
                                                                       where N is the number of images, was 0.47. Assuming the
features are calculated from a three-level undecimated Haar
                                                                       embryologist commits both type I and type II errors with the
wavelet transform and correspond to the energies in the low
                                                                       same probability, the expert’s oocyte (instance) classification
pass channel and 9 high frequency channels [10]. The remain-
                                                                       accuracy was Aexp ≈ 72%.
ing three features are the mean, variance and entropy of the
pixel intensities in the cytoplasm.
                                                                       4.2. Oocyte localization
3.4. Oocyte classification
                                                                       An 8-fold cross-validation was performed to evaluate the
For each oocyte, the extracted feature vector is normalized            oocyte localization described in Sec. 3.1 using the 34 train-
and fed into a binary classifier to produce a binary label, vi-        ing images. On our data, the method works perfectly. The
able or nonviable. Several classifiers were tried with similar         number of detected oocytes was always equal to the ground
results. For the sake of space, only kernel SVM results are            truth and the localization error between the centers of gravity
reported.                                                              of the ct class, and the ground truth cytoplasm segmentation
    The RBF kernel with γ = 10−2 and the cost parameter                was inferior to 10 pixels (corresponding to approximately 5%
C = 0.1 were selected using cross-validation and grid search           of the oocyte diameter) in 98% of cases.

                                                                   3
Fig. 5. Fitted ellipses for ct (blue) and zp (green).
4.3. Oocyte segmentation
The five-class oocyte segmentation (Sec. 3.2) was evaluated
Fig. 6. ROC curve obtained for the SVM classifier on the
using a 10-fold cross-validation on the 103 ROIs, each ap-
testing data. The dot represents the operating point we used.
proximately centered on one oocyte.
The Intersection over Union (IoU) metric computed over
the folds for the ct, zp, pb, and cc classes was 95.48%, et al. [1] (AUC=0.68), who worked with the more reliable in-
89.72%, 42.85%, and 60.29%, respectively. While ct and formation of whether an oocyte leads to birth. Our test accu-
zp are segmented very well, the pb class suffers from false racy (70%) is also essentially identical to the estimated expert
detections and is more difficult to segment due to its small accuracy (72%).
size. Although the cc segmentation performance is also far We expect our accuracy to improve when more data is
from perfect, it is mostly confused with background, which is available. This should enable us to employ deep learning
not critical for our task. techniques instead of hand-crafted features, boosting the per-
formance further.
4.4. Oocyte classification
features accuracy
The performance of the SVM from Sec. 3.4 to classify the npb 0.515
oocytes as viable or not was evaluated using the 20 testing npb + texture 0.738
ROIs that were omitted during the training. npb + geometry 0.767
The classifier obtained the testing accuracy Atest = 70%, all 0.777
sensitivity Setest = 70%, specificity Sptest = 70%, preci-
sion Ptest = 70%, and the area under the ROC curve was Table 1. Accuracy achieved using four feature subsets. Each
AU Ctest = 0.69 (see Fig. 6). subset contains the number of polar bodies npb . The 13 tex-
ture features are denoted as “texture”, and “geometry” de-
4.5. Feature significance notes the remaining 10 features. The table shows the average
accuracy computed using the leave-one-out procedure.
To evaluate the features’ significance, we ran a leave-one-out
crossvalidation on the whole dataset for different subsets of
the features. Table 1 contains the results for four selected sub-
sets. The most significant feature is the number of polar bod- 6. ACKNOWLEDGMENTS
ies npb . Both the textural and geometrical features improve
the classification accuracy, while the additional improvement The authors acknowledge the support of the OP VVV
of using both is only small. funded project “CZ.02.1.01/0.0/0.0/16 019/0000765 Re-
search Center for Informatics” and the Grant Agency
5. DISCUSSION AND CONCLUSIONS of the Czech Technical University in Prague, grant No.
SGS20/170/OHK3/3T/13.
In this paper, a proof-of-concept solution was proposed for
automatic detection of oocytes that have a good developmen- 7. REFERENCES
tal potential and are therefore viable for fertilization. When
interpreting the results, it is important to realize that the ex- [1] C. Manna et al., “Artificial intelligence techniques
pert assessment of the oocyte quality from a single image is for embryo and oocyte classification,” Reproductive
difficult and rather subjective. For example, the polar body, biomedicine online, vol. 26, no. 1, pp. 42–49, 2013.
which is an important indicator of oocyte viability, may not
be visible in a given image. Our performance (AUC=0.69) is [2] P. Khosravi et al., “Deep learning enables robust assess-
nevertheless comparable to the accuracy achieved by Manna ment and selection of human blastocysts after in vitro
4fertilization,” npj Digital Medicine, vol. 2, no. 1, pp. [7] O. Ronneberger et al., “U-Net: Convolutional net-
1–9, 2019. works for biomedical image segmentation,” in In-
ternational Conference on Medical Image Computing
[3] V. Raudonis et al., “Towards the automation of early-
and Computer-Assisted Intervention. Springer, 2015,
stage human embryo development detection,” Biomedi-
pp. 234–241.
cal Engineering OnLine, vol. 18, no. 1, pp. 1–20, 2019.
[4] P. S. Viswanath et al., “Grading of mammalian cu- [8] M. Sandler et al., “MobileNetV2: Inverted residuals and
mulus oocyte complexes using machine learning for in linear bottlenecks,” in Proceedings of the IEEE Con-
vitro embryo culture,” in 2016 IEEE-EMBS Interna- ference on Computer Vision and Pattern Recognition,
tional Conference on Biomedical and Health Informat- 2018, pp. 4510–4520.
ics (BHI). IEEE, 2016, pp. 172–175. [9] K. He et al., “Deep residual learning for image recogni-
[5] T. M. A. Basile et al., “A texture-based image process- tion,” in Proceedings of the IEEE Conference on Com-
ing approach for the description of human oocyte cy- puter Vision and Pattern Recognition, 2016, pp. 770–
toplasm,” IEEE Transactions on Instrumentation and 778.
Measurement, vol. 59, no. 10, pp. 2591–2601, 2010.
[10] M. Unser, “Texture classification and segmentation us-
[6] L. Caponetti et al., “Cytoplasm image segmentation by ing wavelet frames,” IEEE Transactions on Image Pro-
spatial fuzzy clustering,” in International Workshop on cessing, vol. 4, no. 11, pp. 1549–1560, 1995.
Fuzzy Logic and Applications. Springer, 2011, pp. 253–
260.
5You can also read