Automotive Industry Outlook and Navigating Financial Challenges as the COVID-19 Impact Continues - September 3, 2020 - Butzel Long
←
→
Page content transcription
If your browser does not render page correctly, please read the page content below

Automotive Industry Outlook and Navigating Financial
     Challenges as the COVID-19 Impact Continues
                                         September 3, 2020
Automotive Industry
                       Outlook:
                       Balancing Near-Term Execution Amidst
                       Industry Disruption
                       September 2020

                       Mike Wall
                       Executive Director, Automotive Analysis
                       +1 248 728 8400 Direct
                       +1 616 446 6885 Mobile
                       Mike.Wall@ihsmarkit.com

© 2020 IHS Markit. All Rights Reserved.
3

A World Leader in Critical Information, Analytics and Solutions
Addressing Strategic Challenges with Interconnected Capabilities
                                                                                             Energy

                                                                                                              Financial
                                                                     Agribusiness
                                                                                                              Services

    50,000+                               80%                 Climate &                                                   Economics &
    customers in over                     of the Fortune   Sustainability                                                 Country Risk
    140 countries                         Global 500

                                                                                                                           Engineering &
                                                           Life Sciences
                                                                                                                           Product Design

    94/100                                $4B
                                          annual revenue                                                           Telecoms &
    largest US corporates                                          Chemical
                                          NYSE: INFO                                                               Technology

                                                                                    Maritime &   Automotive
                                                                                      Trade

© 2020 IHS Markit. All Rights Reserved.
4

COVID-19 Autos Assessment
                                 Key Forecast Assumptions

                                • Governments forced to seek sustainable way to live with virus
                                  (cannot lockdown forever / too soon for vaccine / Realpolitik vs. science)
                                • Global real GDP growth hard & fast into “real” recession for 2020 (-5.1%)
                                  Recovery prospects mixed into 2021 (+4.2%)
                                • China real GDP growth set at 1.5% for 2020 – first in, first out
                                • US real GDP slumps about -4.8% for 2020 – virus spreads south (risks “W”)
                                • Eurozone GDP growth prospects mixed – -8.7% for 2020 (ITA/ESP worst/DEU better)

                                 Auto Incentives Help Limit Downside

                                • Government Autos stimulus measures now included (esp. Europe “Big 4” & China)
                                • China limited support (NEVs / China5 extension / city level measures)
                                • Europe targeting LEVs could limit upside (uptake mix vs. volume boost)
                                • Germany / France / Spain / Italy / Greece / EU Next Generation plan
                                • UK unlikely for 2020 / USA no news

                                                                                                                  Note: World Economic Outlook – August 2020
© 2020 IHS Markit. All Rights Reserved.
5

   COVID-19 Recession Likely Deeper than Global Financial Crisis in 2008-09
     Global Financial Crisis                     Real GDP                                        COVID-19 Crisis

       2008             2009              2010   Percent change                    2018   2019        2020               2021                2022
         1.7             -1.7              4.2   World                              3.2    2.6        -5.1                 4.2                 3.9
        -0.1             -2.5              2.6   United States                      3.0    2.2        -4.8                 3.1                 4.1
         1.0             -2.9              3.1   Canada                             2.0    1.7        -7.0                 3.7                 4.1
         0.3             -4.4              2.1   Eurozone                           1.8    1.3        -8.7                 4.3                 3.4
        -0.3             -4.2              1.9   United Kingdom                     1.3    1.5       -11.9                 4.9                 3.3
         9.6              9.4             10.6   China                              6.7    6.1         1.5                 7.1                 5.7
        -1.1             -5.4              4.2   Japan                              0.3    0.7        -5.7                 2.2                 1.3
         3.3              7.7              8.5   India*                             6.1    4.2        -6.9                 6.5                 5.1
         5.1             -0.1              7.5   Brazil                             1.3    1.1        -7.0                 3.8                 2.6
         5.5             -7.9              4.5   Russia                             2.5    1.3        -6.0                 3.4                 2.5
                                                 * Fiscal years starting 1 April
                                                 Source: IHS Markit                                                                © 2020 IHS Markit
                                                                                                             Note: GDP growth forecasts – August 2020

© 2020 IHS Markit. All Rights Reserved.
6

2020 Forecast Outlook
 1.        COVID-19 uncertainty adds to already-pressured autos industry – 2020 witnesses unprecedented instant stalling of
           demand – impact and recovery is rolling as virus spreads and economies re-open
 2.        Global 2020 slump exceed 2-year decline global recession 2008/2009 – risk/recovery is varied & ultra-dependent on
           government action & support/stimulus packages
 3.        “Patient zero” China market should bottom out in 2020 – hopes for beginnings of recovery from 2021 – some
           demand likely to have been destroyed
 4.        Europe massively impacted by COVID-19 crisis with significant demand contraction – governments stepping in with
           stimulus/incentives to fill the void (BREXIT talks & EU30 CO2 plans remain in the background)
 5.        Quick US recession leads to consumer retrenchment & immediate vehicle demand slump, yet recovery is already
           underway
 6.        ROW mixed prospects – high risk for “flare-ups” & still early days for Brazil, Russia, India and others.
 7.        Remote/flexible crisis working arrangements could influence future mobility patterns…

© 2020 IHS Markit. All Rights Reserved.
7

Near-Term: Cautious Upgrades as Much of the World Re-opens – yet 2020 Autos
Outlook Remains Far Worse than 2-year Decline During Great Recession of 2008/09
Global Light Vehicle Sales Outlook
Millions

                                                                                       (% chg)

                                                                                                             vs. Jan-
                                                                                       Growth
                                                                      Market
  100.0

                                                                                2020
                                                                                 TIV

                                                                                                                20
                                                      Jan 2020 FC
    95.0

    90.0

    85.0                                                            China      21.9m   -11.9%              -2.8m
    80.0
                                                                     USA       13.6m   -20.3%              -3.2m
    75.0           -5% 2008
                   -3% 2009
    70.0                                         August 2020 FC     WE/CE      13.8m   -23.8%              -3.7m
    65.0
              Peak-to-Trough: -8%
    60.0                                                            Global     71.9m   -19.8%            -16.8m

 Source: IHS Markit – August 2020 LVS Forecast                                                            © 2020 IHS Markit

                                                                                          Note: China refers to Mainland China
© 2020 IHS Markit. All Rights Reserved.
8

Global Light Vehicle Production
COVID-19 Impact Encompasses All Markets, Including Key Major Markets; Volatility Remains a Concern

                             95

                             90
     Production (millions)

                             85

                                                                                                                                                   +12.8%
                                   94.2
                             80
                                  million    88.9
                                            million
                             75
                                                                                                                                                    79.5
                             70                                                                                                                    million

                                                      -480,000     -1,051,000 -2,376,000   -2,743,000 -3,022,000 -3,554,000 -5,240,000
                             65                                                                                                           70.5
                                                                                                                                         million

                             60
                                   2018      2019     ME/ Africa    South      Japan/      Greater   South Asia    North      Europe      2020      2021
                                                                   America     Korea        China                 America

Source: IHS Markit Light Vehicle Production Forecast

© 2020 IHS Markit. All Rights Reserved.
9

China: Outlook Increases as Pent-up Demand Released and Government
Investment Supports Robust Recovery in Q2; H2 will be Tougher
China (Mainland) Light Vehicle Production Forecast Comparisons                                • Aligned with recent economic activity
                                                                                                output has maintained strong
            30                                                                                  momentum since April. August outlook
 Millions

                                           Feb      June      July     August                   +404k over July. Mainly driven by
            28
                                                                                                commercial vehicle and premium
                                                                                                brands.

            26
                                                                                              • Passenger car output is restored to
                                                                                                pre-COVID levels as capacity
                                                                                                utilization rate approaches 90% for
            24                                                                                  most of international brands and 70%
                                                                                                at major Chinese local brands.
            22                                                                                • New capacity levels to be determined
                                                                                                but government pushing recovery
            20
                                                                                                hard. Supply chain issues seemingly
                                                                                                navigated.

            18
                                                                                              • Output now down 11.2% in 2020 held
                  2018                2019       2020      2021      2022       2023   2024     to grow by 6.8% in 2021 as COVID-19
                                                                                                effects recede
 © 2020 IHS Markit. All Rights Reserved.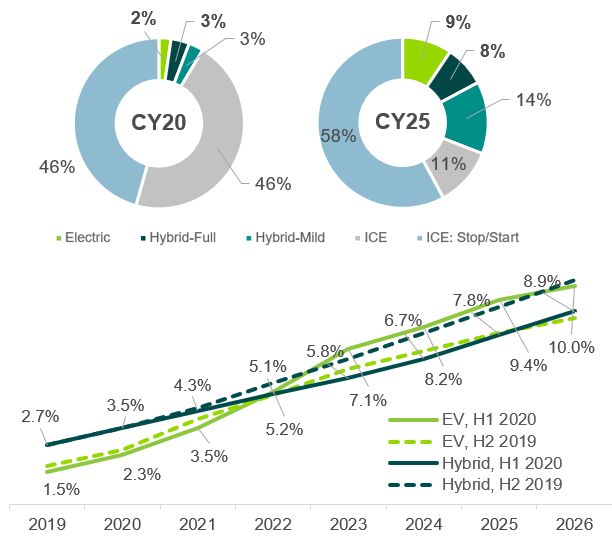
10

 Europe: Facilities are Restarted Although Shift Patterns are not Fully Restored;
 Targeted Incentive Schemes Supportive and Impactful in Short-term
European Light Vehicle Production Forecast Comparisons                                • Near-term outlook bolstered by a stronger
            24                                                                          pace of production recovery and an
 Millions

                                        Feb   June   July     August                    improved demand outlook for the region,
            23                                                                          particularly West Europe as government
            22
                                                                                        incentive programs are being initiated to
                                                                                        stimulate vehicle sales. Outlook
            21                                                                          increased 41k this month.
            20                                                                        • Major producers moved closer to pre-
            19
                                                                                        crisis output rates in August with
                                                                                        Germany producing at roughly 90% of
            18                                                                          pre-crisis levels.
            17                                                                        • With economies re-opened and
                                                                                        manufacturing restarting, the focus has
            16
                                                                                        shifted to the financial condition and
            15                                                                          sentiment of consumers and their
                                                                                        appetite to re-engage the light vehicle
            14
                  2018                2019    2020     2021      2022   2023   2024     market.

  © 2020 IHS Markit. All Rights Reserved.
11
US: July Sales Advance Recovery in Auto Demand Since April, but Uncertainty and
Risk Remain in Second Half of 2020
US: COVID-19 Impacted Light Vehicle Sales Forecast (August 2020) • We have increased our full-year 2020 LV sales forecast
to 13.6m units (August 2020 forecast) but risks to
Millions recovering demand levels are present through H2-2020.
18.0 • With the rising number of COVID-19 cases in some
states, it will be important to track auto sales
17.0
developments over the next few months. A “second
16.0 wave” of severe lockdowns is not in the current baseline
+135k assumption.
15.0
+268k • July sales results exhibited a degree of noteworthy
14.0
resiliency. Retail sales are recovering much better than
13.0 fleet sales – with auto consumers motivated by OEM
incentives, 0% interest rates, “reopening” activities and
12.0 likely supported by government stimulus checks.
11.0 • Vehicle inventory levels will be an important variable
10.0 moving through the immediate forecast horizon. There
2015 2016 2017 2018 2019 2020 2021 2022 2023 2024 could be some model-level pressures as the sales pace
picks up and assembly plants slowly come online.
Aug '20 Jul '20
• 2020 volume LVS setting of 13.6m units (-20.3% y/y)
followed by 14.8m in 2021 (up 8.6% y/y).
2020 2021 2022 2023
% Growth YoY -20.3% +8.6% +6.2% +1.4%
Vol Delta vs. Pre-Crisis Jan -
© 2020 IHS Markit. All Rights Reserved.
Forecast 3,218,000 -1,813,000 -736,000 -526,00012
US Light Vehicle Sales in Alternative Scenarios
Could a “V-Shaped” Recovery Save the Day or Will a “Second Wave” Derail the Market?
US Light Vehicle Sales Contingency Forecast • Baseline forecast: Efforts to contain COVID-19
shutter large swaths of the economy and create
18 deeper recession than 2008-09. Inventory in the
17
system offsets some of the plant disruption impact,
yet also limits near-term growth prospects; OEMs
16 prioritize production of more profitable programs
LV Production (Millions)
15 (e.g. trucks).
14 • Optimistic forecast: The forecast reflects a broader
13 V-shaped recovery as stimulus measures are
12
expanded globally. Additionally, data from IHS
Markit’s “Vehicle Buyers Journey” survey points to
11 COVID-19 boosting interest (bio-safety) and
10 increasing demand for private car ownership in the
2010 2012 2014 2016 2018 2020 2022 2024 US, West Europe and China. A stronger economic
response in 2021–23 accelerates recovery in light
Baseline (55%) Optimistic (25%) Pessimistic (20%)
vehicle demand.
Source: IHS Markit © 2020 IHS Markit
• Pessimistic forecast: High COVID-19 infection
rates in parts of the world create the risk of a W-
Sales (M) 2019 2020 2021 2022 2023 2024 shaped cycle with a second downturn in the global
economy in late 2020. Additionally, stimulus
Baseline (55%) 17.08 13.60 14.78 15.69 15.91 16.10 measures prove ineffective at backstopping the
crisis and unemployment rates remain elevated.
Optimistic (25%) 17.08 14.24 15.74 16.26 16.61 16.71 Economic recovery begins later and at a much
slower rate. Severe contractions last through the
Pessimistic (20%) 17.08 12.15 14.07 14.69 15.41 15.60 first-quarter of 2021 and consumer confidence
remains depressed.
© 2020 IHS Markit. All Rights Reserved.13
North America: Recovery Picking up Driven by Inventory Gaps but Situation in
US South and Mexico Continues to Present a Downside Risk
North American Light Vehicle Production Forecast Comparisons • Production continues to ramp-up
following COVID-19 related shutdowns
18
and despite a variety of struggles.
Millions
Feb June July August
17
Increases this month reflect demand
improvement and inventory backfill; -
16 21.8% 2020, +14.5% 2021
• Between March and June 2020, US
15
sales totaled 3.97 million units, while
production in the same period totaled
14
2.33 million units, resulting in an over
13
1.6-million-unit gap in the supply of
vehicles needed to support inventory
12 and demand.
• The production gap is driving
11
manufacturers to increase production
to pre-COVID-19 levels that, while
10
2018 2019 2020 2021 2022 2023 2024 justified, may not be sustainable
beyond 4Q-2020 and into 2021.
© 2020 IHS Markit. All Rights Reserved.14
North American Light Vehicle Production
COVID-19 Impact Erases Outlook
North American Light Vehicle Production Short term
20.0 COVID-19 implications
Millions
-10.2 million units -3.7M units in 2020
18.0
17.8 Production phases: shutdown, restart,
17.1 17.0
16.0 16.3 16.3 16.5 16.7 alignment
15.7 15.7 16.0
14.0 14.6
Program delays or timing slippage
Inventory correction
12.0 12.8
1.6M unit sales to production gap
10.0 Restocking production bolsters outlook
8.0 Long term
6.0 Sourcing decisions
4.0 USMCA implications
Capacity
2.0
Expansion and maximization
0.0 Second phase developments
2016 2018 2020 2022 2024 2026
BEV implications
August 2020 Forecast January 2020 forecast
Lifecycle pressure
Source: IHS Markit © 2020 IHS Markit
© 2020 IHS Markit. All Rights Reserved.15
North America Light Vehicle Production
2020 vs. 2019
2020F 2019F ∆ Units • Production collapse due to COVID-
OEM %∆
(000s) (000s) (000s)
19 impact affecting both production
GM 2,371 2,881 -17.7% -510
and demand; product launch
Ford 2,014 2,673 -24.7% -659 delays intensify
Fiat/Chrysler 1,733 2,432 -28.7% -699
Detroit 3 6,118 7,986 -23.4% -1,868 • GM – T1XX SUVs, Corvette
Toyota 1,570 1,856 -15.4% -286 • Ford – F-150, Bronco Sport and
Honda 1,391 1,817 -23.4% -426 Mustang Mach-E launches
Renault/Nissan 915 1,434 -36.2% -519
Hyundai 690 897 -23.1% -207
• Key New Domestic launches
include Acura MDX, TLX; Hyundai
Asian 4 4,566 6,004 -24.0% -1,438
Elantra; Kia K5, Sorento; Nissan
VW 537 709 -24.3% -172
Rogue; Tesla Model Y; Toyota
BMW 384 436 -11.9% -52
Sienna; VW Atlas Cross Sport, VW
Daimler 324 314 3.2% 10 Tarek, etc.
German 3 1,245 1,459 -14.7% -214
Others 832 866 -3.9% -34
Total 12,761 16,315 -21.8% -3,554
Source: IHS Markit Light Vehicle Production Forecast
© 2020 IHS Markit. All Rights Reserved.16
North America Light Vehicle Production
2021 vs. 2020
2021F 2020F ∆ Units • Production growth as the market
OEM %∆
(000s) (000s) (000s)
recovers from COVID-19 impact
GM 2,486 2,371 4.9% 115
Ford 2,581 2,014 28.2% 567 • GM – Hummer EV and Bolt EUV
Fiat/Chrysler 2,012 1,733 16.1% 279
• Ford – Bronco and Maverick
Detroit 3 7,079 6,118 15.7% 961
Toyota 1,649 1,570 5.0% 79 • FCA – Grand Cherokee and
Honda 1,526 1,391 9.7% 135 Wagoneer/Grand Wagoneer
Renault/Nissan 1,185 915 29.5% 270
• Key New Domestic launches
Hyundai 873 690 26.5% 183 include BMW 2-Series, Honda
Asian 4 5,233 4,566 14.6% 667 Civic & HR-V; Hyundai Santa Cruz
VW 612 537 14.0% 75 & Tucson; Lucid Air; Nissan
BMW 436 384 13.5% 52 Frontier & Pathfinder; Rivian R1S
Daimler 313 324 -3.4% -11 & R1T; Subaru Impreza; Toyota
German 3 1,361 1,245 9.3% 116 Corolla Cross & Tundra; Audi Q5
Others 938 832 12.7% 106 Sportback, etc.
Total 14,611 12,761 14.5% 1,850
Source: IHS Markit Light Vehicle Production Forecast
© 2020 IHS Markit. All Rights Reserved.17
Production Outlook
North American Light Vehicle Production by Country
20 Mexico Canada US Change 50% 2019 – 2027
18 40%
17.0 16.7
16.2 16.3
16.0
16 15.4
14.6 30%
2.9 3.9 3.8 3.9 +89,000
3.6
Output (millions)
14 2.9
Y-O-Y % Change
12.6 12.8 3.2 20% CAGR = 0.3%
11.9
12
2.1
2.4 2.0 1.9 1.5 1.5
2.2 2.4 3.0 10%
1.4
10
2.0
2.1
1.3 0%
8 -372,000
11.3 -10%
CAGR = -2.7%
6
11.1 10.9
10.9 10.6
10.1 8.5 10.0
8.5 -20%
4 7.6
2 -30%
+673,000
0 -40% CAGR = 0.8%
Source: IHS Markit Light Vehicle Production Forecast
© 2020 IHS Markit. All Rights Reserved.18
North American Light Vehicle Production
COVID-19 Impact is Pervasive, yet Customer Mix Continues to Shift
North America Light Vehicle Production Divergent trajectories – 2019 to 2027
20.0 Domestics
Millions
18.0 -270K units or -3.4%
8.5 Offshoring to China
16.0 8.4 8.1
8.0 8.1 8.3 8.4 8.4 Increasing shift to trucks
7.7 7.8
14.0 7.1 More closely tied to US sales
Build where you sell
12.0 6.3
Transplants
10.0
+473K units or +5.9%
9.2
8.0 8.6 8.6 Localization
8.0 7.5 7.7
7.1 7.4 7.4 7.4 7.5 Capacity expansion
6.0
6.1 Global sourcing and increasing exports
4.0
Start-ups
2.0
+186K units or +50.9%
0.0 Tesla largest component, although
2016 2018 2020 2022 2024 2026 offshoring is slowing growth
Detroit 3 Start-ups Transplants Monitoring other start-ups
Source: IHS Markit © 2020 IHS Markit
© 2020 IHS Markit. All Rights Reserved.19
North America Light Vehicle Production Launches by Vehicle Type
Capital Needs Intensify with New Launch Activity; Timing Delays Expected Due to COVID-19
North America Light Vehicle Production Launches Volatility Extends to Launch Timings
45
Watch for delays, restructuring Launches in late 2021, 2022 and 2023 can be
or cancellation of future subject to further delay, reprioritization, rescoping
40 programs
37 37 or even cancellation
35 If possible, OEMs will review portfolios to extend
29 current vehicles – possibly integrating new
30 28 27 27
26 26 minor/moderate facelifts to extend the lifecycles
20
25 23 23
25 Utility vehicle expansion continues
20 15 13 Competition weights on leaders
14 18 18 23 Splintering segmentation with pricing/margin
15 15 15
7 3
pressure
4
10 5 4 BEV activity
1 2
5
5
10 11 4 39+ all-new nameplates
9 8 3
7 7
4 6 4 3
10.4% or 1.7 million units of North American
0 production by 2027
2018 2019 2020 2021 2022 2023 2024 2025 2026 2027
Product redundancy
Jan ‘20 F/C 34 25 31 41 33 31 28 24 Legacy programs as a hedge
Source: IHS Markit Car Pickup Utility © 2020 IHS Markit
© 2020 IHS Markit. All Rights Reserved.20
Powertrain Technology Outlook
Regional Preferences and Incentives Result in a Varied Propulsion Mix; Watch the Model Count!
United States EU28 China
• SAFE rule assumes 1.5% stringency rate • Propulsion forecast largely unchanged as little • CAAM may loosen CAFC/NEV credit
increase/yr vs. ~5%/yr for CAFE. relief expected for CO2 compliance. requirements and increase 2020 plate quotas
• PHEV and HEV production mix reduced post • Most electrified propulsion investments are • Extended NEV subsidies/exemptions weaken
2022, improved outlook for BEV considered safe. pre-buy in 2020 & boost demand in 2021-22.
© 2020 IHS Markit. All Rights Reserved.21
Mobility: Consumers and Car Industry are Changing
What Impact will COVID-19 Have on Mobility? Accelerate or Brake?
Disruptive Factors for a Disruptive Industry
for illustrative purposes only
2019
Automation Ownership
Autonomous
+5-10 years +10 years
Propulsion
…may accelerate EV adoption.
COVID-19 disruption… …may impact mobility services either way; VMT implications across ownership spectrum
…may recalibrate AV purpose.
VMT: Vehicle Miles Traveled
© 2020 IHS Markit. All Rights Reserved.22 Summary • Extreme volatility emerging in the short term as exogenous events increase market pressures; supplier distress needs to be monitored • Beyond the current cycle, growth rates will decline as core themes persist: electrification, safety, autonomy and new mobility • Scale is as important as ever to meet these challenges – FCA/PSA could be just the beginning • Strategic collaboration doesn’t have to mean Merger & Acquisition as long as the right results are delivered © 2020 IHS Markit. All Rights Reserved.
23

Thank You!

Mike Wall
Executive Director, Automotive Analysis
mike.wall@ihsmarkit.com
+1 248 728 8400 Direct
+1 616 446 6885 Mobile

IHS Markit Customer Care
CustomerCare@ihsmarkit.com
Americas: +1 800 IHS CARE (+1 800 447 2273)
Europe, Middle East, and Africa: +44 (0) 1344 328 300
Asia and the Pacific Rim: +604 291 3600

 Disclaimer
 The information contained in this presentation is confidential. Any unauthorized use, disclosure, reproduction, or dissemination, in full or in part, in any media or by any means, without the prior written
 permission of IHS Markit Ltd. or any of its affiliates ("IHS Markit") is strictly prohibited. IHS Markit owns all IHS Markit logos and trade names contained in this presentation that are subject to license.
 Opinions, statements, estimates, and projections in this presentation (including other media) are solely those of the individual author(s) at the time of writing and do not necessarily reflect the opinions of IHS
 Markit. Neither IHS Markit nor the author(s) has any obligation to update this presentation in the event that any content, opinion, statement, estimate, or projection (collectively, "information") changes or
 subsequently becomes inaccurate. IHS Markit makes no warranty, expressed or implied, as to the accuracy, completeness, or timeliness of any information in this presentation, and shall not in any way be
 liable to any recipient for any inaccuracies or omissions. Without limiting the foregoing, IHS Markit shall have no liability whatsoever to any recipient, whether in contract, in tort (including negligence), under
 warranty, under statute or otherwise, in respect of any loss or damage suffered by any recipient as a result of or in connection with any information provided, or any course of action determined, by it or any
 third party, whether or not based on any information provided. The inclusion of a link to an external website by IHS Markit should not be understood to be an endorsement of that website or the site's owners
 (or their products/services). IHS Markit is not responsible for either the content or output of external websites. Copyright © 2018, IHS MarkitTM. All rights reserved and all intellectual property rights are
 retained by IHS Markit.

© 2020 IHS Markit. All Rights Reserved.
Financial Crisis and Restructuring
2020 Update
Max J. Newman | Butzel Long | newman@butzel.comBackground
• Despite stimulus efforts by Congress and the Administration, the COVID-19 epidemic
has had a severe impact on GDP, and on the business outlook for the balance of
2020 and beyond.
• The Stimulus Efforts – particularly the Payroll Protection Program (“PPP”) and other
government loan programs has, so far, headed off a significant portion of the
expected wave of bankruptcy cases, except in the retail, hospitality and energy
sectors.
• A few industrial cases have begun, while other companies are waiting for the
resolution of their PPP loans or other inflection points in the ongoing crisis to make
decisions on their financial future.
• The expected bankruptcy wave, although delayed, may range from high tide to a
tsunami.
© 2020 Butzel LongPresentation
• While there are many ways to reorganize, sell or liquidate a financially troubled business, this
presentation will focus on the Chapter 11 process, as the most complex and “legal” process.
• Many businesses can take far less extreme measures, ranging from forbearance agreements
with lenders to give short-term relief to asset or stock sales without Court involvement.
• Other measures may include self-liquidation out of court, trust chattel mortgages, composition
agreements between a company and its creditors, the appointment of receivers, state law
insolvency remedies, including Assignments for the Benefit of Creditors.
• This presentation is going to focus on the rights, duties and opportunities of a debtor in
chapter 11, although I will mention issues specific to creditors, suppliers and customers as well.
• Finally, because of the automotive industry’s prominence in this area, I will address
Accommodation Agreements, Access and Security Agreements and other auto industry-
related concerns.
© 2020 Butzel LongWhat can Chapter 11 do?
Introduction
• Chapter 11 is a versatile and flexible process to permit individuals and businesses to
restructure their liabilities, and, where appropriate to:
– Halt action by secured and unsecured creditors that could threaten the Debtor’s viability;
– Create a breathing spell to examine business options;
– Maintain existing management in control, unless there is fraud, dishonesty or gross
incompetence. At the same time, financial professionals can supplement or even replace
management;
– Provide an opportunity to settle long-standing, expensive litigation;
– Establish the terms of payment to creditors;
– Reorganize;
– Sell all or a part of a company in bulk, usually through an asset sale;
– Liquidate in an orderly manner
© 2020 Butzel LongWho can file Chapter 11?
• Almost every type of business, corporate, limited liability company,
general and limited partnerships, profit or non-profit enterprises. Only
a few specialized entities (certain types of banks, business trusts, stock
brokers and commodity brokers) are not eligible. There are very few
differences between Chapter 11 cases based on the form of
businesses.
• Individuals.
• An individual or business does not need to be insolvent to file
Bankruptcy.
© 2020 Butzel LongDownsides to Chapter 11
• This is a summary – there are many downsides.
• Cost. Cases have significant administrative costs (attorneys, financial professionals, sometimes
attorneys and professionals for Banks and Creditors’ Committees).
• Limited time periods – depending on the size and complexity of the case, a Plan may be due
anywhere from 60 days to 540 days after the case is filed.
• At the same time, loss of flexibility and speed – actions outside of the ordinary course of
business most be approved by the Court after notice to creditors. While this process can be
sped up by the Court, there is a limit on most Court’s willingness to expedite matters.
• Loss of privacy – Bankruptcy depends on open and accurate financial reporting from Debtors,
and creditors will have opportunities to inspect books and records. Certain confidential
information may be protectable, but the default rule is openness.
• Loss of business opportunities. It is rare for companies in Chapter 11 to be given new, long-
term programs.
• Loss of independence. The Court supervises the case, and can force liquidation or other
negative business actions.
© 2020 Butzel LongThe SBRA
• In 2019, Congress passed the Small Business Reorganization Act, which provided for a
faster, less costly version of Chapter 11 for smaller businesses.
• Originally, the SBRA was only for businesses with undisputed, non-contingent liabilities
of less than $2,725,625.
• However, with the COVID crisis, Congress temporarily amended the SBRA to make
businesses with up to $7,500,000 of undisputed, non-contingent liabilities eligible. The
higher liability limit is currently scheduled to expire in April 2021, but the date may
change.
• In a Small Business Chapter 11, a Trustee is appointed with duties that include
evaluating and facilitating the Plan.
• Deadlines in an Small Business Chapter 11 are shorter than a traditional case. While
this puts pressure on a Debtor to get issues resolved quickly, it also likely reduces the
cost and business burden of cases.
• The SBRA provides significant changes to the Plan confirmation process that benefit
many small business debtors. These are summarized in slide 17.
© 2020 Butzel LongKey Concepts in Chapter 11
• The next 10 slides will address key concepts in Chapter 11 cases.
These include:
– The Automatic Stay
– The Debtor-in-Possession
– The Use of Cash Collateral and Financing
– Asset Sales
– Leases and Executory Contracts
– The Disclosure Statement
– The Plan.
• Except for the Disclosure Statement and Plan, each concept is
substantially similar in “traditional” Chapter 11 cases and the SBRA.
© 2020 Butzel LongThe Automatic Stay
• Section 362(a) of the Bankruptcy Code provides an automatic, broad and general stay
against creditors seeking to take action against the Debtor or its assets outside of the
Bankruptcy Court.
– Items stayed include foreclosure actions, enforcement of judgments, pending litigation, collection
letters, evictions, termination of contracts, enforcement of liens and setoffs.
– Creditors can modify the automatic stay with permission of the Court for cause or where the Debtor
lacks equity in assets that are the subject of the creditors’ action, and those assets are not necessary
to an effective reorganization.
• Some important exceptions to they stay are governmental police actions, evictions where the
Debtor’s lease has expired prior to the Bankruptcy or has been terminated, and actions
against 3d parties liable for creditor claims, including guarantors.
• The automatic stay prevents suppliers from increasing prices to make up for credit losses.
© 2020 Butzel LongThe Debtor-in-Possession
• In the overwhelming majority of Chapter 11 cases, the debtor, its
existing management, and any professionals employed by the debtor
continues to manage the debtor’s business as well as the bankruptcy
case.
• The Debtor-in-Possession generally is removed only for serious pre-
bankruptcy misconduct, “bad acts” in connection with the case or
gross incompetence.
• One of the primary benefits of the Debtor-in-Possession is the exclusive
ability to file a Plan within the first 120 days of the case. For good
cause, that period can be extended by another 16 months.
© 2020 Butzel LongCreditor’s Committees
• Creditor’s Committees are formed in some cases by the United States Trustee’s Office – a
division of the Department of Justice with some supervisory responsibilities for Bankruptcy
Cases. Generally, Committees are formed from the unsecured creditors with the largest
claims who wish to serve, although sometimes smaller creditors are added to get the most
representative committee.
• The Committee can employ counsel and financial advisors at the expense of the Debtor.
• The Committee has standing to appear on and be heard on any issue in the case.
• The purpose of the Committee is to negotiate the terms of a Plan with the Debtor.
• The Committee also investigates the validity of secured claims as well as whether claims exist
against any party, including former and current owners and officers of the Debtor.
© 2020 Butzel LongUse of Cash Collateral and Financing
• “Cash Collateral” is cash on hand, deposit accounts, accounts receivable and inventory as of the date of the
Bankruptcy, and, in certain respects, proceeds of that collateral.
• “Adequate Protection” are measures that provide a secured party with the “indubitable equivalent” of the value
of its collateral, as that collateral existed as of the date the Debtor’s case filed.
– Adequate protection can consist of new liens, continuation of existing liens, enhanced reporting requirements, new priority
claims and even deadlines set for plans and sale processes. Cash Collateral and Financing Orders can be exceedingly
complex.
• The Debtor cannot spend cash collateral, obtain a new loan or draw upon an existing loan without permission of
the Court. These matters are usually initially addressed within 3 business days of the commencement of the case
on an interim basis.
• In order to obtain permission to use cash collateral or financing, the Debtor must show that secured creditors’
claims are adequately protected. This is most often done through negotiation and consent, but can be
determined by the Court.
• Unsecured creditors sometimes obtain additional protections through cash collateral and financing orders as
well.
• Financing Orders can provide that new lenders “prime” or take priority over existing loans, or for new liens for new
lenders, “super-priority claims” and other protections.
© 2020 Butzel LongAsset Sales
• Subject to Court approval, a Chapter 11 Debtor may sell assets outside of the
ordinary course of business free and clear of liens, claims and interests.
• Chapter 11 sales may include substantially all operating assets of a business, or the
division of a business, and may be the exit strategy for a business.
• While there is no set requirements for a Chapter 11 sale, it is common to obtain an
agreement with a “Stalking Horse” [initial] buyer and to permit other potential buyers
to submit higher and better offers after access to due diligence.
• Going concern assets sales can be done in 30 days or even somewhat less if there is
a compelling reason to rush the process, although the average process would take
around 90 days or more.
© 2020 Butzel LongLeases and Executory Contracts
• Chapter 11 allows the Debtor to reject unfavorable unexpired leases
and executory contracts with Court permission. It is rare for the Court
to overrule the Debtor’s business judgment on these matters.
• This can include unfavorable customer or supplier contracts. Rejection
is a pre-bankruptcy breach of the contract or lease.
– This means that claims for breach of the rejected contract are pre-bankruptcy
unsecured claims;
– For non-residential leases, there are caps on the unsecured damage claim (the
great of 1 year’s rent or 14% of the remaining term of the lease).
• The ability to reject contracts is a powerful incentive to the
renegotiation of contracts.
© 2020 Butzel LongThe Disclosure Statement
• Not every Chapter 11 Case will have a Disclosure Statement – the Disclosure
Statement is only prepared in connection with a Chapter 11 Plan;
• The Disclosure Statement is similar to a securities prospectus, and must provide
substantial information about proposed distributions to creditors, a business’s history,
claims against third parties, financial prospects, business plans, the qualifications and
salary of officers and directors and financial projections, as well as information on the
means of implementing a Plan, including risk factors. It can contain additional
information. The purpose is to provide a creditor with adequate information to make
an informed vote to accept or reject a Plan.
• Disclosure Statements are subject to Court approval.
• In an SBRA case, a formal Disclosure Statement is not required, although the Plan
must provide some of the information typically contained in a Disclosure Statement.
© 2020 Butzel LongThe Plan
• A Chapter 11 Plan, at its essence, is a binding contract between the Debtor and its creditors. It sets forth the distribution to
creditors, the way that the Plan will be implemented and other contractual terms.
• A Plan divides creditors into similar classes and groups and provides for the treatment of those classes and groups. The Plan can
impair creditors or leave their rights unchanged.
• The Plan may not unfairly discriminate against classes of creditors, but need not provide identical treatment to every class (for
example, some smaller unsecured claims may be paid 25% of their claims in cash, while larger claims get paid a lesser dividend
over a long time.
• To be approved by the Court, a plan must be accepted by ½ in number and 2/3 in dollar amount of claims that actually vote on
the Plan.
• A Plan must also be feasible.
• If any class of creditor rejects the Plan, the Plan can only be confirmed if it meets certain legal requirements, which include, but
are not limited to:
– At least one impaired class must accept the Plan.
– The Plan must provide creditors with more than they would receive in a Chapter 7 Liquidation.
– If the rejecting class is a class of unsecured creditors, the Plan must not make any distribution to any class with lower priority than the rejecting class.
– The Plan must not unfairly discriminate against any class of creditor.
• If a class of unsecured creditors rejects the Plan, equity cannot retain their ownership interests, and either the Plan is not confirmed,
or the equity interests get sold in some fashion.
© 2020 Butzel LongThe Plan under SBRA
• The Plan can be confirmed without an impaired accepting class.
• Equity can retain its interests even if higher priority creditors reject the Plan.
• Unless creditors accept the Plan, the Plan must provide for all net disposal income
(based on projected income and expenses) for the next 3-5 years to be distributed
to secured and unsecured creditors.
• Only the Debtor may file a Plan (in certain circumstances, in traditional bankruptcy
cases, other parties can file a Plan).
• The Plan must be filed within 90 days of the commencement of the case.
• A Trustee is appointed with certain administrative responsibilities, including
evaluation of the Plan.
© 2020 Butzel LongDetecting Insolvency
• No magic formula
• Preparation for customer or supplier insolvency does not involve any specific formula.
• Key is following best business practices and including regular communication between management, credit and
sales.
• Legal strategies are more effective the further in advance problems are identified.
• Look for:
– Payment delays
– Management changes, employment of consultants
– Lack of communication
– If a public company, delays in filing of financial reports
– Sudden changes in forecasts – building of banks, or the opposite – slowing production
– Cancelation or delay of programs or new orders.
– Layoffs and other departures
– Rumors.
© 2020 Butzel LongConsiderations in Dealing with Insolvent
Companies In the Supply Chain
1. Set objectives for relationship. What is our overriding goal and what are our secondary goals? What (if
anything) are we willing to invest, and what is the risk of our strategy’s failure? Make sure that the goals
are achievable – better some cost than a customer shutdown.
2. Negotiate. Maintain critical production, or create a path to the earliest possible solution.
3. Document the workout with Agreements:
Accommodation, Access, Security, Subordinated Participation, Intercustomer
4. Consider whether agreements work best in or out of court (note, if we are the customer we may not
control this):
a. Court creates enforceable agreements
b. Court also creates expense and unintended consequences
c. Court costs are significant
5. Treat the problem as you would a crisis to your own operations, with a SWAT team [engineers, finance,
legal, inventory, plant, logistics, sales (customer communication)]
6. Pay particular attention to OEM “designated” suppliers: OEM won’t help you if that supplier becomes
insolvent or demands price increases
© 2020 Butzel LongConsiderations for Suppliers –
pre-Bankruptcy
• Be rigorous about keeping customers on terms – not only does this maximize cash on
hand, it limits preference risk if a customer declares bankruptcy.
• If a customer does not stay on terms, establish your SWAT team to address the issues.
Attempt to obtain information from the customer.
• If the customer is insolvent, a supplier can stop delivery on shipments in progress
and/or alter terms to COD or CIA.
• In all cases “get the money” – even if later exposed to preference risk, it is better to
have the money.
• Consider termination of contracts pre-bankruptcy (this could permit price changes,
even in a later bankruptcy case).
• Carefully track PO expiration dates, consider whether to accept new POs.
© 2020 Butzel LongExecutory Contracts – Supplier Side
• Usually, the best result in a bankruptcy case for a supplier is to have their contracts assumed,
or assumed and assigned.
• If the contracts are assumed, the Debtor must promptly cure all arrearages and provide
assurance of future performance.
• If the contracts expire, beware of new contracts, especially those accepted by performance
(acceptance of new contracts could cost you the possibility of assumption).
• If the contracts are rejected, the supplier has no more obligations to the Debtor.
• As a general matter, assumption of an executory contract likely immunizes the supplier from
preference claims.
• Assumption or Rejection of contracts is within the Debtor’s discretion, and (except for leases)
does not have a set time deadline. A creditor cannot force assumption of a contract, except
that (i) the creditor can ask the Court to set a deadline; and (ii) the creditor can and should
use its business leverage to influence the decision.
© 2020 Butzel LongConsideration for Customers –
pre-Bankruptcy
• Identify troubled suppliers as early as possible
• Look for signs of distress
– Quality and delivery problems
– Grumbling from employees/industry gossip/media reports
– Loss of other customers
– Requests for term or price changes or for financial bailout
– Heavy turnover of personnel
– Litigation (involving any customer(s))
– Decreasing profits – no new projects
– Shift of resources towards production for other customers.
© 2020 Butzel LongCustomer Exit
• If things go wrong, can you exit, or are you bound to the
supplier?
– Tooling ownership
– Production Processes and Equipment owned by supplier
– OEM direction
– Ease and timing of exit, possibility of disruption
– Need for a production bank
– Availability of other industry capacity
– Know your contracts, their expiration date and the ability to bind
suppliers
© 2020 Butzel LongCustomer Exit (con’t)
• Do we need to make accommodations to the supplier, short-term
or long? If so, what business needs do we need to fill with any
agreement. Consider:
– Tooling Rights
– Sale Mandates
– Options to Purchase Equipment
– Security Interests for Access
• Adequate Assurance Demands
• Termination of/Modification of Contracts
• Never be the last customer in (which must fund overhead and deal
with personnel departures).
© 2020 Butzel LongAccommodation Agreements
• An Accommodation Agreement is used primarily in the automotive industry. It is an
agreement by a customer or multiple customers between a debtor and usually its lender.
Often the debtor’s principals may be involved.
• An Accommodation Agreement is intended to prevent supply chain disruptions.
• Often customers will provide direct or indirect financial support to troubled suppliers (price
increases, loans, loan participations, shortened trade terms, enhanced protection of lender’s
collateral, agreements to purchase inventory or not setoff against receivables). In exchange
the customer gets continued production, the ability to build production banks, the ability to
resource under appropriate conditions, and other enhanced rights and protections.
• An Accommodation Agreement is often a bridge to a going-concern sale (if the supplier has
an important role in the supply chain), or a customer resourcing. Accommodation
Agreements should not be considered long-term agreements. Companies negotiating
Accommodation Agreements should know that the clock is ticking… the customer wants to
protect production, not to rescue its suppliers at any cost.
© 2020 Butzel LongBeth Gotthelf Mike Wall Max Newman
Butzel Long IHS Markit Butzel Long
248.258.1303 248.728.8400 248.258.2907
gotthelf@butzel.com mike.wall@ihsmarkit.com newman@butzel.com
Q&A
© 2020 Butzel LongDisclaimer
These materials and presentations are intended and
designed for informational purposes only – they do not
provide legal advice and no attorney-client
relationship is created. No liability is assumed in
connection with the use of these materials. Legal
counsel should be consulted regarding how
applicable law impacts specific situations.
© 2020 Butzel LongYou can also read