Bankruptcy and the COVID-19 Crisis - Jialan Wang Jeyul Yang Benjamin Iverson Raymond Kluender - Harvard Business School
←
→
Page content transcription
If your browser does not render page correctly, please read the page content below
Bankruptcy and the COVID-19 Crisis
Jialan Wang
Jeyul Yang
Benjamin Iverson
Raymond Kluender

Working Paper 21-041
Bankruptcy and the COVID-19
 Crisis
 Jialan Wang
 University of Illinois, Urbana-Champaign

 Jeyul Yang
  University of Illinois, Urbana-Champaign

 Benjamin Iverson
 Brigham Young University

 Raymond Kluender
  Harvard Business School

 Working Paper 21-041

Copyright © 2020 by Jialan Wang, Jeyul Yang, Benjamin Iverson, and Raymond Kluender.
Working papers are in draft form. This working paper is distributed for purposes of comment and discussion only. It may
not be reproduced without permission of the copyright holder. Copies of working papers are available from the author.
Funding for this research was provided in part by Harvard Business School.
Bankruptcy and the COVID-19 Crisis∗
        Jialan Wang†          Jeyul Yang‡         Benjamin Iverson§           Raymond Kluender¶

                                             September 2020

                                                 Abstract

      We examine the impact of the COVID-19 economic crisis on business and consumer bankruptcies
      in the United States using real-time data on the universe of filings. Historically, bankruptcies
      have closely tracked the business cycle and contemporaneous unemployment rates. However,
      this relationship has reversed during the COVID-19 crisis thus far. While aggregate filing
      rates were very similar to 2019 levels prior to the severe onset of the pandemic, filings by
      consumers and small businesses dropped dramatically starting in mid-March, contrary to media
      reports and many experts’ expectations. The total number of bankruptcy filings is down by 27
      percent year-over-year between January and August. Consumer and business Chapter 7 filings
      rebounded moderately starting in mid-April and stabilized around 20 percent below 2019 levels,
      but Chapter 13 filings remained at 55-65 percent below 2019 levels through the end of August. In
      contrast to the 2007-9 recession, states with a larger increase in unemployment between April
      and July experienced greater drops in bankruptcies. Although they make up a small share
      of overall bankruptcies, Chapter 11 filings by large corporations have increased since 2019,
      and are up nearly 200 percent year-over-year from January through August. These patterns
      suggest that the financial experiences of consumers, small businesses, and large corporations have
      diverged during the COVID-19 crisis. Large businesses have continued to seek and receive relief
      from the bankruptcy system as they would during a normal recession, and relatively wealthy
      homeowners have on average benefited from the fiscal stimulus and housing moratoria mandated
      by the CARES Act and other policies. However, non-homeowners and small businesses may face
      financial, physical, and technological barriers to accessing the bankruptcy system, especially in
      the areas hardest-hit by unemployment.

      JEL codes: G33, G51, G01, G32
      Keywords: bankruptcy, financial distress, COVID-19

  ∗
     We thank Kate Waldock, Paige Skiba, Bob Lawless, Sasha Indarte, Steven Hamilton, Arpit Gupta, and partic-
ipants at Finance in the Cloud, the Stigler Center, the NBER Summer Institute Household Finance Session, and
discussions in the Bankruptcy & COVID-19 Working Group and on Twitter for useful comments. Filipe Correia,
Denise Han, Calvin Jahnke, and Renhao Jiang have provided outstanding research assistance.
   †
     University of Illinois at Urbana-Champaign
   ‡
     University of Illinois at Urbana-Champaign
   §
     Brigham Young University
   ¶
     Harvard Business School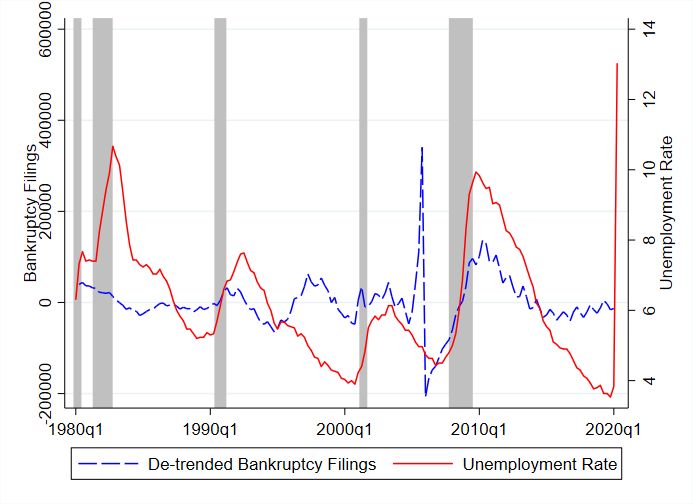
1 Introduction
The COVID-19 pandemic has disrupted normal life and triggered a massive economic slowdown
in the United States, inducing dramatic drops in consumer spending and the highest levels of un-
employment since the Great Depression. The crisis prompted rapid action from Congress and the
Federal Reserve, including a $600 weekly increase to unemployment benefits through the Federal
Pandemic Unemployment Compensation (FPUC) program, $1,200 stimulus checks, and over $1.2
trillion in lending allocated to the Paycheck Protection Program (PPP) and Main Street Lend-
ing program. Meanwhile, numerous state and local governments, federal agencies, and industry
participants have instituted moratoria on evictions and foreclosures and other measures aimed at
forestalling acute financial strain for households and businesses.
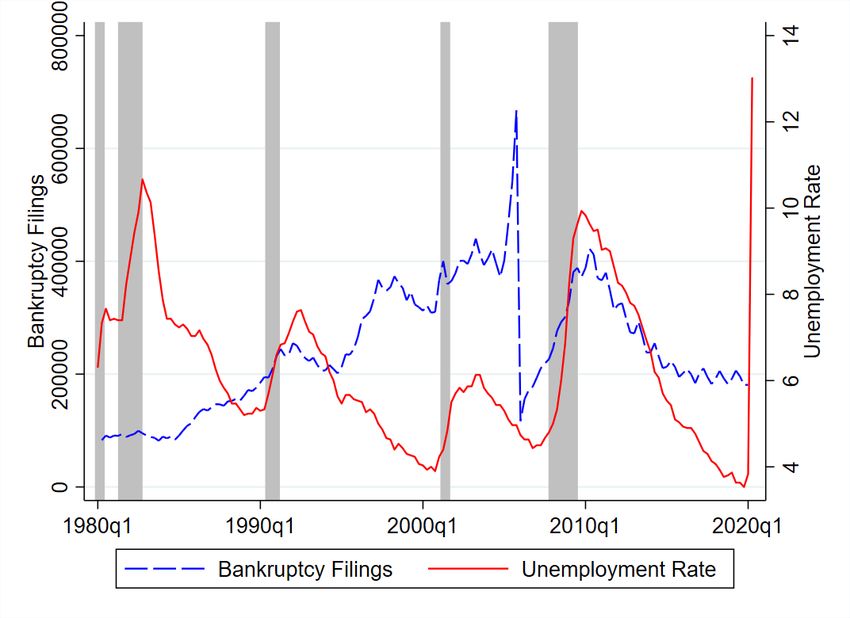
Historically, bankruptcy filings have closely tracked economic conditions as businesses and
households seek relief from macro-economic shocks. Figure 1 plots the time-series of unemployment
rates and bankruptcy filings at the national level, after adjusting the number of bankruptcy filings
for a level shift that occurred after the 2005 Bankruptcy Abuse Prevention and Consumer Protec-
tion Act (BAPCPA) and a general time trend.1 The correlation between the two series is 0.42,
and increases to 0.54 when dropping 2005 due to sharp changes in filing rates around the passage
of BAPCPA. While other factors besides the business cycle affect bankruptcy filing rates, distress
and bankruptcy generally increase as macroeconomic conditions deteriorate, and this relationship
was especially strong during the 2007-2009 recession and subsequent recovery. Historical increases
in unemployment and bankruptcy are largely contemporaneous at the quarterly level, suggesting
that bankruptcy rates would have increased by the second quarter of 2020 under more normal
circumstances.
The unique features of the COVID-19 recession raise questions about what we should expect to
see in the bankruptcy courts. The sheer magnitude of the economic shock suggests the potential
for significant financial distress for both consumers and businesses. Consumer spending, the largest
component of U.S. GDP, declined by more than 30 percent between January and April (Chetty,
1
Specifically, Figure 1 plots the residual number of bankruptcies after removing a post-BAPCPA dummy and
separate linear time trends in the pre- and post-BAPCPA periods. The raw time series of bankruptcy filings, showing
the general increase in filings over time, is included in Appendix Figure A1.
1Friedman, Hendren, Stepner et al., 2020). According to the U.S. Census Pulse surveys, over 50
percent of households experienced income loss between March 13th and July 21st, and 74 percent
of small businesses reported lost revenues between April 26th and May 2nd (U.S. Census Bureau,
2020a,b). However, a robust policy response, increased uncertainty, and challenges accessing the
bankruptcy system may delay or prevent bankruptcy filings.
The massive support implemented by the Families First Coronavirus Act, the Coronavirus
Aid, Relief, and Economic Security (CARES) Act, and other policies in response to the dramatic
shock to economic activity would be expected to mitigate the potential wave of bankruptcy filings
predicted by the rise in unemployment rates. Consumers have received liquidity in the form of
stimulus checks and increased unemployment insurance.2 The Paycheck Protection Program and
the Federal Reserve’s Main Street Lending programs and other facilities have helped to support
bank and bond credit for both large and small businesses. Large-scale forbearance policies and
moratoria on evictions and foreclosures have also aimed to reduce financial distress for businesses
and consumers alike.
Despite these large policy responses, evidence suggests that there is still a large amount of
financial distress in the economy, with 20–30 percent of households experiencing food insecurity,
and only about half of furloughed individuals receiving unemployment insurance benefits as of early
June (Bitler, Hoynes and Schanzenbach, 2020). In addition, there is a large amount of uncertainty
regarding the amount and length of continued government support and the duration and depth of
the ongoing economic slowdown.3 Many potential bankruptcy filers may be waiting for the fog to
clear before filing.
In this paper, we collect real-time information on the universe of bankruptcy filings in the
United States and analyze the impact of the COVID-19 crisis on filing rates. We posit several
potential forces driving changes in bankruptcy filing rates and the implications of these trends for
the bankruptcy system and the financial health of businesses and households. We compare filing
2
Taking into account the $600 increase in weekly unemployment benefits implemented by the CARES Act,
potential replacement rates for lost income are above 100 percent for the median qualifying unemployed worker
(Ganong, Noel and Vavra, 2020). According to the Bureau of Economic Statistics, the personal savings rate reached
a high of 32 percent in April, and personal income grew by 11 percent from March to April.
3
A survey of thousands of small businesses between March 28 and April 4, 2020 found widespread uncertainty
about how long the COVID-19 crisis would last, the policy response, and whether their business would survive
(Bartik, Bertrand, Cullen, Glaeser, Luca and Stanton, 2020).
2rates from January 1st to August 31st of 2020 to the same period in 2019, and use regression
analysis to control for seasonal trends in order to assess the timing and magnitude of changes due
to COVID-19.
As shown in Figure 1, bankruptcies closely tracked contemporaneous unemployment rates during
the last business cycle. However, this relationship has reversed during the COVID-19 crisis so far.
If the historical relationship between the unemployment rate and consumer bankruptcy filings had
continued, we would have expected to see over 200,000 additional consumer filings in the second
quarter of 2020 relative to the second quarter of 2019. Instead, there were about 81,000 fewer
consumer filings year-over-year in the second quarter (see Appendix Table A1). Both consumer
Chapter 7 and 13 filings dropped dramatically starting in mid-March, before their trends diverged.
While consumer Chapter 7 filings initially declined by 34 percent year-over-year from March 15th
to April 30th, they began rebounding in mid-April and have stabilized around a 20 to 30 percent
year-over-year decline from May through August. Consumer Chapter 13 filings did not rebound in
April and have remained at 55-65 percent below 2019 levels through the end of August.
Consistent with media reports, business Chapter 11’s have increased by 35 percent year-over-
year in our sample, and the filings with greater than $50 million in assets have increased by nearly
200 percent. While the news media has focused on the increase in bankruptcy filings by large
corporations, we provide new evidence that bankruptcies among small businesses have declined
during the COVID-19 pandemic so far. Similar to consumer Chapter 7’s, business Chapter 7’s
(which are dominated by small and medium-sized enterprises) have declined by 20 to 30 percent
year-over-year during most of the period from mid-March to the end of August, and are down by
13 percent year-over-year from January through August. By examining the relationship between
year-over-year changes in state unemployment and bankruptcy rates, we find that the negative
relationship between unemployment and bankruptcy during the COVID-19 crisis is true not only
in the time series, as described above, but also in the cross section.
Our findings highlight the fact that bankruptcy plays a very different role for large corporations
as compared to small businesses and consumers. While large corporations may be able to efficiently
turn to bankruptcy as a source of protection, small firms and consumers often only view it as a
last resort and are more likely to avoid filing in the absence of a precipitating event. Thus far,
3the COVID-19 crisis has coincided with a wave of large corporate filings largely driven by sectors
such as retail that were already struggling prior to the pandemic. In contrast, consumer and small
business filings dropped dramatically at the onset of the crisis in mid-March especially in high-
unemployment areas, likely due to a combination of financial, physical, and technological barriers
to accessing the court system and an increase in economic uncertainty. Despite the massive stimulus
measures included in the CARES Act, its enactment on March 27 did not noticeably reverse the
downward trend in filing rates already underway at that time.
Consistent with a significant role of liquidity constraints (Gross, Notowidigdo and Wang, 2014),
both consumer and business Chapter 7 filing rates began rebounding in mid-April as stimulus
payments, enhanced unemployment insurance, and PPP disbursements were rolled out. Chapter
13 filings have historically been associated with housing distress and are less affected by liquidity
constraints, and the widespread mortgage forbearance and foreclosure moratoria put in place during
the COVID-19 crisis have likely played an important role in reducing this filing type. While we
have a limited time series since the expiration of FPUC on July 25th, trends from the month of
August show that all filing types have declined year-over-year relative to the June-July period,
again consistent with the role of stimulus payments in alleviating liquidity constraints and leading
to more rather than fewer bankruptcies so far in 2020.
2 Data
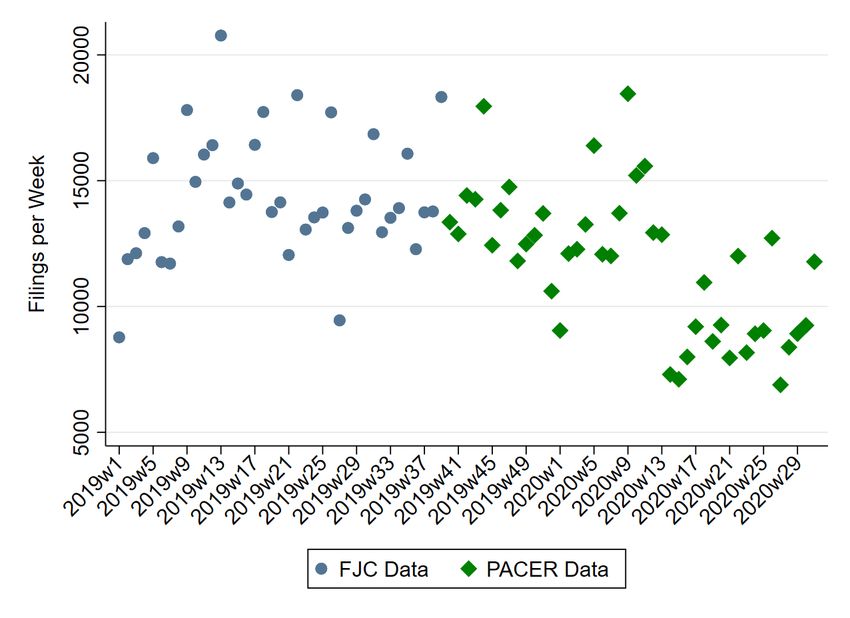
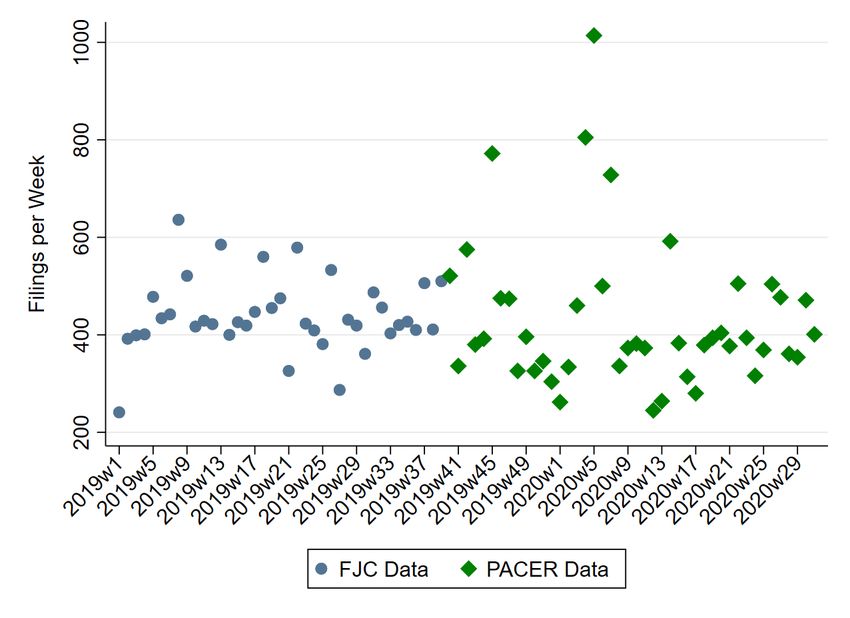
We collect data on the universe of bankruptcy filings in the United States from the Public Access to
Court Electronic Records (PACER) and the Federal Judicial Center (FJC) databases. The PACER
database is operated by the Administrative Office of the U.S. Courts (AOUSC), and provides a
summary of each bankruptcy filing that includes the date, chapter, filer type, and district of filing.
Each bankruptcy appears in PACER within twenty-four hours of filing, and our data is current
through August 31, 2020. To identify large corporate Chapter 11’s, we incorporate data from
New Generation Research (NGR) for the same sample period. The NGR data include all business
filings except those by sole proprietorships, with information about the asset size and industry
classification of debtors.
The FJC database provides information on all U.S. bankruptcy filings beginning in 2008 and
4is updated once a year under a working arrangement with the Administrative Office of the U.S.
Courts.4 The most recent update included data through September 2019, and we use FJC data
for January through September 2019 to provide benchmarks for year-over-year comparisons. To
bring the analysis up to the present, we obtain bankruptcy data from PACER for the period from
October 2019 to August 2020. We provide additional details on the differences between these data
sources along with some validation exercises in Appendix A.
Our analysis focuses on the three most common chapters of bankruptcy filing. Consumer Chap-
ter 7 (“fresh start”) bankruptcy allows an individual to discharge eligible debts and keep exempt
assets without requiring additional repayment out of future income. Chapter 13 (“repayment plan”)
bankruptcy, in contrast, allows a debtor to keep all of their assets, discharge debts above what they
can afford to repay, and repay the remaining debts out of their income over the next five years
according to a plan approved by a bankruptcy judge. Businesses mostly file under Chapter 7 or
Chapter 11. Business Chapter 7 (“liquidation”) bankruptcy requires the sale of all assets of a
business with proceeds used to pay creditors. Chapter 11 (“reorganization”) bankruptcy allows
the debtor to negotiate with lenders to create a reorganization plan so that the distressed business
can continue to operate; nearly all reorganization plans involve a restructuring of the liabilities and
equity of the firm, often including asset sales as part of the bankruptcy terms. While Chapter 11
is designed to allow for reorganization, historically about two-thirds of business Chapter 11 cases
are either converted to Chapter 7 or dismissed from court entirely (Iverson, 2017).
3 Methods and Results
Our main empirical objective is to document the effect of the COVID-19 pandemic and economic
crisis on bankruptcy filings. In our main analysis, we use 2019 filing rates as the counterfactual,
and also compare these results to historical benchmarks below.
Table 1 computes simple year-over-year changes in nationwide bankruptcy filings by the type
and chapter of filing for five time periods and the year to date using filings from FJC and PACER.
While media reports have focused on the record number of filings among corporations with more
4
The database is publicly available at https://www.fjc.gov/research/idb/bankruptcy-cases-filed-terminated-and-
pending-fy-2008-present
5than $1 billion in assets and spikes in filings among retail and dining firms (e.g., Mathurin et al.,
2020), overall bankruptcy filings are down by 27 percent (138,912 filings) relative to 2019.5 This
decline is driven by a 28 percent year-over-year decline in consumer filings, while the increase in
business Chapter 11’s is roughly offset by a decrease in business Chapter 7’s. As shown in the
last few rows of the table, business Chapter 11’s have increased by 35 percent year-over-year in
our sample, consistent with media reports. This trend is particularly striking for large businesses.
Filings with greater than $50 million in assets have increased by nearly 200 percent year over year.
Nonetheless, the media narrative describing a “tidal wave” of bankruptcies does not apply to the
vast majority of filing types.
The large decline in consumer filings is particularly surprising when compared to the rise in
filings that would be expected based on past relationships between unemployment and bankruptcy
rates. Based on the unemployment numbers through the second quarter, after adjusting for the fact
that much of that unemployment was temporary, we would have expected a year-over-year increase
of over 200,000 additional consumer bankruptcy filings in the second quarter alone.6 Instead, there
were more than 81,000 fewer consumer filings in Q2 (see Appendix Table A1), and nearly 139,000
fewer year-over-year between January and August.
Business filings similarly diverge from a forecast based on unemployment. Given unemployment
numbers in the second quarter, we would have expected approximately 5,500 additional business
filings in this time period relative to 2019. Instead, Appendix Table A1 shows there were 645 fewer
business filings in the second quarter of 2020. The drop in business bankruptcies is particularly
striking given reports of widespread permanent business closure. Gole and Shapiro (2020) estimate
that roughly 73,000 businesses on Yelp have permanently closed during the pandemic.7 Historically,
8.4 percent of businesses that permanently close file for bankruptcy, based on business closure
statistics from the Census Bureau’s Business Dynamics Statistics (U.S. Census Bureau, 2019).8
5
See Appendix Figure A3 for year-over-year changes in Chapter 11 filings by industry, which are consistent with
media reports.
6
See Appendix B for details on how we estimated this projection, which is based on Iverson et al. (Forthcoming).
7
This is likely to be a lower bound as it is drawn only from businesses on Yelp. Steven Hamilton estimated that
approximately 430,000 businesses may have closed permanently based on an estimate of 12.9 percent businesses that
have closed in 2020 through July 10th from Womply (Chetty et al., 2020) with an estimated 55 percent of those
businesses closing permanently (Gole and Shapiro, 2020).
8
Bankruptcy filing statistics from LexisNexis public records searches show that, from 2001 - 2017, 74 percent of
all business Chapter 11 cases ended in the case being dismissed from court or converted to Chapter 7. We assume
6Based on estimated business closures in Yelp alone, we would have expected at least 300 additional
business filings over and above the 5,799 in the second quarter of 2019.
We estimate daily panel regressions to pinpoint the dynamics of these changes in bankruptcy
filing rates as they relate to the evolution of the pandemic and subsequent policy responses. Specif-
ically, we first compute the number of nationwide bankruptcy filings of each type on each day
of our sample period from January 1, 2019 to August 31, 2020. We then partial out intraweek,
intramonth, and seasonal variation with fixed effects for day of the week, day of the month, month
of the year, and the New Year’s and Memorial Day work holidays.
Bankruptcy filings in 2019 determine the counterfactual and pin down the recurring variation
in these regressions. We estimate daily changes in bankruptcy filings in 2020 using separate day
indicators for each calendar day t with the following specification:
8/31/2020
X
yt = α + βτ · 1{t = τ } + γdow + γdom + γmonth + γholiday + εt , (1)
τ =1/1/2020
where γdow , γdom , γmonth , and γholiday are day-of-the-week, day-of-the-month, month-of-the-year,
and work holiday fixed effects, respectively. The dependent variable throughout is the log total
number of bankruptcy filings per day, split by the chapter of the filing and whether the filing is a
consumer or business case. We are interested in the β̂τ coefficients, which estimate differences in
bankruptcy filings in 2020 relative to 2019 after partialing out recurring calendar variation.
We plot these results in Figure 2. The β̂τ coefficients prior to the severe onset of the pandemic
in the United States allow us to assess whether 2019 is a reasonable counterfactual for the 2020
filings. For all chapters and both consumer and business filings, 2019 filing rates appear to be a
reasonable counterfactual for those in 2020. As shown in the figure, there are no systematic pre-
trends in either total consumer or business filings, or filings by chapter and filer type in advance of
the National Emergency declared on March 13, 2020. These trends are also clearly observable in
the raw data as presented in Appendix Figure A2, albeit with more seasonal and intramonth noise.
Business filings are rarer and noisier, but business Chapter 7 filings roughly follow similar trends
as consumer Chapter 7 filings throughout the year to date. Business Chapter 11 filings are even
all of these cases end in business closure, as well as all business Chapter 7 cases. Using this as the numerator, we
calculate that in an average year from 2000 - 2016 8.4 percent of all firm exits occurred via bankruptcy.
7less common, making daily analysis more difficult to interpret, but we show them in panel (f) for
completeness. Given that we do not include a dummy variable for 2020, the point estimates near
zero up to mid-March for all filing types except business Chapter 11 show that both the level and
trends of these bankruptcy filings remained consistent with 2019 prior to the onset of the COVID-19
crisis. Consistent with the lack of pre-trends, column (1) of Table 1 shows that total bankruptcies
only changed by -0.1 percent (100 filings) year-over-year between January 1st and March 14th, and
was less than 10 percent for all filing types except for business Chapter 11.
In contrast to the period from January to mid-March, total bankruptcies declined by 38 per-
cent year-over-year from March 15 through April 30 following the escalation of the pandemic and
economic crisis in the United States. During this period, a number of bankruptcy courts either
ceased in-person hearings or substantially modified their procedures to mitigate public health risks
and comply with statewide and federal judicial orders.9 The decline in overall bankruptcies has
persisted, with filings down 27 percent year-over-year from January through August.
When breaking down the initial drop in filings by chapter and filer type, we find that consumer
Chapters 7 and 13 and business Chapter 7 all fell by between 30 and 49 percent in the initial
period between March 15th and April 30th, with consumer Chapter 13 falling the most. Both
consumer and business Chapter 7 filings began rebounding in mid-April, stabilizing around 10 to
20 percent below 2019 levels by mid-May. However, filing rates have declined somewhat in August,
coincident with the expiration of FPUC payments and other relief measures. In contrast to Chapter
7, consumer Chapter 13 filings continued to decline through late spring and stabilized between 55
and 65 percent below 2019 levels.
There are several key differences between Chapter 7 and 13 for consumers that could be driving
their divergence during the COVID-19 economic crisis. Chapter 7 filers have lower income and
fewer assets, and must generally pay filing fees in full at the time of filing, while Chapter 13 filers
may roll their court and legal fees into their repayment plan. Chapter 13 filings are also more
complex and require more involvement both from bankruptcy attorneys and bankruptcy judges.
9
The most common changes include the suspension of all in-court hearings, postponement of Section 341
meetings, and the waiver of wet signatures on court documents. Most courts that moved to telephonic hear-
ings did so between March 16th and March 23rd. Court orders related to COVID-19 are available at: https:
//www.uscourts.gov/about-federal-courts/court-website-links/court-orders-and-updates-during-covid19-pandemic
8We discuss these differences in more depth the next section.
To potentially shed light on the mechanisms behind the decline in consumer and small business
bankruptcy filings, we next turn to the cross-sectional relationships between changes in bankruptcies
and unemployment at the state level. As described above, bankruptcy rates decreased significantly
as unemployment skyrocketed starting in March, counter to the historical correlation. This negative
correlation doesn’t have to hold in the cross section. Even if other factors such as physical disruption
of the court system caused the initial drop in filings, it could still be the case that states that
experienced larger unemployment shocks saw a smaller decline in filings.
We show scatter plots of the relationship between unemployment and bankruptcy rates on a
state level in Figure 3. For these plots, we compute the average of the monthly unemployment rates
for April through July of 2019 and 2020, and compute the year-over-year percentage point change
in these average unemployment rates for each state. We conduct the same exercise for cumulative
bankruptcy filings between April and July of each year to compute the year-over-year percentage
change in bankruptcy rates for each filing type. Regression lines weighted by state population are
also shown in each graph. For consumer Chapter 7 and 13 bankruptcies, it is clear that states
with larger increases in unemployment have seen larger declines in bankruptcies.10 The reversal
of the historical relationship is surprising, and suggests that special circumstances in the COVID-
19 crisis are suppressing consumer bankruptcy filings in the hardest-hit areas, at least for now.
Meanwhile, panels (c) and (d) show that the negative relationship also applies to business Chapter
7 and 11 filings, although the slope estimates are more noisily estimated.11 These relationships
contrast strikingly with those during 2007-9 recession, which show strong positive cross-sectional
correlations between unemployment and bankruptcy filings (Appendix Figure A4).
Table 2 shows how consumer bankruptcy rates have evolved over the course of 2020 for higher
vs. lower-unemployment states. The table splits states into quintiles by the year-over-year change
in the average unemployment rate between April and July, and presents the year-over-year changes
in consumer bankruptcy filings by chapter within each quintile. During the initial onset of the
10
While Nevada and Hawaii are outliers in Figure 3, dropping them actually increases the negative relationship
between unemployment and bankruptcy, both in terms of economic magnitude and in statistical significance.
11
The courts with the largest increases in Chapter 11 cases are those that are known to attract the largest corporate
cases, such as Delaware, New York, Houston, and, more recently, Eastern Virginia.
9COVID-19 crisis between mid-March and the end of April, consumer Chapter 7 filings dropped by
29 percent in the lowest unemployment quintile, and Chapter 13 filings dropped by 40 percent in
that quintile. In contrast, Chapter 7 filings dropped by 41 percent and Chapter 13 filings dropped
by 61 percent in the highest-unemployment quintile. This gap has narrowed over time, especially
for Chapter 7 filings. In August, the lowest-unemployment quintile experienced a 29 percent year-
over-year decline in Chapter 7 filings and a 58 decline in Chapter 13 filings, while these declines
were 27 percent and 70 percent for the highest-unemployment quintile.
4 Discussion
We document five key facts about bankruptcy during the COVID-19 crisis. First, corporate Chapter
11 filings have increased year-over-year throughout 2020, a trend that is particularly dramatic for
the largest businesses and the retail and restaurant sectors (see Appendix Figure A3). Second,
in contrast with business Chapter 11, all other major types of filings – consumer Chapters 7 and
13 and business Chapter 7 – were on trend from 2019 prior to the severe onset of the COVID-19
pandemic and dropped significantly starting in mid-March, a drop that has persisted through the
end of August. Third, while both consumer and business Chapter 7 filings rebounded from mid-
April through mid-July, consumer Chapter 13 filings remained at 55 to 65 percent below 2019 levels
through August. Fourth, while the rebound in Chapter 7 filings reached close to 2019 levels by
mid-July, they declined again between mid-July and the end of August. Finally, in the cross section,
states that experienced the largest increases in unemployment during the spring and summer saw
the greatest declines in bankruptcy. The gap between high and low unemployment states was
widest in March and April and closed moderately over time.
These five key facts are surprising given the historically positive correlations between unemploy-
ment and bankruptcy rates both in the time series and cross section. Clearly, no single explanation
can account for these striking trends. However, we discuss what we believe are the most likely
set of explanations below. The first fact is the least surprising, and is consistent with financial
distress and restructuring among large firms in retail and other sectors that both predate and were
exacerbated by the COVID-19 crisis.
The dramatic decline in consumer and small business bankruptcies following the declaration of
10a national emergency on March 13th could be driven by a variety of factors. One reason for the
initial decline in filings is state and local social distancing policies, which include shutdowns and
changes in procedures within the court system. Approximately 55 of 94 United States Bankruptcy
Courts moved to telephonic hearings between March 13 and April 1, 2020, with some shutting down
physically and/or experiencing outbreaks.
The changes in court operations may have made it particularly difficult for vulnerable popula-
tions such as the recently-furloughed and poorer and rural filers to access the bankruptcy system,
since updated filing rules often made it more difficult to file without an attorney and/or internet
access, and wet signatures on printed documents were more difficult to obtain during the pandemic
(Skiba, Jiménez, Miller, Foohey and Greene, 2020). Foot traffic to bankruptcy attorney offices
has also likely declined, and may disproportionately decrease “supply-driven” Chapter 13 filings
relative to “demand-driven” Chapter 7 filings (Lawless, 2013). In addition to physical and tech-
nological barriers to filing, the initial onset of the COVID-19 crisis was associated with dramatic
increases in unemployment and slow functioning of the unemployment insurance system, leaving
many households and businesses without income support for the first several months. As shown
by Gross, Notowidigdo and Wang (2014) and others, liquidity constraints are a major barrier to
filing, so this factor may have contributed to the initial decline prior to the implementation of the
CARES Act and other relief measures.
An additional explanation for the initial decline in filings is that the COVID-19 shock caused
a great deal of economic uncertainty for households and businesses, and some may delay filing
until the severity and duration of the crisis become more clear. Households are only allowed to
file for Chapter 7 bankruptcy once every eight years and Chapter 13 once every two years (Gross,
Kluender, Liu, Notowidigdo and Wang, 2020), so some who might benefit from bankruptcy may
nonetheless delay due to the option value of filing in the future (White, 1998). This option value
may be even greater for small businesses, which are very likely to be liquidated if they file for
bankruptcy (Morrison, 2007).
While the enactment of the CARES Act on March 27 should have decreased uncertainty to some
extent regarding the level and nature of federal aid, we find no noticeable change in the downward
trend in filing rates already underway at that time. However, the onset of stimulus payments and
11other forms of relief mandated by the CARES Act and other policies coincided with the rebound
in consumer and business Chapter 7 filings, and the divergence in trends between Chapter 7 and
13 filing rates.
As shown in Figure 2 and Table 1, Chapter 7 filings began rebounding within a few days of the
April 15 disbursement of the $1,200 stimulus checks, a rebound that persisted through mid-July
as other relief measures such as PPP and the FPUC were rolled out. Thus, bankruptcy rates
surprisingly increased in the time series as households and businesses received more aid. This
pattern is again consistent with the importance of binding liquidity constraints and the use of
stimulus payments to pay for court fees, which disproportionately affect Chapter 7 filings since
Chapter 13 filing fees can be rolled into the repayment plan (Gross, Notowidigdo and Wang, 2014).
Why did Chapter 7 filings rebound while Chapter 13 filings remained at less than half of 2019
levels through the end of August? Chapter 13 filers are more likely to be wealthier and to own
substantial assets, and housing-related distress is a common trigger for these filings (Li, White and
Zhu, 2011). After the initial decline in aggregate bankruptcies in March, the CARES Act mandated
a federal mortgage moratorium (Jones and Scott, 2020), and many states have additionally placed
moratoria on evictions (Princeton Eviction Lab, 2020).12 Given that liquidity constraints and
other barriers to filing are also less likely to bind for potential Chapter 13 filers, the large and
persistent decline in this filing type suggests that the numerous forms of federal, private, and local
mortgage relief have played a significant role in moderating bankruptcy filings for homeowners. The
much larger and more sustained decline in Chapter 13 relative to Chapter 7 filings also hints that
wealthier homeowners may have enjoyed greater overall financial benefits from the various forms
of relief than non-homeowners or small businesses facing liquidation.
Despite the rebound in Chapter 7 filing rates described above that persisted up to mid-July, our
aggregate finding is that all filing types other than business Chapter 11 are well below 2019 levels
year-over-year. The persistent decline in filing rates is consistent with other indicators of reduced
financial distress driven by massive federal aid and other types of relief efforts. The CARES Act
included $300 billion in stimulus checks and $260 billion in increased unemployment benefits, which
12
Many eviction bans were extended to commercial properties as well. See, for example:
https://www.mccarter.com/insights/several-northeast-mid-atlantic-states-address-commercial-evictions-during-
covid-19-pandemic/
12were associated with a median income replacement rate of 134 percent for those able to claim this
benefit (Ganong, Noel and Vavra, 2020). The personal savings rate hit a 60 year peak of 33.5
percent in April 2020 (U.S. Bureau of Economic Analysis, 2020), and the share of credit card
balances 60 or more days past due declined by 30 percent from February to August 2020 (Equifax,
2020). On the small business side, the Paycheck Protection Program (PPP) provided $518 billion
in support to businesses early in the pandemic.13 These and less-publicized relief measures enacted
by localities and industry participants have no doubt helped reduce demand for bankruptcy among
some households and small businesses.
However, the divergence between Chapter 7 and Chapter 13 filing rates provide suggestive evi-
dence that the severity of the economic crisis and the degree of relief offered by policy measures have
not been shared equally among households and businesses facing financial distress. While those
who qualify and succeed in receiving unemployment insurance benefits have seen their net incomes
rise on average, many households have had difficulty accessing unemployment insurance benefits
(e.g., Schulze, 2020). Only about half of furloughed individuals were receiving unemployment insur-
ance benefits as of early June, and 20–30 percent of households were experiencing food insecurity
(Bitler, Hoynes and Schanzenbach, 2020). Households that experienced delays in obtaining their
benefits consumed 20 percent less than in normal times (Farrell, Ganong, Greig, Liebeskind, Noel
and Vavra, 2020).
In light of Congressional gridlock over the next round of federal aid, many observers have
predicted a renewed wave of bankruptcy upon the expiration of many of the CARES Act’s key
provisions in late July and August. However, we show that during the month of August, all forms
of bankruptcy dropped year-over-year relative to the June 15 to July 31 period. Although consumer
and business Chapter 7 filings rebounded consistently between mid-April and mid-July, this trend
reversed in August, consistent with a positive overall time-series correlation between the intensity
of federal aid and Chapter 7 filing rates, and the importance of liquidity constraints. This positive
relationship hints that financial distress may remain quite prevalent despite massive federal aid,
13
Autor, Cho, Crane, Goldar, Lutz, Montes, Peterman, Ratner, Villar and Yildirmaz (2020) estimate that the
PPP increased aggregate employment by 2.3 million through mid-July. Chetty, Friedman, Hendren, Stepner et al.
(2020) find similar effects on employment. Granja, Makridis, Yannelis and Zwick (2020) present early evidence that
PPP helped small businesses build up liquidity and meet obligations, though Bartlett and Morse (2020) finds that
this benefit is limited to microbusinesses.
13but that many consumers and businesses face barriers to obtaining relief through the bankruptcy
system.
The final key fact we establish in this paper is that not only did bankruptcy rates decline at the
onset of an unprecedented economic crisis, but that the states hardest-hit by rising unemployment
rates experienced the largest declines in filing rates. As shown in Table 2, the gap between high-
and low-unemployment states was largest during the March to April period and narrowed over
time as federal relief efforts were rolled out, but remained persistent throughout our sample period.
Given that this gap arose prior to the implementation of major relief efforts and narrowed over
time, this evidence supports the interpretation that much of the decline in bankruptcy at the onset
of the crisis was not due to the alleviation of financial distress by federal aid. Rather, this pattern
suggests that the consumers and businesses hardest-hit by unemployment were less able to access
bankruptcy protection.
5 Conclusion
Our research contributes to the growing body of work studying the impacts of the COVID-19 crisis
on the U.S. economy. We document large and persistent declines in bankruptcy rates for both
households and small businesses after the onset of the crisis in mid-March, in a surprising reversal
of the close historical relationship between bankruptcy and unemployment rates in both the time
series and cross section. While some of this decline is likely to be attributable to the substantial
aid offered by federal, local and private relief efforts, we also find evidence consistent with barriers
to accessing the bankruptcy system and holes in the social safety net. The patterns we document
suggest that large businesses, homeowners, and renters and small businesses are experiencing very
different effects of the crisis and disparate levels of relief from policy measures.
A unique feature of our study in understanding not only the bankruptcy system but the econ-
omy as a whole is that we observe a consistent time series of the universe of all bankruptcy filings.
Although the bankruptcy system reflects the many forces affecting the economy during the COVID-
19 crisis in complex ways, our work has the advantages of granular real-time analysis while being
free from the sample selection bias that is present in other studies using private-sector or other
unrepresentative sources. Future versions of this paper will continue to update these results and
14leverage cross-sectional variation in exposure to the various forces described above to further disen-
tangle the mechanisms behind the trends in bankruptcy filings and the implications for the overall
U.S. economy.
15References
Autor, David, David Cho, Leland D Crane, Mita Goldar, Byron Lutz, Joshua Montes,
William B Peterman, David Ratner, Daniel Villar, and Ahu Yildirmaz, “An Evaluation
of the Paycheck Protection Program Using Administrative Payroll Microdata,” MIT Working
Paper, 2020.
Bartik, Alexander W, Marianne Bertrand, Zoe Cullen, Edward L Glaeser, Michael
Luca, and Christopher Stanton, “The impact of COVID-19 on small business outcomes and
expectations,” Proceedings of the National Academy of Sciences, 2020, 117 (30), 17656–17666.
Bartlett, Robert P. and Adair Morse, “Small Business Survival Capabilities and Policy Ef-
fectiveness: Evidence from Oakland,” Working Paper, 2020.
Bitler, Marianne, Hilary Hoynes, and Diane Whitmore Schanzenbach, “The social safety
net in the wake of COVID-19,” Brookings Paper on Economic Activity Conference Drafts, June
2020.
Chetty, Raj, John N Friedman, Nathaniel Hendren, Michael Stepner et al., “How Did
COVID-19 and Stabilization Policies Affect Spending and Employment? A New Real-Time Eco-
nomic Tracker Based on Private Sector Data,” National Bureau of Economic Research Working
Paper #27431, 2020.
Equifax, “Credit Trends Portfolio: Total Consumer Debt,” Technical Report August 2020.
Farrell, Diana, Peter Ganong, Fiona Greig, Max Liebeskind, Pascal Noel, and Joseph
Vavra, “Consumption Effects of Unemployment Insurance during the COVID-19 Pandemic,”
Working Paper, July 2020.
Ganong, Peter, Pascal J Noel, and Joseph S Vavra, “US Unemployment Insurance Re-
placement Rates During the Pandemic,” National Bureau of Economic Research Working Paper
#27216, 2020.
Gole, Daniel and Amy Shapiro, “Increased Consumer Interest in May Correlates with COVID-
19 Hot Spots in June, According to the Yelp Economic Average,” Technical Report, Yelp 2020.
Granja, João, Christos Makridis, Constantine Yannelis, and Eric Zwick, “Did the Pay-
check Protection Program Hit the Target?,” Working Paper 27095, National Bureau of Economic
Research May 2020.
Gross, Tal, Matthew J Notowidigdo, and Jialan Wang, “Liquidity Constraints and Con-
sumer Bankruptcy: Evidence from Tax Rebates,” Review of Economics and Statistics, 2014, 96
(3), 431–443.
, Raymond Kluender, Feng Liu, Matthew J Notowidigdo, and Jialan Wang, “The Eco-
nomic Consequences of Bankruptcy Reform,” National Bureau of Economic Research Working
Paper #26254, 2020.
Iverson, Benjamin, “Get in Line: Chapter 11 Restructuring in Crowded Bankruptcy Courts,”
Management Science, 2017, 64 (11), 5370–5394.
16Iverson, Benjamin Charles, Jared A Ellias, and Mark J Roe, “Estimating the Need for
Additional Bankruptcy Judges in Light of the COVID-19 Pandemic,” Harvard Business Law
Review, Forthcoming.
Jones, Katie and Andrew P Scott, “Mortgage Provisions in the Coronavirus Aid, Relief, and
Economic Security (CARES) Act,” Congressional Research Service, April 2020, p. 3.
Katz, Lawrence F and Bruce D Meyer, “The impact of the potential duration of unemploy-
ment benefits on the duration of unemployment,” Journal of public economics, 1990, 41 (1),
45–72.
Lawless, Robert M, “Does Chapter 13 Prop Up Bankruptcy Filing Rates?,” Credit Slips: A
Discussion on Credit, Finance, and Bankruptcy, 2013.
Li, Wenli, Michelle J White, and Ning Zhu, “Did Bankruptcy Reform Cause Mortgage
Defaults to Rise?,” American Economic Journal: Economic Policy, 2011, 3 (4), 123–47.
Mathurin, Patrick, Ortenca Aliaj, and James Fontanella-Kahn, “Pandemic triggers wave
of billion-dollar US bankruptcies,” Financial Times, August 2020.
Morrison, Edward R, “Bankruptcy decision making: an empirical study of continuation bias in
small-business bankruptcies,” The Journal of Law and Economics, 2007, 50 (2), 381–419.
Princeton Eviction Lab, “COVID-19 Housing Policy Scorecard,” Technical Report, Princeton
Eviction Lab 2020.
Schulze, Elizabeth, “Millions can’t access unemployment benefits so actual job losses are likely
greater than data shows,” CNBC, April 2020.
Skiba, Paige Martin, Dalié Jiménez, Michelle McKinnon Miller, Pamela Foohey, and
Sara Sternberg Greene, “Bankruptcy Courts Ill-Prepared for Tsunami of People Going Broke
from Coronavirus Shutdown,” The Conversation, May 2020.
U.S. Bureau of Economic Analysis, “Personal Saving Rate [PSAVERT], retrieved from FRED,
Federal Reserve Bank of St. Louis,” Technical Report August 2020. Available at https://fred.
stlouisfed.org/series/PSAVERT.
U.S. Bureau of Labor Statistics, “Table A-11. Unemployed persons by reason for unem-
ployment,” Technical Report, U.S. Bureau of Labor Statistics August 2020. Available at
https://www.bls.gov/news.release/empsit.t11.htm.
U.S. Census Bureau, “Business Dynamics Statistics (BDS),” Technical Report, U.S. Census
Bureau 2019. Available at https://www.census.gov/programs-surveys/bds.html.
, “Household Pulse Survey,” Technical Report, U.S Census Bureau 2020. Available at https:
//www.census.gov/data-tools/demo/hhp/#/.
, “Small Business Pulse Survey Data,” Technical Report, U.S Census Bureau 2020. Available at
https://portal.census.gov/pulse/data/.
White, Michelle J, “Why Don’t More Households File for Bankruptcy?,” Journal of Law, Eco-
nomics, & Organization, 1998, pp. 205–231.
17Figure 1. De-Trended Bankruptcy Filings and Unemployment Rates
Notes: The figure presents the time-series of quarterly U.S. bankruptcy filings and the unem-
ployment rate. Bankruptcy filings have been adjusted for a level shift in the number of filings
after the 2005 bankruptcy reform as well as a time trend. Shading reflects NBER recessions.
Source: U.S. Courts Filing Statistics; BLS.
18Figure 2. Year-over-Year Change in Daily Bankruptcy Filings (2019-2020)
(a) Consumer (b) Business
(c) Consumer Chapter 7 (d) Consumer Chapter 13
(e) Business Chapter 7 (f) Business Chapter 11
Notes: The sample consists of bankruptcy filings reported by the FJC (January - August 2019) and PACER
(January - August 2020). The points represent estimates of the βτ coefficients in equation (1). The dashed
lines provide the 95-percent confidence interval for each point estimate. The dependent variable in each panel
is log daily bankruptcy filings for the specified type of filing. The vertical lines represent the dates of the
first confirmed U.S. COVID-19 infection (January 20), the declaration of a national emergency (March 13),
the enactment of the CARES Act (March 27), and the date most of the CARES Act stimulus payments were
deposited (April 15).
19Figure 3. State-level Unemployment and Bankruptcy Filings
(a) Consumer Chapter 7 (b) Consumer Chapter 13
(c) Business Chapter 7 (d) Business Chapter 11
Notes: The figure shows year-over-year changes in bankruptcy filing rates and unemployment levels in the
four months between April through July of 2019 and 2020. To calculate unemployment rate changes, monthly
unemployment rates in the four months are averaged for each state. Then, percent point differences in state
unemployment rates between 2019 and 2020 are used to obtain year-over-year changes. Year-over-year percent
changes in bankruptcy filings are calculated for each state for the April through July period. Fitted lines are
weighted by state population. Slopes (p-values) are -0.77 (0.084), -1.97 (0.001), -5.85 (0.138), and -6.90 (0.228)
for consumer chapter 7 and 13, and business chapter 7 and 11, respectively. Bankruptcy filings come from FJC
(April - July 2019) and PACER (April - July 2020). Unemployment rates are from BLS.
20Table 1. Year-over-Year Change in Bankruptcy Filings (2019-2020)
(1) (2) (3) (4) (5) (6)
Jan 1 Mar 15 May 1 Jun 15 Aug 1 YTD
- Mar 14 - Apr 30 - Jun 14 - Jul 31 - Aug 31
Total -100 -43,197 -39,945 -28,773 -26,897 -138,912
(-0.1%) (-38%) (-42%) (-30%) (-41%) (-27%)
Consumer -806 -42,621 -39,645 -29,100 26,649 -138,821
(-0.6%) (-39%) (-42%) (-31%) (-42%) (-28%)
Business 706 -576 -300 327 -248 -91
(16%) (-20%) (-11%) (13%) (-14%) (-1%)
Consumer Ch7 -62 -24,919 -17,127 -9,866 -11,336 -63,310
(-0.1%) (-34%) (-29%) (-17%) (-29%) (-20%)
Consumer Ch13 -675 -17,620 -22,441 -19,187 -15,283 -75,206
(-1%) (-49%) (-65%) (-56%) (-62%) (-41%)
Business Ch7 248 -572 -466 -126 -281 -1,197
(9%) (-30%) (-27%) (-8%) (-24%) (-13%)
Business Ch11 384 100 283 418 113 1,298
(32%) (15%) (39%) (65%) (25%) (35%)
Assets > $50 mil. 184 286 325 425 155 1,375
(53%) (353%) (244%) (417%) (330%) (194%)
Notes: The table presents year-over-year changes in nationwide bankruptcy filings between 2019 and
2020. The sample consists of bankruptcy filings reported by the FJC (January - August 2019) and
PACER (January - August 2020). Business chapter 11 filings for firms with more than $ 50 million
in assets come from New Generation Research (NGR), which excludes bankruptcy cases filed by sole
proprietorships.
21Table 2. Year-over-Year Change in Bankruptcies by Unemployment Quintile
(1) (2) (3) (4) (5) (6) (7)
YOY ∆ in Jan 1 Mar 15 May 1 Jun 15 Aug 1 YTD
Unemployment - Mar 14 - Apr 30 - Jun 14 - Jul 31 - Aug 31
Lowest 5%
Ch7 -3% -29% -25% -17% -29% -19%
Ch13 3% -40% -60% -53% -58% -36%
Quintile 2 5.8%
Ch7 -2% -28% -29% -18% -34% -20%
Ch13 4% -44% -64% -53% -61% -38%
Quintile 3 7%
Ch7 -1% -26% -23% -13% -30% -17%
Ch13 1% -41% -60% -49% -61% -36%
Quintile 4 8.7%
Ch7 2% -32% -24% -15% -28% -18%
Ch13 -2% -50% -63% -54% -58% -40%
Highest 11.6%
Ch7 0.4% -41% -36% -19% -27% -23%
Ch13 -7% -61% -74% -65% -70% -48%
Notes: The table presents percent changes in the number of consumer bankruptcy filings for each quin-
tile of states sorted by the percentage change in the state unemployment rate. Monthly unemployment
rates from April to July are averaged for 2019 and 2020 to compute the year-over-year percentage point
changes for each state. Population-weighted unemployment changes for each quintile are presented in
column 1. Bankruptcy filings come from FJC (January - August 2019) and PACER (January - August
2020). Unemployment rates are from BLS.
22A Data
We collect data on bankruptcy filings from Public Access to Court Records (PACER), the Federal
Judicial Center (FJC) Integrated Database, and New Generation Research (NGR). We addition-
ally collect business filings from the electronic case management system of each bankruptcy court.
PACER and FJC databases are administered by the Administrative Office of the United States
Courts (AOUSC), which also publishes aggregate bankruptcy filings quarterly for each chapter of
filing and additionally split by business and consumer filings. To identify large business Chap-
ter 11 filings, we incorporate data from NGR, which includes all business filings except those by
sole proprietorships, with information about the asset size and industry classification of corporate
debtors.
While all data sources are derived from the same underlying records, there are subtle differences
in the way each data source compiles and filters the filings. To assess the extent of these variations,
we compared the number of FJC filings to the official AOUSC statistics for all districts and quarters
from 2019Q1 to 2019Q3. Among 267 district-quarters, 265 district-quarters had a less than 5
percent difference between the FJC and AOUSC statistics, and the number of filings for all 267
district-quarters differed by less than 10 percent across the data sources. We perform a similar
exercise for the PACER filings from 2019Q4 through 2020Q1. In 178 district-quarters, the number
of filings for 167 district-quarter differed by less than 5 percent. The total number of filings for all
districts differed by less than 1.5 percent in both 2019Q4 and 2020Q1. Appendix Table A1 shows a
comparison between the published AOUSC statistics and the combined FJC and PACER dataset
we use for our main analysis, and shows that the total counts are very similar in aggregate and for
each subcategory.
B Benchmarking methodology
We estimate two counterfactuals which recognize that the economic conditions induced by the pan-
demic would, in normal times, translate to a considerable increase in the number of bankruptcy
filings. We perform a simple forecasting exercise that estimates the number of consumer and
business bankruptcy filings we would have expected to see during the pandemic based on histor-
ical relationships between the unemployment rate and bankruptcy filings, following Iverson et al.
(Forthcoming). Using quarterly data for each bankruptcy court district separately, we calculate the
correlation between local unemployment rates and bankruptcy filings from 2001 to 2019. We then
take the average national unemployment rate in the second quarter of 2020 of 13.03 percent14 , and
estimate the number of bankruptcy filings we would expect in each court if the court experienced
a 13 percent unemployment rate.
From this baseline number, we make two adjustments. First, we adjust the local unemployment
rate based on the labor share in COVID-19 affected industries in each bankruptcy district. Second,
we adjust the unemployment rate to recognize that much of the unemployment in the second quarter
of 2020 was due to temporary layoffs. This adjustment is made based on the share of unemployed
workers who report being only temporarily laid off (U.S. Bureau of Labor Statistics, 2020). From
2001 through 2019, an average 58.0 percent of unemployed workers report permanent job loss.
Meanwhile, in the second quarter of 2020, only 35.2 percent of unemployed workers permanently
lost their jobs.15 Under the assumption that excess temporary layoffs will not result in higher
14
13.03 percent is the average of April, May, and June unemployment rates from U.S. Bureau of Labor Statistics
(2020).
15
These figures require a modification to the BLS figures. For example, in June 2020, 10,565 workers reported
temporary unemployment, and 2,883 reported permanent unemployment. Katz and Meyer (1990) estimate that 28
23bankruptcies, we multiply the estimated number of bankruptcies by (35.2%/58.0%)=60.7%.16
percent of ”temporary” job losses are actually permanent, and 13 percent of ”permanent” job losses are actually
temporary. Using these figures, we estimate that 7,607 unemployed respondents were experiencing temporary unem-
ployment, and 5,466 are permanent, such that 38.3 percent of all unemployment is permanent. Following this same
procedure, we estimate that on average in April, May, and June 35.2 percent of unemployment is permanent, while
from 2001-2019 it has average 58.0 percent.
16
See Iverson et al. (Forthcoming) for a more detailed description of this forecasting exercise.
24C Appendix Tables
Table A1. Total Bankruptcy Filings by Quarter
Panel A: AOUSC Statistics
(1) (2) (3) (4)
2019 Q1 2019 Q2 2020 Q1 2020 Q2
Total 191,744 206,339 181,098 124,395
Consumer 186,130 200,540 175,146 119,241
Business 5,614 5,799 5,952 5,154
Consumer Ch. 7 114,549 128,708 109,455 91,108
Consumer Ch. 13 71,298 71,583 65,483 28,030
Business Ch. 7 3,402 3,623 3,510 2,705
Business Ch. 11 1,629 1,503 1,854 2,042
Panel B: FJC and PACER Data
Total 186,582 199,731 175,967 119,668
Consumer 181,270 194,310 170,121 114,721
Business 5,312 5,421 5,846 4,947
Consumer Ch. 7 112,710 125,289 106,222 87,883
Consumer Ch. 13 68,314 68,816 63,743 26,789
Business Ch. 7 3,329 3,467 3,465 2,594
Business Ch. 11 1,450 1,376 1,796 1,972
Notes: Panel A comes from published statistics from the Administrative Office of the U.S. Courts.
Panel B is computed using our analysis dataset using data from FJC (January - June 2019) and
PACER (January - June 2020).
25You can also read