Behaviour of Jupiter's polar polygons over 4 years - Meeting ...
←
→
Page content transcription
If your browser does not render page correctly, please read the page content below
EPSC Abstracts
Vol. 15, EPSC2021-57, 2021
https://doi.org/10.5194/epsc2021-57
Europlanet Science Congress 2021
© Author(s) 2021. This work is distributed under
the Creative Commons Attribution 4.0 License.

Behaviour of Jupiter’s polar polygons over 4 years
John Rogers1, Gerald Eichstädt2, Candice Hansen3, Glenn Orton4, and Thomas Momary4
1
British Astronomical Association, London, UK (jrogers11@btinternet.com)
2
Independent scholar, Stuttgart, Germany
3
Planetary Science Institute, Tucson, AZ, USA
4
Jet Propulsion Laboratory, California Institute of Technology, Pasadena, CA, USA

Introduction

The polygons of cyclones at Jupiter’s poles – a pentagon at the south pole and an octagon at the
north pole, each centred on another cyclone – were discovered at Juno’s first few perijoves by the
JunoCam and JIRAM instruments [ref.1]. JunoCam images showed that the configurations remained
stable for the next two years, up to perijove (PJ) 15 [ref.2]. Here we summarise their behaviour up
to PJ33 in 2021 April; with the orbital period of 53 days, this covers 4½ years.

The data are polar projection maps produced from JunoCam images as described in [ref.2].

South polar cluster

The five southern circumpolar cyclones (CPCs) surround the central South Polar Cyclone (SPC).
However, the SPC is not at the pole, but displaced by 1°-3° latitude, always into the same quadrant
of longitude; and there is a gap between two of the CPCs (CPC-1 & 2), in the same quadrant [ref.2].

This asymmetry of the pentagon has persisted until now (Figures 1&2). At PJ23 a smaller, compact
cyclone was present in the gap, suggesting that the pentagon might be turning into a hexagon, but
at PJ24 it was replaced by a chaotic cyclonic region and the asymmetric pentagonal structure was
then restored.

We proposed [ref.2] that the cluster is a ‘vortex crystal’ whose configuration could be explained
geometrically, if we adopt two conjectures: that the cyclones have a maximum size that prevents
them growing larger or merging, and that the central cyclone must be smaller than the mean size of
the others (as observed). In this case, tight packing of the cyclones produces a pentagon with a
gap; and to pack the cyclones as close as possible to the pole, the cluster must be displaced towards
the side of the gap, with the largest cyclone on the opposite side, as observed.

Consistent with this model, as the cluster wanders somewhat, the gap tends to be widest when the
SPC is furthest from the pole (Figure 3). However, when the SPC longitude is greatest, it lies
alongside CPCs-2 & 3 rather than CPCs-1 & 2; and at these times a gap opens up between CPCs-2 &
3, supplementing or replacing the gap between CPCs-1 & 2, as the model would predict.

We noted [ref.2] that the wandering of the SPC appeared to be cyclic. The record over 4½ years
confirms this, showing that it performs loops with a period of 11.5 (±1) months (Figure 4). The
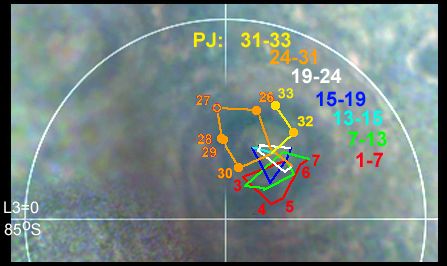
loops are of varying sizes, but show a progressive drift in one direction. The rate of this drift of
cycles has been very uneven, but if it were interpreted as precession of the cycles around the pole,
the rate would be ~8° (±8°) per year.

Independently of this cyclic motion, the whole pentagon shows a very slow rotation about the SPC,
which is stable in the long term: we estimated +1.5°/PJ from PJ1 to PJ15 [ref.2]. Up to PJ32, the
average rotation is +1.21 (±0.07) °/PJ, i.e. 8.3 (±0.5) °/yr.
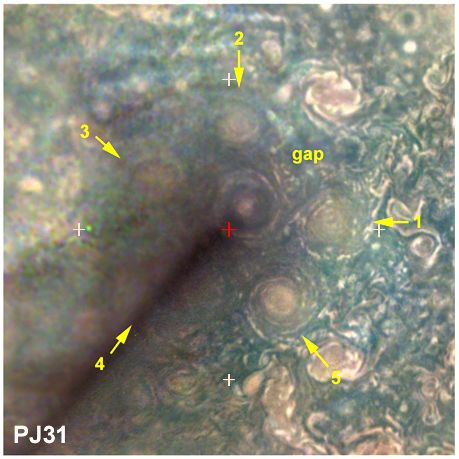
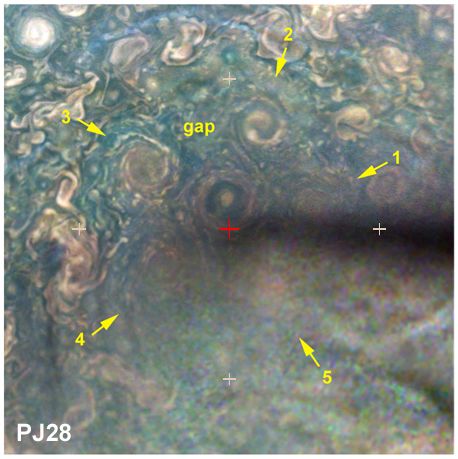
Figures 1 & 2. Maps of the south polar cluster, down to 75°S at the edges. CPCs are numbered.
The red cross marks the south pole, grey crosses 80°S; L3=0 to left.

Figure 3 (left). Width of the gap in the pentagon. The angle between CPCs-1 & 2 as measured from
the SPC, at each PJ, is plotted against the distance of the SPC from the pole (measurements of the
cyclone centres). Brown points represent PJs when there was also a gap between CPCs-2 & 3, i.e.
the angle between them was >76° (it is normally ~70°).

Figure 4 (right). Position of the centre of the SPC (colour-coded by PJ) with respect to the south
pole (white cross). PJs in the first and latest cycles are numbered (except PJ1 & PJ31). The SPC
has been cycling anticlockwise throughout. Background image from PJ25.

North polar cluster

The north polar octagon originally consisted of 8 CPCs of alternating morphology (‘filled’ and more
diverse types), so it was best described as a ditetragon, centred on the North Polar Cyclone (NPC)
[refs.1 & 2]. JunoCam has less complete coverage of the north polar region than of the south.
Nevertheless, about half the cluster is imaged at each PJ and over four PJs a high-quality map can
be assembled (Figure 5). And as the sun rose on the north pole, the NPC (previously observed only
by JIRAM in 5-µm thermal emission) has become visible to JunoCam.

In 2017, the polygon was a ditetragon with one anticyclonic oval (AO) north of CPC-7.
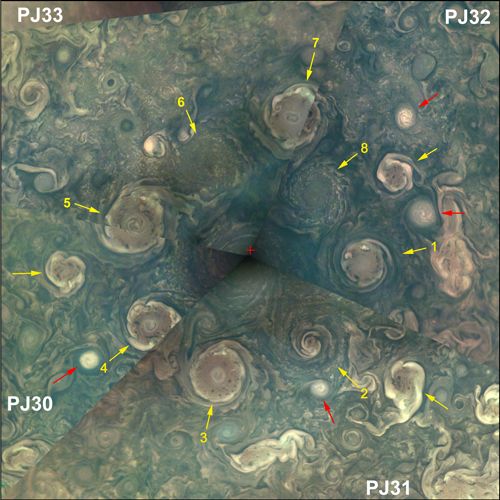
In 2018, one of the diverse CPCs gradually turned into a fifth ‘filled’ CPC; meanwhile, CPC-7 was
increasingly displaced to lower latitude, away from the NPC, by the AO just north of it. By 2020,
another AO had appeared on the opposite side, north of CPC-3.

In 2021 (from PJ32 onwards), the AO north of CPC-7 disappeared and CPCs-6 & 8 closed up
together. So we discuss whether the cluster is still a (distorted) octagon, or now a heptagon, with
CPC-7 excluded from it, joining several smaller ‘filled’-type cyclones as satellites of the polygon
(Figure 5). Moreover, the NPC is displaced by ~0.6-1.2° from the pole – possibly a response to the
new asymmetry, comparable to the displacement of the SPC.

These rearrangements could be random, or temporary, or seasonal in response to the sun rising
over the north pole. JunoCam will continue to monitor the polar clusters during the extended
mission.

Figure 5: Composite map of the north polar cluster, PJ30-PJ33, down to 75°N at the edges. The
PJ33 sector was rotated 7° and translated slightly. CPCs are numbered. Unnumbered arrows
indicate smaller peripheral cyclones (yellow) and anticyclonic ovals (red).

Acknowledgements:
Some of this research was funded by NASA. A portion of this was distributed to the Jet Propulsion
                                   Laboratory, California Institute of Technology.

                                   References:

                                   1. Adriani et al., Nature 555, 216-219 (2018).

                                   2. Tabataba-Vakili et al., Icarus 335 (2020), paper 113405 (online 2019).

Powered by TCPDF (www.tcpdf.org)
You can also read