Bicycle Facilities Safest from Crime and Crashes: Perceptions of Residents Familiar with Higher Crime/Lower Income Neighborhoods in Boston - MDPI
←
→
Page content transcription
If your browser does not render page correctly, please read the page content below
International Journal of
           Environmental Research
           and Public Health

Article
Bicycle Facilities Safest from Crime and Crashes:
Perceptions of Residents Familiar with Higher
Crime/Lower Income Neighborhoods in Boston
Anne C. Lusk 1, *, Walter C. Willett 1 , Vivien Morris 2 , Christopher Byner 3 and Yanping Li 1
 1    Department of Nutrition, Harvard T. H. Chan School of Public Health, Boston, MA 02115, USA;
      wwillett@hsph.harvard.edu (W.C.W.); yanping@hsph.harvard.edu (Y.L.)
 2    Mattapan Food and Fitness Coalition, Boston, MA 02126, USA; vivien.morris@gmail.com
 3    Boston Centers for Youth & Families, Boston, MA 02120, USA; christopher.byner@boston.gov
 *    Correspondence: AnneLusk@hsph.harvard.edu

 Received: 25 September 2018; Accepted: 18 January 2019; Published: 7 February 2019

 Abstract: While studies of bicyclist’s perceptions of crime and crash safety exist, it is also important
 to ask lower-income predominantly-minority residents what bicycle-route surface or context they
 perceive as safest from crime and crashes. With their insights, their chosen bike environments
 could be in engineering guidelines and built in their neighborhoods to improve residents’ health
 and lessen their risk of exposure to crime or crashing. This study involved two populations in
 Boston: (a) community-sense participants (eight groups-church/YMCA n = 116); and (b) street-sense
 participants (five groups-halfway house/homeless shelter/gang members n = 96). Participants ranked
 and described what they saw in 32 photographs of six types of bicycle environments. Quantitative
 data (Likert Scale 0–6 with 0 being low risk of crime/crash) involved regression analysis to test
 differences. Qualitative comments were categorized into 55 themes for surface or context and if
 high or low in association with crime or crashes. For crime, two-way cycle tracks had a significantly
 lower score (safest) than all others (2.35; p < 0.01) and share-use paths had a significantly higher score
 (least safe) (3.39; p < 0.01). For crashes, participants rated shared-use paths as safest (1.17) followed
 by two-way cycle tracks (1.68), one-way cycle tracks (2.95), bike lanes (4.06), sharrows (4.17), and
 roads (4.58), with a significant difference for any two groups (p < 0.01) except between bike lane
 and sharrow (p = 0.9). Street-sense participants ranked all, except shared-use paths, higher for crime
 and crash. For surface, wide two-way cycle tracks with freshly painted lines, stencils, and arrows
 were low risk for crime and a cycle track’s median, red color, stencils, and arrows low risk for crash.
 For context, clean signs, balconies, cafes, street lights, no cuts between buildings, and flowers were
 low risk for crime and witnesses, little traffic, and bike signals low risk for crash. As bicycle design
 guidelines and general Crime Perception Through Environmental Design (CPTED) principles do not
 include these details, perhaps new guidelines could be written.

 Keywords: bicycle; low income; ethnic-minority; crime, crash; cycle tracks

1. Introduction
     Bicycling should be enabled for all populations because of the positive associations with weight
control [1–3] improved cardiac function [4], overall health [5], and lower mortality [6,7] but, in the U.S.,
only 0.6% of the population 16 and over commutes regularly by bicycle [8]. Residents in lower-income
ethnic-minority neighborhoods may be hesitant to bike due to the environments through which they
would ride. Providing safe bicycle facilities in these neighborhoods [9,10] may help address a racial
injustice because African-American and Hispanic populations engage in less physical activity [11,12]

Int. J. Environ. Res. Public Health 2019, 16, 484; doi:10.3390/ijerph16030484   www.mdpi.com/journal/ijerph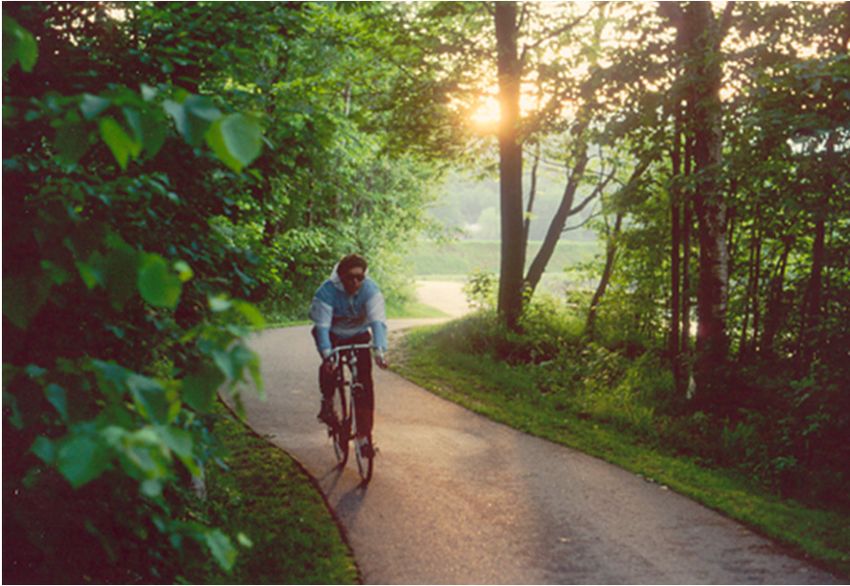
Int. J. Environ. Res. Public Health 2019, 16, 484                                                       2 of 21

and have higher rates of obesity [13]. If African American and Hispanic populations were asked to
select the bicycle environments they prefer and their chosen environments were included in the bicycle
design guidelines and then built, chances would be greater that they would bicycle more.
      For crime, residents in lower-income African American and Hispanic communities may engage
in less physical activity, including not bicycling [14], due to perceptions of crime [15–18]. If bicyclists
are aware that violent crimes have been committed along a bike route, they may select other means of
travel [19]. Perception of crime can be lessened, as identified by Jacobs through “eyes of the street” [20],
Jeffrey through Crime Prevention Through Environmental Design (CPTED) [21,22], Newman through
defensible space [23], and Kelling and Coles through “Fixing Broken Windows” [24]. Their proposed
changes to the built environment can be implemented but perhaps crime-related improvements would
be different if for bicycle environments and if identified by residents in lower-income ethnically
diverse communities.
      For crashes, willingness to bicycle is based on the perception of crash risk [25]. African-American
and Hispanic bicyclists already experience higher rates of car/bicycle crashes compared with White
bicyclists [9,26]. For bicyclists in the U.S., the sanctioned practice has involved sharing the road with
cars [27,28], which requires lane-command and enrolling in classes to learn how to operate the bicycle
as a vehicle [29]. The crash rate of bicyclists in the United States is 3.75 per million km bicycled
compared to 0.14 in the Netherlands [30,31], due in large part to the Dutch having 29,000 km of cycle
tracks (barrier-protected, bicycle-exclusive facilities beside sidewalks) [32] and the U.S. having only
30 km [33]. Research has suggested that cycle tracks are safer [33–39] and preferred [40], including
being preferred by lower-income ethnic-minority residents [41]. By May 2017 in the U.S., the number of
cycle tracks had increased to 406 but the cycle tracks are isolated and only average 1.2 km in length [42].
In 10 cities in the U.S. that had installed safer bike facilities, fatalities and severe injuries of bicyclists
per 100,000 trips had declined between 43% to 79% [43]. Even though the new bike facilities in those
10 cities reduced cyclists’ fatalities and injuries, safe bicycle facility networks continue to not be built
in all communities [36].
      For help in designing the best bike facilities, U.S, guidelines are consequential because state
engineers approve funding for and build facilities following these guidelines. The authors of the early
bicycle guidelines were male engineers and their recommendations remained unchanged for years
as they cut and pasted the same text for subsequent guideline editions [33,44]. The early authors
were also skilled male bicyclists who preferred to operate their bicycle as a vehicle. Unlike male and
female bicyclists who pedal at different speeds [45], drivers move the vehicle with an accelerator pedal,
eliminating strength-in-driver differences. The automobile also ensures the safety of the occupants
with features such as roll bars, seat belts, and air bags [46]. The highway environment protects the
most vulnerable drivers, including a drowsy driver who awakens from the sound of a rumble strip [47].
In contrast, the bicycle environment assumes bicyclists possess the maximum skill set for bicycling
and that bicyclists have no human flaws such as being distracted. There are also gender and crime
apprehension differences. The concept of “fight or flight” in human behavior science is well known
but the rats used in the experiment were male. If female rats are put in the same environment, the
female rats “tend and befriend” because they cannot, like the males, fight or flee as effectively [48].
      While the practice in the U.S. has been to build bicycle facilities based primarily on the perceptions
of educated male engineers [33] according to the American Community Survey (2008–2012), the
majority who use the bicycle as their transportation to work earn less than $10,000 [49]. These
lower-income bicyclists might not always be asked which bicycle environments they would prefer and
why. Therefore, this research would first learn from lower-income ethnic-minority residents which
bicycle environments, as shown on a large screen, make them feel more or less vulnerable to an act
of crime and more or less likely to hit by a vehicle. Their perceptions would also be compared based
on gender, age, if they could ride a bicycle or not, and if they were in the community-sense groups
(church/YMCA) or the street-sense groups (halfway house/homeless shelter/gang members). Second,
the study would identify which bicycle environment surface and surrounding three-dimensional
Int. J. Environ. Res. Public Health 2019, 16, 484 3 of 21
context elements make the resident feel more or less vulnerable to crime or crash. Third, the
participant’s perceptions about the bicycle environments would be aligned with the basic tenants
in bicycle design guidelines and crime theories to determine if there were different insights from
lower-income ethnic-minority populations. The findings could perhaps be incorporated in new bicycle
design guidelines or CPTED principles to improve all bicyclists’ safety from crime and crash.
2. Materials and Methods
The methods included survey locations and groups, theory, survey, and data analysis.
2.1. Survey Locations and Groups
The survey was conducted in or near Roxbury, Mattapan, and Dorchester as these areas have,
compared to other areas in Boston, historically been under-resourced and had a history of higher
crime [50] and lower income [51,52]. Crime rates have dropped over the years but the perception of
crime about a community can linger both in and outside a community. These neighborhoods once
had streetcars and, with the introduction of cars, many streets are now one-way with cars parked
on both sides. U.S. Census data from 2010 reported that these three neighborhoods had higher
densities of predominantly Black and other minority populations (Roxbury—41.4% Black and 27.0%
Latino; North Dorchester—44.0% Black and 22.6% Latino; South Dorchester—45.8% Black and 14.7%
Latino; Mattapan—80.4% Black and 11.7% Latino) [53]. Groups contacted had members with a high
community sense (churches, YMCA’s, etc.) or a high street sense (halfway houses, homeless shelters,
gang connections, etc.). Street-sense groups were included because individuals who have committed
crimes or know of crime opportunities provide valuable insights [54,55].
Calls to ninety-one organizations generated lists of potential groups. Groups were then emailed
the survey, information, and flyer to help recruit attendees to the dinner and survey. A portable
LCD projector and a large screen allowed for showing the slides in different locations chosen by the
residents, e.g., their own church, halfway house, or homeless shelter. The groups were small (no more
than 30 per group) and often part of regularly scheduled meetings. To demonstrate respect and thanks,
full dinners or desserts and coffee came from a well-regarded catering establishment with staff of
under-employed men and women in the Boston area.
2.2. Theory
This study aligns with the ecological model that suggests the environmental setting, plus
individual and social factors, can foster well-being [56]. To offer a hierarchy to the ecological model,
Maslow’s pyramid was applied, i.e., only after basic needs are met can higher needs be met [57].
This study specifically applied the Maslow transportation Level of Service (LOS) [58] i.e., before
time, societal acceptance, cost, comfort, and convenience needs of bicyclists are met, the basic needs
of security (from crime) and safety (from crash) must be met. The study is also framed on Crime
Prevention Through Environmental Design (CPTED) principles, as posited by Jacobs [20], Jeffrey [21],
Newman [23], and Kelling and Coles [24].
2.3. Survey
In structured presentations with feedback, participants were asked if they would rate (Likert
Scale 0–6 with 0 being low risk of crime/crash) and comment on the variety of pictures of bicycle
environments. Colored pictures were shown on a screen because no higher crime/lower income
neighborhood in the U.S. contains all the state-of-art bicycle facilities. Participants were given the
paper survey and a pencil and provided with instruction on the survey and verbally.
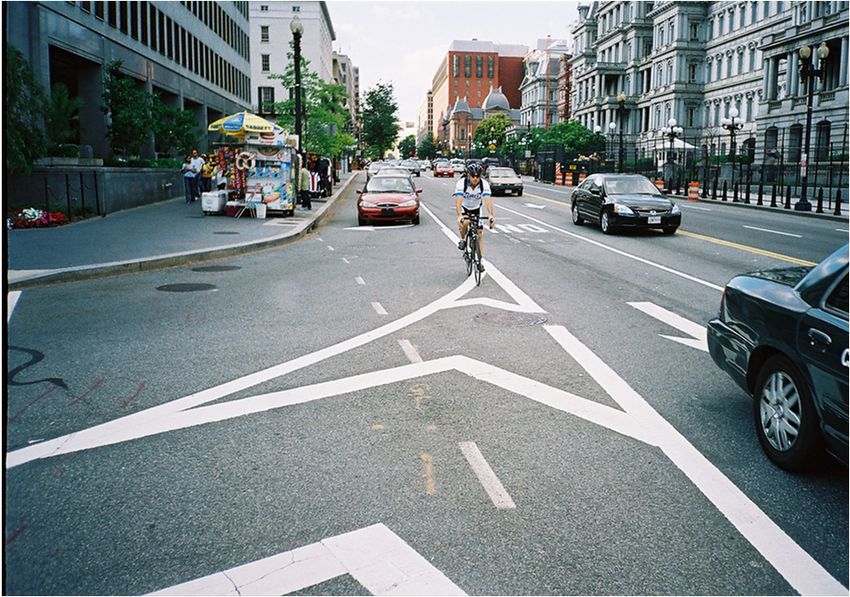
Over 100 photographs of six different types of bicycle facilities were assembled including: (1) roads
with no bicycle provisions; (2) roads with sharrows (bicycle stencil with a double chevron); (3) painted
bicycle lanes; (4) one-way cycle tracks; (5) two-way cycle tracks; and (6) shared-use paths (Table 1 and
Figure 1). The photographs all had good daylight, no or only a few bicyclists present, and a dominant
Int. J. Environ. Res. Public Health 2019, 16, 484                                                                     4 of 21

view of the bicycle provision. Because so few cycle tracks exist in the U.S., some generic photographs
were from Montreal and cities in Western Europe. Photographs of the same facility varied based on
width, paint, road-separation treatment, stencils, trees, and context. A City of Boston Official, who had
an understanding of bike facilities best understood by residents in Roxbury, Mattapan, and Dorchester,
reviewed and helped select the photographs. In total, 32 photographs served as representations of the
different bicycle facilities.

                                        Table 1. Bicycle environments in the 32 slides.

                  Facility                                                     Description
                                                Bicyclists are, by law, allowed to ride on all roads except interstate
 (1) Road with no bicycle provision             highways. The roads can be narrow one- or two-way neighborhood
                                                roads or multi-lane roads. The roads can also have parallel-parked cars.
                                                A sharrow, shared lane marking, is to alert drivers that bicyclists will
 (2) Road with sharrows (bicycle                bicycle in that location in that travel lane. The sharrow also indicates to
 stencil and a double chevron)                  bicyclists the best position for riding within the lane. Sometimes, the
                                                sharrow is near the middle of the lane to avoid an opening car door.
                                                A painted bike lane is a portion of the roadway that can include a
                                                bicycle stencil and an arrow. A painted bike lane can also be beside
 (3) Painted bike lane
                                                parallel-parked cars or beside a curb. A bicycle lane has no physical
                                                separation to prevent drivers from driving into or parking in the space.
                                                A one-way cycle track has a barrier, such as bollards or parked cars, to
                                                prevent drivers from entering or parking within the cycle track. A cycle
 (4) One-way cycle track                        track is for the exclusive use by bicyclists and, unlike a shared use path,
                                                not shared with pedestrians. A one-way cycle track can be level with the
                                                road, level with the sidewalk, or travel through a park.
                                                A two-way cycle track has a barrier, such as bollards or parked cars, to
                                                prevent drivers from entering or parking within the cycle track. The
 (5) Two-way cycle track
                                                two-way cycle track has bicycle stencils and arrows with a line in the
                                                middle to indicate that bicyclists will be riding in two directions.
                                                Shared use paths are asphalt/hard surface paths shared by walkers,
                                                bikers, joggers, in-line skaters, wheelchair users, baby carriage pushers,
 (6) Shared-use path
                                                and scooters. These paths can be adjacent to roads, run through parks,
                                                or parallel property or waterways.

      For quantitative data, the paper survey asked respondents to look at the pictures shown on the
large screen and mark their answer to the question, “Do you feel the chance of crime is low or high
(0–6 with 0 being low chance of crime/crash) if you bicycle in this place?” The participants were told
that crime meant being fearful that some negative occurrence might happen to them as a bicyclist in
that location. For crash, the question was repeated and participants were told that crash meant being
fearful that a vehicle might hit them. Participants could also volunteer their age, gender, and if they
knew how to bicycle.
      For qualitative data, the pictures, when shown again, gave participants the opportunity to say
what they saw in the picture that might be associated with low or high perceptions of crime and
crashes. The participants in each of group rated the 32 pictures in about 1/2 hour followed by an
additional 1/2 hour for discussions about each picture. The study received an Institutional Review
Board (IRB) exemption as participants completed the surveys voluntarily and anonymously.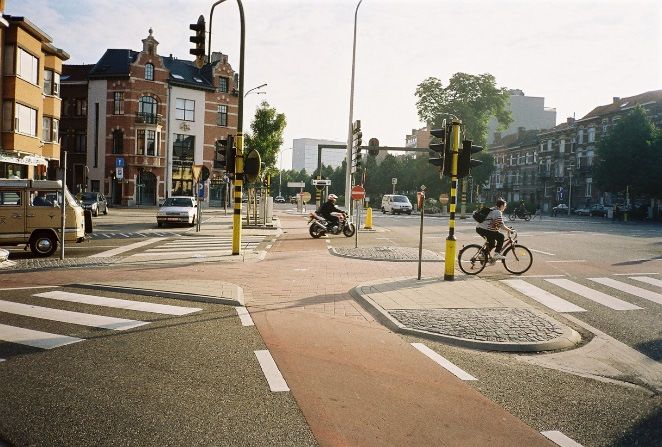
drivers from entering or parking within the cycle track. The two-way cycle track
     (5)   Two-way cycle track
                                                 has bicycle stencils and arrows with a line in the middle to indicate that bicyclists
                                                 will be riding in two directions.
                                                 Shared use paths are asphalt/hard surface paths shared by walkers, bikers,
                                                 joggers, in-line skaters, wheelchair users, baby carriage pushers, and scooters.
      (6) Shared-use path
                                                 These paths can be adjacent to roads, run through parks, or parallel property or
Int. J. Environ. Res. Public Health 2019, 16, 484waterways.                                                                          5 of 21

    Int. J. Environ. Res. Public Health 2019, 16, x                                                                           5 of 20

                                  (1) Road—no bike provision (Photo
                                                        Figure      credit for both Anne Lusk)
                                                               1. Cont.

                                                                                                                                     4

                     (2) Sharrow-painted bicycle and double chevron (photo credit for both Anne Lusk)

                                       (3) Painted bike lane (photo credit for both Anne Lusk)

              (4) One-way cycle track (photo credit Nate Lusk first picture—photo credit Anne Lusk second)

                                                            Figure 1. Cont.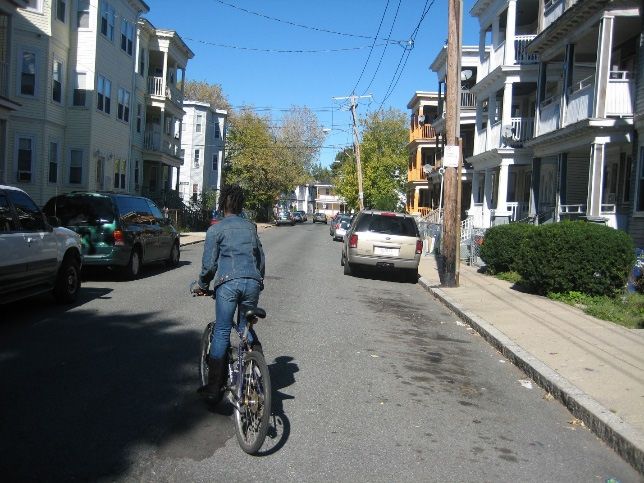
Int. J. Environ. Res. Public Health 2019, 16, 484                                                                        6 of 21
    Int. J. Environ. Res. Public Health 2019, 16, x                                                                 6 of 20

                                    (5) Two-way cycle track (photo credit for both Steve Bercu)

                                       (6) Shared use path (photo credit for both Anne Lusk)

                  Figure
                Figure 1. 1.
                          TwoTwo picturesofofeach
                               pictures       eachof
                                                   ofthe
                                                      the facility
                                                          facility types
                                                                   typesincluded
                                                                         includedininthe
                                                                                       thesurvey of of
                                                                                            survey  32 32
                                                                                                       slides.
                                                                                                          slides.

2.4. DataFor
          Analysis
             quantitative data, the paper survey asked respondents to look at the pictures shown on the
    large screen and mark their answer to the question, “Do you feel the chance of crime is low or high
      The different perceptions of each bicycle environment picture were analyzed based on male
    (0–6 with 0 being low chance of crime/crash) if you bicycle in this place?” The participants were told
or female,    age, if they could ride a bicycle or not, and if they were in the community-sense
    that crime meant being fearful that some negative occurrence might happen to them as a bicyclist in
groups   (church/YMCA)
    that location.  For crash,or the
                               the   street-sense
                                   question         groups and
                                               was repeated   (halfway  house/homeless
                                                                  participants              shelter/gang
                                                                                were told that  crash meantmembers).
                                                                                                              being
Demographics       identified  differences   between    the “community      sense”  and  “street
    fearful that a vehicle might hit them. Participants could also volunteer their age, gender,   sense”and
                                                                                                          participants.
                                                                                                             if they
Theknew
     meanhow scores  (95% confidence intervals) for perception of crime and crash risks for each of the 6
                 to bicycle.
bicycle facility  types were
          For qualitative  data,adjusted   for age,
                                 the pictures,      sex,shown
                                                 when     whether   they
                                                                again,    know
                                                                       gave      how to bicycle,
                                                                             participants          and streettosense
                                                                                          the opportunity        say or
community
    what theysense
                 saw using
                      in the general   linear
                             picture that      regression
                                             might          models,with
                                                    be associated     andlow
                                                                           wereorcompared    using Tukey’s
                                                                                  high perceptions    of crimemultiple
                                                                                                                 and
    crashes. The
comparisons         participants
                tests.  A figurein  each
                                  was       of groupthat
                                         prepared     rated  the 32 pictures
                                                          separately          in about
                                                                       displayed        1/2 hour
                                                                                   the crime   andfollowed    by an
                                                                                                    crash perception
    additional  1/2  hour  for discussions    about each   picture. The  study  received an  Institutional
for each of the six bicycle facilities. Two models, with one for the crime score and the other for the      Review
    Board
crash      (IRB)
       score      exemption
              as the dependent as participants  completed
                                   variable, provided     thethe surveys
                                                              rated  scorevoluntarily and anonymously.
                                                                           of each bicycle  facility type. Regression
analysis of general linear models (GLM) were used to test the difference between groups based on
    2.4. Data Analysis
sex, age, ability to bicycle, group type, and bicycle facility type with mutual adjustment for each other,
         Thefor
separately    different
                 the crime perceptions
                               score and of the
                                            eachcrash
                                                  bicycle  environment picture were analyzed based on male or
                                                        score.
    female,  age,  if  they  could   ride a  bicycle  or  not,
      For analysis of the qualitative comments, specialized    and if they  were in such
                                                                         software,  the community-sense
                                                                                           as nvivo, was not  groups
                                                                                                                 utilized
    (church/YMCA)         or  the  street-sense   groups     (halfway   house/homeless    shelter/gang
because each picture had to be viewed and understood for data within that picture to understand the       members).
    Demographics
intent                identified
        of the qualitative        differences
                                comment         between
                                             about   thatthe   “community
                                                            picture.        sense” and comments
                                                                      The qualitative   “street sense”onparticipants.
                                                                                                          the transcript
    The mean scores (95% confidence intervals) for perception of crime and crash risks for each of the 6
about each picture received codes while looking at that picture. The categorization for each
    bicycle facility types were adjusted for age, sex, whether they know how to bicycle, and street sense
comment was according to whether the comment related to the surface/bicyclist’s right-of-way
    or community sense using general linear regression models, and were compared using Tukey’s
or the three-dimensional context and with high/low crime and crash categories for each. The codes
    multiple comparisons tests. A figure was prepared that separately displayed the crime and crash
totaled  72 types
    perception  forof    responses
                      each  of the sixbut if only
                                       bicycle     one individual
                                               facilities. Two models,made
                                                                         withaone
                                                                               comment,    it was
                                                                                  for the crime    notand
                                                                                                 score  included   in the
                                                                                                            the other
table, resulting    in  55  codes.  Frequency     was    determined    for the number    of times   the 493
    for the crash score as the dependent variable, provided the rated score of each bicycle facility type.   qualitative
comments were mentioned in any of the structured presentations.
                                                                                                                         6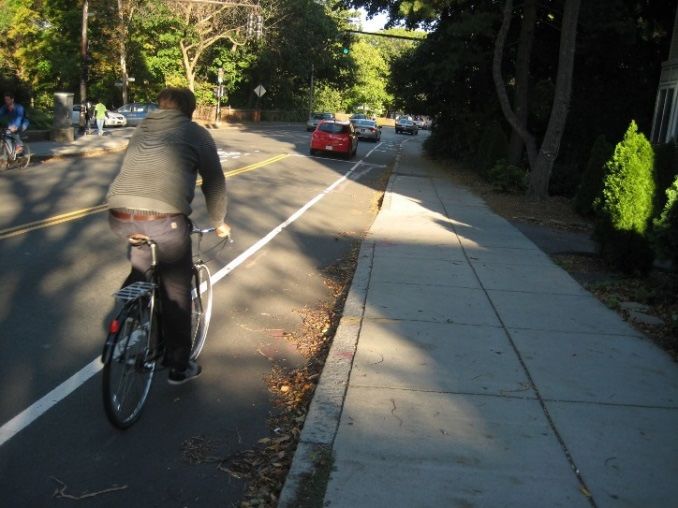
Int. J. Environ. Res. Public Health 2019, 16, 484                                                             7 of 21

     The findings from the qualitative comments were compared with recommendations in the bicycle
design guidelines and CPTED to determine if the participant’s perceptions were reflected in standards
for building bicycle facilities. If there were dissimilarities, the recommendation could be to write
design guidelines and develop crime prevention principles based on the perceptions of ethnically
diverse lower-income individuals and not based only on the perceptions of white male engineers,
the principle authors of the past bicycle guidelines.

3. Results
     Two hundred and twelve individuals in thirteen structured-presentation groups completed the
surveys. Eight of the groups were strong community sense (church/YMCA n = 116) and five were
strong street sense (gang/halfway/homeless n = 96) (Table 2). The group sizes ranged from 9 to
28 participants with a mean age of 36, 42% female, and 87% knowing how to bicycle. Twelve of the
groups were comprised primarily of African American individuals with a mixed population in one
homeless shelter.

                    Table 2. Characteristics of community sense/street sense groups: age, sex, bike.

                                                              Age
                                                                                   Sex             Bicycle
             Area            Groups                 N      Mean ± SDs
                                                                               (Female, %)        (Yes, %)
                                                           (Min–Max)
           Total                                212      36.6 ± 14.0 (18–79)       42.5                87.3
         Commty.       1         1               18       33.9 ± 9.8 (18–53)       50.0                77.8
                                 2               21      45.8 ± 13.5 (22–66)       95.2                76.2
                                 3               11      31.3 ± 14.4 (18–65)       27.3                100
                                 4               14      40.8 ± 14.5 (18–60)       85.7                92.9
                                 5               16      32.6 ± 11.5 (21–52)       56.3                93.8
                                 6               10      29.8 ± 11.7 (18–46)       40.0                70.0
                                 7               17      46.8 ± 21.1 (19–79)       35.3                82.3
                                 8               9       38.7 ± 12.7 (22–57)       44.4                100
                                All             116      38.3 ± 15.1 (18–79)       57.8                85.3
            Street 2             9                  14   34.5 ± 10.0 (22–60)       100                 92.9
                                10                  21    32.0 ± 9.0 (18–52)         0                 95.2
                                11                  13    36.6 ± 7.9 (25–54)       23.1                92.3
                                12                  20    21.9 ± 4.7 (18–38)       25.0                95.0
                                13                  28   44.9 ± 11.9 (25–67)        3.6                78.6
                                All                 96   34.5 ± 12.2 (18–67)       24.0                89.6
      Note: 1 Strong community sense (church member, YMCA member); 2 Strong street sense (gang member, halfway
      house resident, homeless shelter resident).

3.1. Crime Perception Quantitative Data
     All of the bicycle facilities were rated for crime (mean scores = 2.35–3.39) (0–6 with 0 being
low chance of crime/crash). Two-way cycle tracks (rated score = 2.35, 95% confident interval (CI):
2.26–2.45) had a significantly lower score for crime (safer) than all others (Ps < 0.01) and share-use
paths (3.39 (3.25–3.53)) had a significantly higher score (less safe) (Ps < 0.01) (Figure 2A). For crime
perceptions by population, gender differences were statistically significant for roads (2.91 males/3.07
females), shared-use paths (3.14 males/3.68 females), and bike lanes (2.85 males/3.04 females) (p < 0.05)
(Table 3). Two-way cycle tracks were safest from crime and perceived equally by males and females.
For all bicycle facilities together, females perceived crime higher (p < 0.0001). For the two-way cycle
track, participants who cannot ride a bike had the highest perception of safety from crime (2.19).
Differences were statistically significant for street sense individuals who, compared with community
sense individuals, rated all of the bicycle facilities, except shared-use paths, higher for crime perception.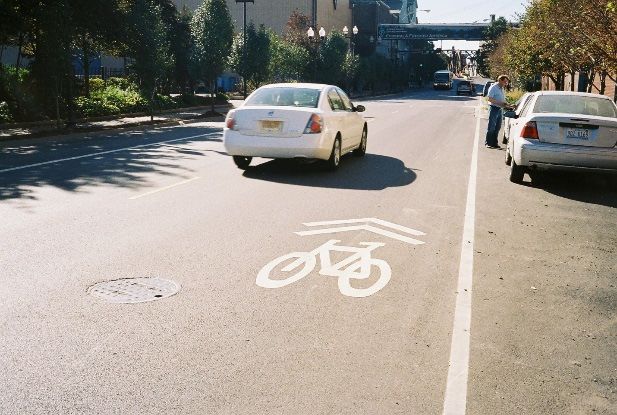
0.05) (Table 3A). Two-way cycle tracks were safest from crime and perceived equally by males and
      females. For all bicycle facilities together, females perceived crime higher (p < 0.0001). For the two-
      way cycle track, participants who cannot ride a bike had the highest perception of safety from crime
      (2.19). Differences were statistically significant for street sense individuals who, compared with
      community sense individuals, rated all of the bicycle facilities, except shared-use paths, higher for
Int. J. Environ. Res. Public Health 2019, 16, 484                                                          8 of 21
      crime perception.

     Figure  2. Adjusted
         Figure  2. Adjustedmean
                               meanscores
                                      scores(95%
                                              (95%confidence
                                                     confidenceintervals)    for perception
                                                                  intervals) for perceptionofofcrime
                                                                                                crimeand
                                                                                                       and  crash
                                                                                                          crash     risks
                                                                                                                 risks forfor
     the the
         6 bicycle  facility
             6 bicycle       types.
                       facility      Adjusted
                                types.  Adjustedfor forage,
                                                        age,sex,
                                                             sex, whether   they know
                                                                  whether they    knowhow
                                                                                        howtotobicycle,
                                                                                                 bicycle, and
                                                                                                        and     street
                                                                                                             street     sense
                                                                                                                     sense
     or community
         or community sense
                         senseusing
                                usinggeneral
                                       generallinear
                                                 linearregression
                                                         regression models.    Tukey’smultiple
                                                                     models. Tukey’s   multiplecomparisons
                                                                                                  comparisons     tests
                                                                                                               tests werewere
     used  to compare
         used  to comparethethe
                              differences
                                 differencesbetween
                                               betweeneacheachtwo
                                                               twogroups.
                                                                    groups.

3.2. Crash Perception Quantitative Data                                                                                         8

     For crashes, participants rated shared-use paths as safest (1.17 (1.02–1.31)), followed by two-way
cycle tracks (1.68 (1.58–1.78)), one-way cycle tracks (2.95 (2.86–3.04)), bike lanes (4.06 (3.96–4.16)),
sharrows (4.17 (4.00–4.34)), and roads (4.58 (4.50–4.66)), with a significant difference for any two
groups (Ps < 0.01) except between bike lane and sharrow (p = 0.9) (Figure 2B). For crash perceptions
by population, gender differences were statistically significant for roads (4.38 males/4.85 females),
shared-use paths (1.30 males/0.99 females), bike lanes (3.89 males/4.26 females), and sharrows
(3.95 males/4.44 females) (p < 0.05) (Table 4). Of all the populations and all the bike facilities, females
perceived the shared use path as safest from crashes with vehicles (0.99). Street sense participants
rated all the bicycle facilities, except the shared use path, as more dangerous for vehicle/bicycle crash.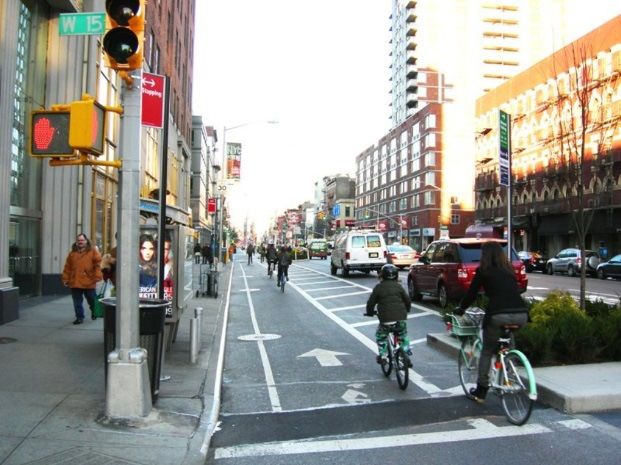
Int. J. Environ. Res. Public Health 2019, 16, 484                                                                                                                                             9 of 21

                      Table 3. Summary statistics for perceptions of crime for each of the six bicycle facility types, stratified by sex, age, bicycle, and group type.

                                                              One Way Cycle          Two Way Cycle                              Shared-Use
                                                All                                                              Road                                Bike Lane              Sharrow
            Bicycle Facility                                      Track                  Track                                     Path
                                        Mean           Std    Mean            Std    Mean          Std    Mean          Std    Mean          Std    Mean          Std    Mean          Std
                    All                  2.79          1.73   2.61            1.63   2.35          1.69   2.98          1.79   3.38          1.99   2.94          1.62   2.73          1.50
         Sex
                  Female                 2.86      1.74       2.54            1.62   2.38          1.68   3.07       1.79      3.68      1.90       3.04       1.67      2.78          1.47
                   Male                  2.75      1.72       2.67            1.64   2.33          1.69   2.91       1.78      3.14      2.02       2.85       1.57      2.69          1.53
                  p value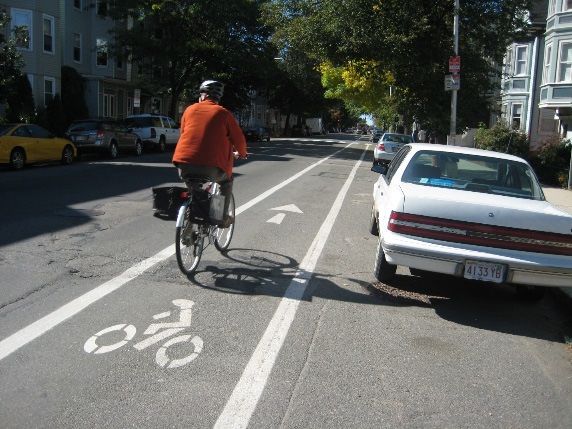
Int. J. Environ. Res. Public Health 2019, 16, 484                                                                                                                                             10 of 21

                      Table 4. Summary statistics for perceptions of crash for each of the six bicycle facility types, stratified by sex, age, bicycle, and group type.

                                                              One Way Cycle        Two Way Cycle                              Shared-Use
                                                All                                                            Road                                  Bike Lane              Sharrow
            Bicycle Facility                                      Track                Track                                     Path
                                        Mean           Std    Mean          Std    Mean          Std    Mean          Std    Mean            Std    Mean          Std    Mean          Std
                    All                  3.24          2.12   2.96          1.92   1.68          1.76   4.59          1.57   1.16            1.64   4.06          1.70   4.16          1.66
         Sex
                  Female                 3.33      2.19       2.92          1.95   1.59          1.77   4.85       1.51      0.99       1.50        4.26       1.67      4.44      1.47
                   Male                  3.17      2.06       2.99          1.90   1.75          1.76   4.38       1.59      1.30       1.73        3.89       1.72      3.95      1.77
                  p value
Int. J. Environ. Res. Public Health 2019, 16, 484 11 of 21
3.3. Crime Perception Qualitative Comments
The categorized qualitative comments totaled for crime include: a) surface/bicyclist’s
right-of-way—high/low risk of crime; and b) three-dimensional context—high/low risk of crime
(Table 5). For surface/bicyclist’s right-of-way, participants perceived high crime risk with narrowness
of cycle track, faded bike-lanes, and old bike symbols. Participants perceived low crime risk with a
two-way cycle track because the bicyclist knew how to get back home. For context in the surrounding
area, participants perceived high crime risk if there were few to no people around, no lights, dense
trees/bushes/high grass, hiding spots/cuts between buildings, lack of maintenance, dense crowds,
and lots of parked cars or cars being driven. Low crime risk was associated with many people being
out (as with sidewalk cafés), cleanliness, nice signs, no dark alleys, balconies on houses, light, flowers,
limbed-up trees, high-end stores, and lots of little shops.
3.4. Crash Perception Qualitative Comment
The categorized qualitative comments totaled for crash include: a) surface/bicyclist’s
right-of-way—high/low risk of crash; and b) three-dimensional context—high/low risk of crash
(Table 5). For the surface/bicyclist’s right-of-way, participants perceived high crash risk with a sharrow
near the middle of the road, a narrow right-of way, a narrow cycle track, no bike signs/stencils, or
no space between parallel-parked cars and a one-way cycle track into which car doors would open.
For surface right-of-way, participants perceived low crash risk with island barriers between the road
and the cycle track, a red cycle track, a wide right-of-way, bike symbol/stencil/arrows, and a one-way
cycle track. For the context in the surrounding area, participants perceived high crash risk with many
drivers, close cars, painted bike lanes near opening car doors, proximity to bus stops, sharing the road
with buses, high vehicle speeds, and confusing paint. For context, participants perceived low crash
risk when there were more people around, not a lot of car traffic, and a bike signal at the intersection.
3.5. If the Findings Are in Bicycle Facility Design Guidelines and CPTED Principles
In comparing the preferences from this study with the American Association of State Highway and
Transportation Officials (AASHTO) 2012 “Guide for the Development of Bicycle Facilities,” the current
AASHTO guide does not include cycle tracks [27]. The guideline does include one brief paragraph about
aesthetics and suggests that trees make riding cooler and provide a windbreak and that bicyclists prefer
to be near shopping districts and have a view. The AASHTO bike guideline recommends studying
crash reports to learn where to make improvements but that would be after and not before a crash. The
National Association of City Transportation Officials (NACTO) bicycle guideline [59] mentions the need
to design for safety from crash but only recommends building certain types of bicycle facilities, such as
cycle tracks. Low stress routes away from high traffic areas and one-way closed-to-through-traffic bike
routes are recommended [60] but these would be in areas with fewer people.
A comparison between the populations who provided the data for this study and Jane Jacobs
reveals differences. Jacobs proposed lowering crime through “eyes on the street” in her 1961 book
“The Life and Death of Great American Cities”[20]. She wrote about her neighborhood in Greenwich
Village in New York City where her family and others had purchased three-story affordable historic
housing to restore [61]. Her neighborhood was set for demolition as part of urban renewal but an
official, after seeing the homes’ high ceilings and grand fireplaces, determined that the residents were
“clearly not slum dwellers.” Although Jacobs rode a bicycle to her job as editor at Architectural Forum,
her writings only encouraged people to see the city while walking [62]. The streets in the West Village
around 1958 included wide sidewalks, parallel parking, and roads for cars with no provisions for
bicyclists. Her suggestions about “eyes on the street” would have deterred crime but her community
sidewalks and streets were to remain the same and she, a daughter of a doctor in a neighborhood
deemed not a slum, may have been less aware of which environmental features best deter crime.Int. J. Environ. Res. Public Health 2019, 16, 484 12 of 21
Table 5. Surface and Context Design Variables Related to Crime or Crime Perception.
Bicycle Facility Design Variable—Perception of Crime or Crash One-Way Cycle Two-Way Cycle Shared-Use
Road Bike Lane Shar-row Total
Times the Design Variable Was Mentioned during the 13 Group Sessions Track Track Path
Surface/bicyclist’s right-of-way—High Risk of Crime (bicyclist vulnerable)
Bad condition of road surface (potholes, uneven color, oil on road where cars stop at intersection—low
1 3 4
vehicle maintenance, litter in street—old newspapers, etc.)
Narrowness of lane 2 2 4
Faded lines and symbols (bike stencil and arrows) 1 1 2
Surface/bicyclist’s right-of-way—Low Risk of Crime (bicyclist less vulnerable)
Two-way cycle track so know how to get back home 2 2
Surface/bicyclist’s right-of-way—High Risk Crash (more likely hit by vehicle)
No bike signs/stencils for bikers 1 16 1 1 19
Too narrow right-of-way 6 2 1 9
Sharrow nearer middle of road 4 4
Narrow cycle track with curbs on both sides 1 2 3
No section between parallel parked cars and cycle tracks for parked car doors to open 1 1 2
Surface/bicyclist’s right-of-way—Low Risk Crash (less likely hit by vehicle)
Median for cycle track (raised island, delineator posts, diagonal paint lines, etc.) 16 7 23
Paint or color (red) designating location for bicyclists (lane, cycle track) 6 1 1 1 9
Wide right-of-way (road, cycle track, etc.) 2 2 4
Bike symbol stencil/arrows for bikers 3 1 4
One way cycle track 2 2
Context of bicyclist—High Risk of Crime (bicyclist vulnerable)
Secluded/no people around (few people driving on wide streets) 2 8 5 12 2 1 30
Building types associated with crime (triple deckers, projects, solid walls, warehouses, closed
3 4 10 9 1 27
storefronts, abandoned buildings, check cashier business, etc.)
Dark (little sunlight and no street lights or lights from houses) 3 10 1 6 4 1 25
Too many trees, bushes, dense foliage, high grass 1 8 4 6 3 22
Hiding spots, cuts (spaces between buildings) 1 8 3 6 1 19
Houses, front steps, balconies not painted or maintained, graffiti, dirty signs, telephone poles leaning,
6 1 2 9
oil on road where parallel parked cars park (low maintenance on cars)
Too many people in crowds, tourist area 4 2 2 1 9
Side street (few cars, few eyes on street) 1 1 1 1 1 5
Narrow right-of-way or closed in 1 4 5
Only residential buildings or homes (everyone at work so no one sees crime) 2 1 3
McDonalds/fast food 3 3
Jumbled bike racks with too many bikes (can steal and not be noticed) 3 3
Low end stores and low end cars 1 1 2
Adjacent fence or knoll 1 1 2
Parallel parked cars (can hide between parked cars and also run away) 1 1 2
Lots of cars driving or parked 1 1 2Int. J. Environ. Res. Public Health 2019, 16, 484 13 of 21
Table 5. Cont.
Bicycle Facility Design Variable—Perception of Crime or Crash One-Way Cycle Two-Way Cycle Shared-Use
Road Bike Lane Shar-row Total
Times the Design Variable Was Mentioned during the 13 Group Sessions Track Track Path
Context of Bicyclist—Low Risk of Crime (bicyclist less vulnerable)
People out walking/driving and people watching from second story windows (see and report a crime) 6 7 6 3 22
Clean and nice signs, clean sidewalks 4 4 5 1 14
Open areas with good sight lines and not dark alleys 7 2 3 1 13
Balconies on houses, windows overlooking street from second story 3 4 1 2 10
A lot going on, sidewalk cafes with people sitting 4 2 1 1 8
Lots of light during day and at night 3 2 2 1 8
Commercial areas because have surveillance cameras 1 2 3 1 7
Mixed areas with residences and businesses 1 1 1 2 5
Flowers—nice plants 3 1 1 5
No trees or limbed up trees 1 3 4
High end stores and high end cars 2 2
Lots of little shops 2 2
Context of bicyclist—High Risk of Crash (more likely hit by vehicle)
Drivers going in different directions around the bicyclists, don’t know direction of drivers 5 10 11 4 30
Close to cars in motion 11 10 3 24
Painted lane/cycle track—could get doored on both sides (driver exiting parallel parked car and
4 2 13 1 20
passenger exiting car stopped in travel lane—van in lane)
Bike facility around bus stop, sharing road with buses, buses on both sides of bicyclist 9 9 18
Road encourages high speeds of vehicles, road rage, and drivers honking 1 4 3 8
Confusing paint 5 1 1 7
Able to be hit from behind 2 1 1 4
Too many intersection coming together 3 3
Context of bicyclist—Low Risk of Crash (less likely hit by vehicle)
More people around to call in crash with cell phone, get license number, stop driver, witness crash,
2 1 3 2 8
cameras
Not a lot of car traffic 2 1 1 1 5
High end cars on road 1 1 1 3
Bike signal at intersection 2 2
Few people out walking (peds get hit) 1 1 2Int. J. Environ. Res. Public Health 2019, 16, 484 14 of 21
There also are differences between the findings in this study and Crime Prevention Through
Environmental Design (CPTED) principles. CPTED proposes having people around for surveillance
and also not having dense shrubbery behind which a criminal could hide [20,21,23]. Four principles
have guided CPTED: (1) territoriality; (2) natural surveillance; (3) activity support; and (4) access
control [63]. Though territoriality might work for a building or a street in a gated residential compound,
bicycle facilities are public transportation throughways. Natural surveillance, activity support, and
access control involve high participation by local residents and, especially on a Main Street with shops
and cafes, all individuals should be welcomed. Crime is complex, especially as crime against a person
and the crime of household robbery are different [64]. Crime against a bicyclist involves the rider,
a person, or their bicycle, property, and both benefit from design guidelines written to serve the most
vulnerable populations.
4. Discussion
A bicyclist’s fear of crashing is a concern everywhere but in higher crime/lower income
neighborhoods the risks of having someone steal the bike while riding or being attacked at night in a
park lessens willingness to bike. Participants thought the two-way cycle track the safest from crime
because then the bicyclist knew how to get back home, a necessary feature in neighborhoods with
many one-way streets. To deter crime and crashes, participants perceived that cycle tracks should be
wide and freshly painted with a red surface color, bike symbols, and directional arrows. The cycle
tracks should also have a median, be on a main street, be near nice shops/mixed residential, not
pass by fast food places/low end stores/warehouses, have street lights, not have dense bushes/trees,
be clean (no litter), have nearby flowers and plants, and have a bike signal. For safety from crash,
participants thought the shared-use path and two-way cycle track were both safe but the shared-use
path was too isolated to deter crime.
The participants also commented on things that cannot be immediately changed including oil on
the road (cars not well maintained), low-end shops, hiding spots and cuts (spaces between buildings),
unpainted front stoops, leaning telephone poles, too few people around, drivers moving fast in
multiple directions, and too many intersections coming together. Therefore, the focus should be on
built environment features that are changeable but also additionally beneficial. Gentle guidance could
direct bicyclists in lower income/higher crime neighborhoods where to safely bike (cycle tracks with a
painted bike surface and a median), which direction to bike (bike stencils with directional arrows), and
when to cross an intersection (bike signals). Adding these directional bike features would lessen their
risk of being ticketed [65,66] and help with way-finding [67].
4.1. Crime Perception
Participants identified design solutions for crime but the issue would be whether to install the cycle
track first or lower crime first. The Dutch have safe bike environments on virtually all of the streets but,
in the U.S., the lower income neighborhoods are the last to receive safe bike environments [41,68,69].
Though bicyclists prefer what are called “low stress routes,” or routes that do not expose bicyclist to
high levels of stress from vehicular traffic [70], a quiet side street with few people is isolated. A better
policy might be to build cycle tracks first but on the streets with the lowest crime and highest visibility,
as on Main Street. Neighborhoods could have new-to-the-community cycle tracks as “cues to care” [71]
that display personal caring and good human intention. Having many bicyclists would make the
neighborhood social [72] because, unlike car occupants, bicyclists talk to neighbors.
While trees were associated with high crime, sight lines and lighting were associated with low
crime. Large trees obscure lighting from tall cobra-head streetlights but cycle-track-directed lower
lighting could brighten the bike route while leaving the overhead canopy for shade. Parallel parked
cars were associated with a high risk of crime and parked cars by a bike lane increase crashes [73].
Not having parallel-parked cars on both sides and having a cycle track on one side might lower crime
and crashes. Therefore, giving free parking permits and fostering road car storage [74] should beInt. J. Environ. Res. Public Health 2019, 16, 484 15 of 21
re-assessed with metrics of environment, health, and equity in a new Level of Service (LOS) [75]. Cycle
tracks in Denmark provide transportation equally to the poorest and wealthiest, better guaranteeing
that the poorest will not stay poor [76]. In the Maslow transportation Level of Service (LOS), safety and
security were basic needs to be met first [58] because risks make people unwilling to be active [18,77].
Women were more concerned about crime biking on the road, shared-use path, or bike lane than males,
a factor perhaps attributed to evolution, female’s risk aversion, and the need to care for young [48].
This study involved individuals who knew crime and similar survey research had been conducted
on bus and bus stop designs related to perceptions of crime in homeless shelters in inner city Detroit [78].
Those qualitative comments informed the design of new buses and this research might have useful
information to include in bicycle design guidelines, resulting in equitable bicycle facilities.
4.2. Crash Perception
Crash risk was lowest with shared-use paths and two-way cycle tracks yet males perceived a
shared-use path somewhat less safe from crashes. The males may already know of the conflicts with
other recreationists on shared-use paths [79,80]. For crashes, females judged roads, shared-use paths,
bike lanes, and sharrows as less safe, as confirmed in other bike studies on gender differences [81–84].
Women bicycle more slowly through intersections [85] and, because bicycle signals were associated
with low risk of crash, bicycle signals could be installed that provide more time. The bicycle signals
could have a red/green countdown number in the middle and red and green bicycles on the top and
bottom, as in China, to give maximum information to the bicyclists and car drivers.
4.3. If the Findings Are in Bicycle Facility Design Guidelines and CPTED Principles
The current AASHTO [27] and NACTO bicycle guidelines [59] detail how to build bicycle facilities
but the schematics resemble engineering plans for building roads and lack consideration of human
behavior perceptions, as identified by pioneers in the environment and behavior field of study [86–89].
These guidelines should have chapters that focus on the bike surface and the context. While Jane
Jacobs was able to help stop urban renewal and lessen crime through “eyes on the street,” her
vibrant neighborhood was primarily white upscale-chic and she focused on walking [62]. Crime
Prevention Through Environmental Design (CPTED) focuses on crime, such as burglary, and stresses
the importance of residents knowing their neighbors but people on a Main Street sidewalk or biking on
a cycle track will be strangers. CPTED also focuses on pedestrians who have their feet on the ground
while a bicyclist knocked from their bicycle can watch their bike disappear at speed. New CPTED
principles should address bicycle environments following the perceptions of the most vulnerable,
individuals in lower-income ethnically diverse communities.
4.4. Reflections on the Relevance and Implications of the Findings
Improving bike environments in lower-income ethnically diverse neighborhoods would increase
biking in these populations but all built environment changes should now respond to Climate Change.
If given cycle tracks, more individuals would bicycle [33–35,39,43,82,90] and, if bicycle and E-bike
usage increases, mobile source air pollution could be reduced by 11% [91]. A cycle track/Bus Rapid
Transit corridor with permeable surfaces and tree ditches would filter pollutants and foster tree growth,
lessening heat island effect [92–97]. Wide cycle tracks could also serve as evacuation routes [98–100]
because, in emergencies, non-functioning traffic lights and cars out of gas result in gridlock. Forceful
advocacy is necessary to get cycle tracks built and the responsibility then rests with the lower income
citizens. Rather than burden lower income residents with the unpaid time obligation of attending
countless transportation hearings, wide cycle track networks should be justified throughout the city
as a response to Climate Change. All of these cycle tracks should incorporate the design ideas of the
lower income ethnically diverse residents because the concerns of the most fearful of crashes and
crimes should come first.Int. J. Environ. Res. Public Health 2019, 16, 484 16 of 21
4.5. Limitations
There were 13 groups and only 212 total participants and this was not a random sample population.
A representative sample of pictures of bicycle environments were included but more were not included
due to time. Looking at the pictures on the large screen fostered discussions that might have biased the
results because some may have been quiet. Limitations notwithstanding, there are several strengths
including the populations sampled (community sense n = 116 and street sense n = 96) and their
willingness to contribute their time and observations about the pictures. About half were female and
87% knew how to bike. The participants and community organizers chose the location for their survey
and the food, enabling the participants to enjoy the process and understand that their comments were
to change their neighborhood.
5. Conclusions
During the 1950s and 60’s, construction of the U.S. Interstate Highway System was a form of
slum-clearance and the roads were identified as “white men’s roads through black men’s homes.” [101]
Some now suggest that “bike lanes are white lanes,” a term coined in Portland, Oregon when bike
lanes were painted in an ethnic-minority neighborhood [102]. Yet, research in an ethnic-minority
lower income community suggested the residents are biking and want cycle tracks [41]. While
US DOT funding, under the banner of economic development, paid for demolishing what some
considered slums and building highways, a new form of funding could spur economic development
in ethnic-minority neighborhoods through the construction of cycle tracks designed based on the
perceptions of residents.
To lower crash risk, participants wanted wide two-way cycle tracks with surface color, bike
stencils, arrows, and bicycle signals at the intersections. These features could help in wayfinding and
lessen risk of crash or getting a ticket for unlawful biking. For lowering crime risk, participants wanted
the wide cycle tracks to be on streets with high end stores, good sight lines, lighting, flowers, and
limbed up trees. Though some have suggested bicyclists could use low stress routes/quiet side roads
to lessen risk of crashing, those routes are isolated, making bicyclists in lower income neighborhoods
vulnerable to crime. Instead, the cycle tracks in lower income/higher crime neighborhoods could be
on Main streets where shops and cafes already exist and where more patrons would foster economic
development. Rather than gentrifying the neighborhood, local residents could own and operate
the shops and cafes. Because the current bicycle guidelines and CPTED principles do not include
these lower-income ethnic-minority-identified environmental insights, perhaps the publication of new
guidelines could help in the construction and location of bicycle facilities that serve all populations.
Author Contributions: Conceptualization, A.C.L., W.C.W.; Methodology, A.C.L., W.C.W., Y.L., C.B.; Software,
Y.L.; Formal Analysis, A.C.L., Y.L., W.C.W.; Investigation, A.C.L., C.B., V.M.; Resources, A.C.L.; Data Curation,
A.C.L., Y.L.; Writing—Original Draft Preparation, A.C.L.; Writing—Review & Editing, A.C.L., W.C.W., Y.L., VM;
Visualization, A.C.L.; Supervision, A.C.L.; Project Administration, A.C.L.; Funding Acquisition, A.C.L.
Funding: The authors would like to thank the Helen and William Mazer Foundation for funding this research.
Conflicts of Interest: Anne Lusk was supported by the Helen and William Mazer Foundation for this research.
Dr. Lusk has no conflicting funding sources, no conflicts of interest, and no financial disclosures. Walter Willett,
Vivien Morris, Christopher Byner, and Yanping Li have no conflicting funding sources, no conflicts of interest,
and no financial disclosures.
References
1. Wen, L.M.; Rissel, C. Inverse associations between cycling to work, public transport, and overweight and
obesity: Findings from a population based study in Australia. Prev. Med. 2008, 46, 29–32. [PubMed]
2. Lusk, A.C.; Mekary, R.A.; Feskanich, D.; Willett, W.C. Bicycle riding, walking, and weight gain in
premenopausal women. Arch. Intern. Med. 2010, 170, 1050–1056. [CrossRef]Int. J. Environ. Res. Public Health 2019, 16, 484 17 of 21
3. Menai, M.; Charreire, H.; Galan, P.; Simon, C.; Nazare, J.A.; Perchoux, C.; Weber, C.; Enaux, C.; Hercberg, S.;
Fezeu, L.; et al. Differential Associations of Walking and Cycling with Body Weight, Body Fat and Fat
Distribution - the ACTI-Cites Project. Obes. Facts 2018, 11, 221–231. [CrossRef]
4. Eriksson, M.; Udden, J.; Hemmingsson, E.; Agewall, S. Impact of physical activity and body composition on
heart function and morphology in middle-aged, abdominally obese women. Clin. Physiol. Funct. Imaging
2010, 30, 354–359. [CrossRef] [PubMed]
5. Sadik-Khan, J.; Solomonow, S. Improving Public Health by Making Cities Friendly to Walking and Biking:
Safer, More Active Transportation Starts With the Street. JAMA Intern. Med. 2017. [CrossRef] [PubMed]
6. Andersen, L.B.; Schnohr, P.; Schroll, M.; Hein, H.O. All-cause mortality associated with physical activity
during leisure time, work, sports, and cycling to work. Arch. Intern. Med. 2000, 160, 1621–1628. [CrossRef]
[PubMed]
7. Celis-Morales, C.A.; Lyall, D.M.; Welsh, P.; Anderson, J.; Steell, L.; Guo, Y.; Maldonado, R.; Mackay, D.F.;
Pell, J.P.; Sattar, N.; et al. Association between active commuting and incident cardiovascular disease, cancer,
and mortality: Prospective cohort study. BMJ 2017, 357, j1456. [CrossRef] [PubMed]
8. U.S. Census Bureau. Commuting Characteristics by Sex 2011–2015 American Community Survey 5-Year
Estimates. Available online: https://factfinder.census.gov/faces/tableservices/jsf/pages/productview.
xhtml?src=bkmk (accessed on 4 April 2018).
9. People for Bikes and Alliance for Biking and Walking. Building Equity Race, Ethnicity, Class, and Protected
Bike Lanes: An Idea Book for Fairer Cities; People for Bikes and Alliance for Biking and Walking: Boulder, CO,
USA, 2015.
10. Sallis, J.F.; Conway, T.L.; Dillon, L.I.; Frank, L.D.; Adams, M.A.; Cain, K.L.; Saelens, B.E. Environmental and
demographic correlates of bicycling. Prev. Med. 2013, 57, 456–460. [CrossRef]
11. August, K.J.; Sorkin, D.H. Racial/ethnic disparities in exercise and dietary behaviors of middle-aged and
older adults. J. Gener. Intern. Med. 2011, 26, 245–250. [CrossRef]
12. Rosenberg, L.; Kipping-Ruane, K.L.; Boggs, D.A.; Palmer, J.R. Physical activity and the incidence of obesity
in young african-american women. Am. J. Prev. Med. 2013, 45, 262–268. [CrossRef]
13. Flegal, K.M.; Kruszon-Moran, D.; Carroll, M.D.; Fryar, C.D.; Ogden, C.L. Trends in Obesity Among Adults
in the United States, 2005 to 2014. JAMA 2016, 315, 2284–2291. [CrossRef] [PubMed]
14. Brown, C. Fear: A Silent Barrier to Bicycling in Black and Hispanic Communities. Available
online: https://nacto.org/wp-content/uploads/2017/03/2016_Brown_Fear-A-Silent-Barrier-to-Bicycling-
in-Black-and-Hispanic-Communities.pdf (accessed on 8 January 2019).
15. Centers for Disease Control and Prevention. Neighborhood Safety and the Prevalence of Physical
Inactivity—Selected States, 1996. Morb. Mortal. Wkly. Rep. 1999, 47, 143–146.
16. Evenson, K.R.; Scott, M.M.; Cohen, D.A.; Voorhees, C.C. Girls’ perception of neighborhood factors on
physical activity, sedentary behavior, and BMI. Obesity 2007, 15, 430–445. [CrossRef] [PubMed]
17. U.S. Department of Health and Human Services. Healthy People 2010, Understanding and Improving Health,
2nd ed.; U.S. Department of Health and Human Services: Washington, DC, USA, 2000.
18. Foster, S.; Giles-Corti, B. The built environment, neighborhood crime and constrained physical activity:
An exploration of inconsistent findings. Prev. Med. 2008, 47, 241–251. [CrossRef] [PubMed]
19. Appleyard, B.; Ferrell, C. A105 The Meaning of “Mean Streets” for Sustainable & Active Travel: Crime,
(Pedestrian/Bike) Casualities and Mode Choice. J. Transp. Health 2015, 2, S5–S63.
20. Jacobs, J. The Death and Life of Great American Cities; Vintage Books: New York, NY, USA, 1961.
21. Jeffrey, C.R. Crime Prevention Through Environmental Design; Sage Publications: Beverly Hills, CA, USA, 1971.
22. Jeffrey, C.R. Criminology: An Interdisciplinary Approach; Prentice-Hall: Engelwood Cliffs, NJ, USA, 1990.
23. Newman, O. Defensible Space: Crime Prevention Through Urban Design; Macmillan: New York, NY, USA, 1972.
24. Kelling, G.; Coles, C. Fixing Broken Windows: Restoring Order and Reducing Crime in Our Communities;
Simon & Schuster: New York, NY, USA, 1996.
25. Winters, M.; Brauer, M.; Setton, E.M.; Teschke, K. Built environment influences on healthy transportation
choices: Bicycling versus driving. J. Urban Health 2010, 87, 969–993. [CrossRef]
26. Yu, C.Y. Environmental supports for walking/biking and traffic safety: Income and ethnicity disparities.
Prev. Med. 2014, 67, 12–16. [CrossRef]Int. J. Environ. Res. Public Health 2019, 16, 484 18 of 21
27. American Association of State Highway and Transportation Officials. Guide for the Development of Bicycle
Facilities; American Association of State Highway and Transportation Officials: Washington, DC, USA, 2012;
Volume 4.
28. Forester, J. Effective Cycling; Custom Cycle Fitments: Berkeley, CA, USA, 1976.
29. League of American Bicyclists. Our Classes. Available online: https://www.bikeleague.org/content/find-
take-class (accessed on 16 August 2018).
30. Pucher, J.; Buehler, R. Making Cycling Irresistible: Lessons from the Netherlands, Denmark, and Germany.
Transp. Rev. 2008, 28, 1–34. [CrossRef]
31. CROW. Design Manual for Bicycle Traffic; National Information and Technology Platform for Infrastructure,
Traffic, Transport, and Public Space: Amsterdam, The Netherlands, 2006.
32. Verkeersnet.nl. Fietsersbond: Veel Meer Fietspad dan Bekend in Ons Land. Available online: http://www.
verkeersnet.nl/1782/fietsersbond-veel-meer-fietspad-dan-bekend-in-ons-land/ (accessed on 21 April 2018).
33. Lusk, A.C.; Morency, P.; Miranda-Moreno, L.F.; Willett, W.C.; Dennerlein, J.T. Bicycle guidelines and crash
rates on cycle tracks in the United States. Am. J. Public Health 2013, 103, 1240–1248. [CrossRef]
34. Thomas, B.; DeRobertis, M. The safety of urban cycle tracks: A review of the literature. Accid. Anal. Prev.
2013, 52, 219–227. [CrossRef]
35. Teschke, K.; Harris, M.A.; Reynolds, C.C.; Winters, M.; Babul, S.; Chipman, M.; Cusimano, M.D.;
Brubacher, J.R.; Hunte, G.; Friedman, S.M.; et al. Route Infrastructure and the Risk of Injuries to Bicyclists:
A Case-Crossover Study. Am. J. Public Health 2012, 102, 2336–2343. [CrossRef] [PubMed]
36. Buehler, R.; Pucher, J. Trends in Walking and Cycling Safety: Recent Evidence From High-Income Countries,
With a Focus on the United States and Germany. Am. J. Public Health 2017, 107, 281–287. [CrossRef] [PubMed]
37. Li, H.; Graham, D.J.; Liu, P. Safety effects of the London cycle superhighways on cycle collisions. Accid. Anal.
Prev. 2017, 99, 90–101. [CrossRef]
38. Manton, R.; Rau, H.; Fahy, F.; Sheahan, J.; Clifford, E. Using mental mapping to unpack perceived cycling
risk. Accid. Anal. Prev. 2016, 88, 138–149. [CrossRef]
39. Lusk, A.C.; Furth, P.G.; Morency, P.; Miranda-Moreno, L.F.; Willett, W.C.; Dennerlein, J.T. Risk of injury for
bicycling on cycle tracks versus in the street. Inj. Prev. 2011, 17, 131–135. [CrossRef] [PubMed]
40. Winters, M.; Teschke, K. Route preferences among adults in the near market for bicycling: Findings of the
cycling in cities study. Am. J. Health Promot. 2010, 25, 40–47. [CrossRef] [PubMed]
41. Lusk, A.; Anastasio, A.; Shaffer, N.; Wu, J.; Li, Y. Biking practices and preferences in a lower income, primarily
minority neighborhood: Learning what residents want. Prev. Med. Rep. 2017, 7, 232–238. [CrossRef]
42. PeopleforBikes. Protected Bike Lanes Updated 05 05 2017. Available online: https://docs.google.
com/spreadsheets/d/11H0gArHxo6kMop1I18yMcq7ArbNrwaGBLmIXgqI1Gjk/edit#gid=3 (accessed on
21 May 2018).
43. Pucher, J.; Buehler, R. Safer Cycling Through Improved Infrastructure. Am. J. Public Health 2016, 106,
2089–2091. [CrossRef]
44. Schultheiss, W.; Sanders, R.; Toole, J. A Historical Perspective on the AASHTO Guide for the Development
of Bicycle Facilities and the Impact of the Vehicular Cycling Movement. Transp. Res. Board 2018. [CrossRef]
45. Greibe, P.; Skallebaek Buck, T. Capacity and Behavior on One-way Cycle Tracks of Different Widths. Transp.
Res. Procedia 2016, 15, 122–136. [CrossRef]
46. Lusk, A.C.; Asgarzadeh, M.; Farvid, M.S. Database improvements for motor vehicle/bicycle crash analysis.
Inj. Prev. 2015, 21, 221–230. [CrossRef] [PubMed]
47. Ratanavaraha, V.; Jommonkwao, S. The efficienty testing of Shoulder Rumble Strips (SRS) on noise alerting
drivers in Thailand: A comparison among three SRS. Adv. Transp. Stud. Int. J. 2015, 36, 109–118.
48. Taylor, S.E.; Klein, L.C.; Lewis, B.P.; Gruenewald, T.L.; Gurung, R.A.; Updegraff, J.A. Biobehavioral responses
to stress in females: Tend-and-befriend, not fight-or-flight. Psychol. Rev. 2000, 107, 411–429. [CrossRef]
[PubMed]
49. Jaffe, E. The Poor Bike, The Rich Bike-Share. Available online: https://www.citylab.com/transportation/
2015/10/the-poor-bike-the-rich-bike-share/413119/ (accessed on 15 August 2018).
50. Boston Police Department and Suffolk County District Attorney’s Office. Murders in Boston During
2010. Available online: http://www.boston.com/news/local/massachusetts/2010_murders_in_boston/
(accessed on 5 May 2011).You can also read