Borehole Analysis, Single-Well Aquifer Testing, and Water Quality for the Burnpit Well, Mount Rushmore National Memorial, South Dakota
←
→
Page content transcription
If your browser does not render page correctly, please read the page content below
Prepared in cooperation with the National Park Service

Borehole Analysis, Single-Well Aquifer Testing, and Water
Quality for the Burnpit Well, Mount Rushmore National
Memorial, South Dakota

Scientific Investigations Report 2021–5059

U.S. Department of the Interior
U.S. Geological Survey
Cover: Photographs showing Burnpit well in Mount Rushmore National Monument, taken June
24, 2020, and (inset) Burnpit well pumping in Mount Rushmore National Monument, taken August 12,
2020. Photographs by William Eldridge, U.S. Geological Survey.
Borehole Analysis, Single-Well Aquifer
Testing, and Water Quality for the Burnpit
Well, Mount Rushmore National Memorial,
South Dakota
By William G. Eldridge, Galen K. Hoogestraat, and Steven E. Rice

Prepared in cooperation with the National Park Service

Scientific Investigations Report 2021–5059

U.S. Department of the Interior
U.S. Geological Survey
U.S. Geological Survey, Reston, Virginia: 2021 For more information on the USGS—the Federal source for science about the Earth, its natural and living resources, natural hazards, and the environment—visit https://www.usgs.gov or call 1–888–ASK–USGS. For an overview of USGS information products, including maps, imagery, and publications, visit https://store.usgs.gov/. Any use of trade, firm, or product names is for descriptive purposes only and does not imply endorsement by the U.S. Government. Although this information product, for the most part, is in the public domain, it also may contain copyrighted materials as noted in the text. Permission to reproduce copyrighted items must be secured from the copyright owner. Suggested citation: Eldridge, W.G., Hoogestraat, G.K., and Rice, S.E., 2021, Borehole analysis, single-well aquifer testing, and water quality for the Burnpit well, Mount Rushmore National Memorial, South Dakota: U.S. Geological Survey Scientific Investigations Report 2021–5059, 29 p., https://doi.org/10.3133/sir20215059. Associated data for this publication: Eldridge, W.G., and Hoogestraat, G.K., 2021, Borehole video and aquifer test data for the Burnpit well, Mount Rushmore National Memorial, South Dakota, 2020: U.S. Geological Survey data release, https://doi.org/10.5066/ P98OZQN9. U.S. Geological Survey, 2021, USGS water data for the Nation: U.S. Geological Survey National Water Information System database, accessed January 29, 2021, at https://doi.org/10.5066/F7P55KJN. ISSN 2328-0328 (online)
iii

Acknowledgments
The authors wish to acknowledge Rene Ohms, National Park Service, Mount Rushmore National
Memorial, for assistance and access to the sites referenced in this study. Additionally, many
members of the National Park Service assisted with data collection. Without their assistance,
the study would not have been possible.

v
Contents
Acknowledgments����������������������������������������������������������������������������������������������������������������������������������������iii
Abstract�����������������������������������������������������������������������������������������������������������������������������������������������������������1
Introduction����������������������������������������������������������������������������������������������������������������������������������������������������2
Purpose and Scope������������������������������������������������������������������������������������������������������������������������������4
Previous Studies�����������������������������������������������������������������������������������������������������������������������������������4
Study Area Description������������������������������������������������������������������������������������������������������������������������5
Climate�������������������������������������������������������������������������������������������������������������������������������������������7
Geologic Setting���������������������������������������������������������������������������������������������������������������������������7
Hydrogeology�����������������������������������������������������������������������������������������������������������������������������10
Methods for Data Collection and Analysis����������������������������������������������������������������������������������������������11
Borehole Analysis�������������������������������������������������������������������������������������������������������������������������������11
Single-Well Aquifer Testing��������������������������������������������������������������������������������������������������������������11
Water Quality���������������������������������������������������������������������������������������������������������������������������������������15
Borehole Analysis, Single-Well Aquifer Testing, and Water Quality��������������������������������������������������17
Borehole Analysis�������������������������������������������������������������������������������������������������������������������������������17
Single-Well Aquifer Testing��������������������������������������������������������������������������������������������������������������20
Transmissivity Estimates�����������������������������������������������������������������������������������������������������������20
Aquifer Storage Estimates�������������������������������������������������������������������������������������������������������21
Hypothetical Equilibrium Drawdown��������������������������������������������������������������������������������������22
Water Quality���������������������������������������������������������������������������������������������������������������������������������������23
Summary�������������������������������������������������������������������������������������������������������������������������������������������������������25
References Cited�����������������������������������������������������������������������������������������������������������������������������������������27
Figures
1. Map showing study area and geographic features, wells, a borehole, and
springs at Mount Rushmore National Memorial, South Dakota, 2021���������������������������������3
2. Graph showing annual precipitation and cumulative difference from annual
normal, in inches, at Mount Rushmore National Memorial from 1981 through
2020 observed at National Oceanic and Atmospheric Administration climate
station USC00395870 with missing data substituted with daily data from climate
station USC00393868��������������������������������������������������������������������������������������������������������������������8
3. Map and cross section showing geology of Mount Rushmore National Memorial����������9
4. Photograph showing the Burnpit well during aquifer testing on June 24, 2020, at
Mount Rushmore National Memorial��������������������������������������������������������������������������������������15
5. Graph showing time and water-level displacement curves for the National Park
Service 2009 and the U.S. Geological Survey 2020 aquifer tests of the Burnpit
well, Mount Rushmore National Memorial����������������������������������������������������������������������������17
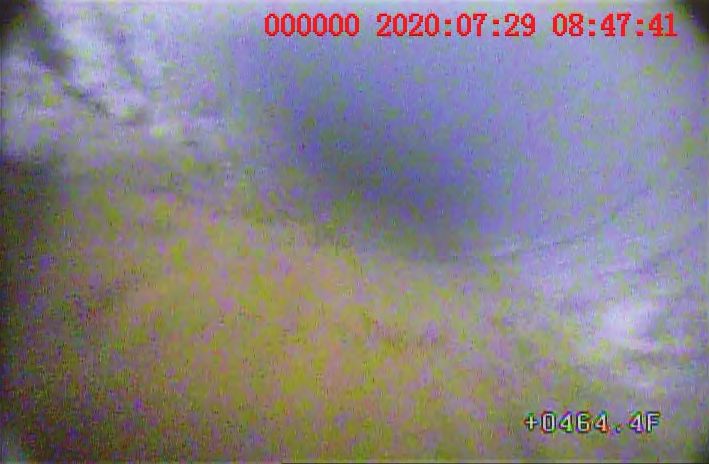
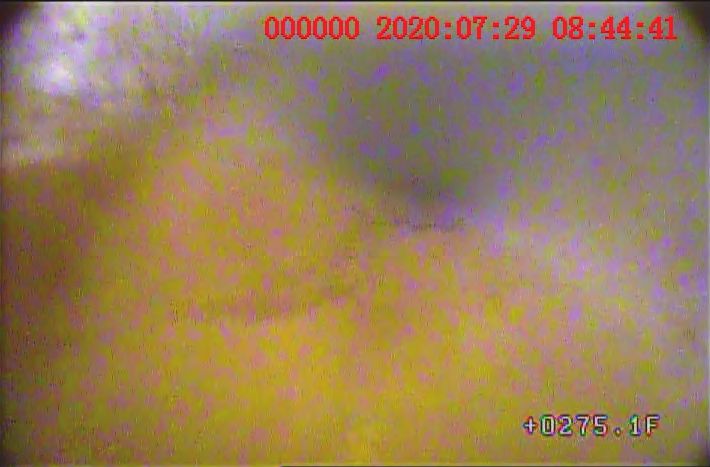
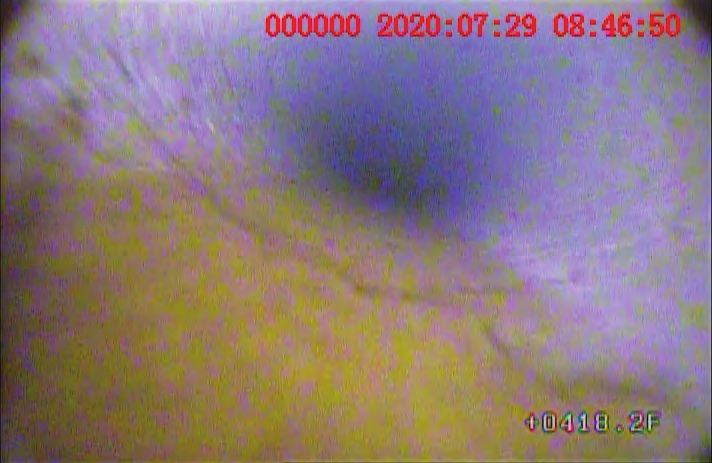
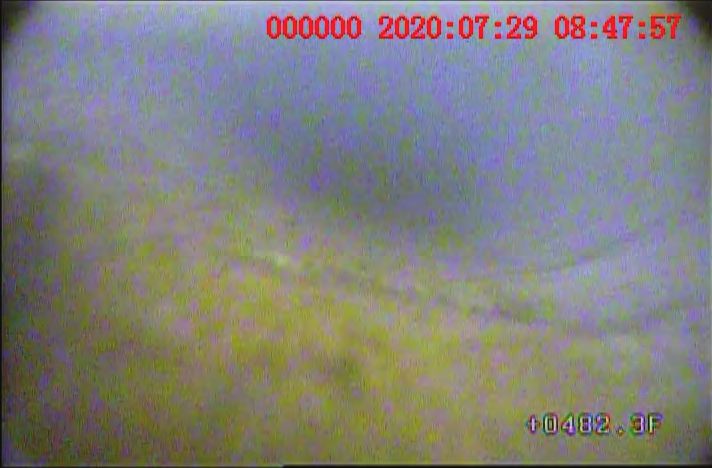
6. Images from borehole camera video recorded on June 23 and July 29 of the
Burnpit well at Mount Rushmore National Memorial by National Park Service
personnel�������������������������������������������������������������������������������������������������������������������������������������19
7. Graphs showing water-level displacement and time with analytical method and
curve-matching results for the National Park Service aquifer test completed on
August 25, 2009����������������������������������������������������������������������������������������������������������������������������21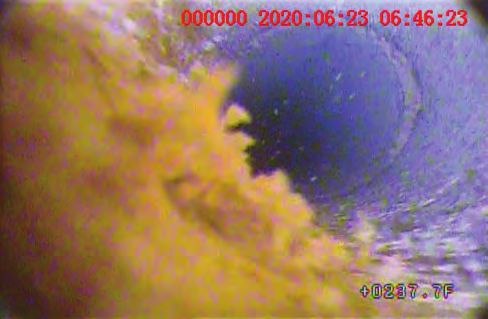
vi

             8. Graphs showing water-level displacement and time with analytical method and
                curve-matching results for the U.S. Geological Survey aquifer test completed
                on June 24, 2020��������������������������������������������������������������������������������������������������������������������������22

     Tables
             1. Inventory of wells, a borehole, and springs at Mount Rushmore National
                Memorial, South Dakota, 2021����������������������������������������������������������������������������������������������������4
             2. South Dakota water rights permits maintained by the National Park Service at
                Mount Rushmore National Memorial as of January 2021, listed by priority date��������������6
             3. Water-level and time data recorded during Burnpit well aquifer tests on
                August 25, 2009, by the National Park Service and on June 24, 2020, by the U.S.
                Geological Survey�����������������������������������������������������������������������������������������������������������������������13
             4. Input parameter values for the Burnpit well and aquifer characteristics used by
                AQTESOLV to estimate transmissivity and storage parameters from aquifer-test
                data collected August 25, 2009, and June 24, 2020, at Mount Rushmore National
                Memorial��������������������������������������������������������������������������������������������������������������������������������������16
             5. Lithologic descriptions of geologic formations of the Burnpit well from the
                driller well log with depth to the top and bottom of the units from land surface,
                unit thicknesses, and estimated pumping rate����������������������������������������������������������������������18
             6. Single-well aquifer-test analytical results from curve-matching techniques
                applied to the upper and lower zones of the aquifer using early and late
                pumping data�������������������������������������������������������������������������������������������������������������������������������23
             7. Water-quality data from samples collected at the Burnpit well and relevant
                standards for comparison, June–July 2020���������������������������������������������������������������������������24

     Conversion Factors
     U.S. customary units to International System of Units

                              Multiply                                          By                                      To obtain
                                                                             Length
      inch (in.)                                                       2.54                     centimeter (cm)
      inch (in.)                                                       25.4                     millimeter (mm)
      foot (ft)                                                        0.3048                   meter (m)
      mile (mi)                                                        1.609                    kilometer (km)
                                                                               Area
      acre                                                             4,047                    square meter (m2)
      acre                                                             0.4047                   hectare (ha)
      acre                                                             0.4047                   square hectometer (hm2)
      acre                                                             0.004047                 square kilometer (km2)
                                                                             Volume
      gallon (gal)                                                     3.785                    liter (L)
      gallon (gal)                                                     0.003785                 cubic meter (m3)
      gallon (gal)                                                     3.785                    cubic decimeter (dm3)
      million gallons (Mgal)                                           3,785                    cubic meter (m3)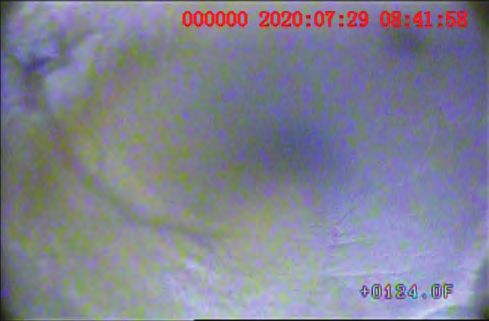
vii

                    Multiply                              By                          To obtain
                                                        Flow rate
 cubic foot per second (ft3/s)                    0.02832            cubic meter per second (m3/s)
 gallon per minute (gal/min)                      0.06309            liter per second (L/s)
 million gallons per year (Mgal/yr)               0.000120           cubic meter per second (m3/s)
                                                 Specific capacity
 gallon per minute per foot ([gal/min]/ft)        0.2070             liter per second per meter ([L/s]/m)
                                                   Transmissivity
 foot squared per day (ft2/d)                     0.09290            meter squared per day (m2/d)

International System of Units to U.S. customary units

                     Multiply                                By                        To obtain
                                                         Length
 millimeter (mm)                                        0.03937       inch (in.)
Temperature in degrees Celsius (°C) may be converted to degrees Fahrenheit (°F) as follows:
					                                °F = (1.8 × °C) + 32.
Temperature in degrees Fahrenheit (°F) may be converted to degrees Celsius (°C) as follows:
					                                °C = (°F – 32) / 1.8.

Datum
Vertical coordinate information is referenced to the North American Vertical Datum of 1988
(NAVD 88).
Horizontal coordinate information is referenced to the North American Datum of 1983 (NAD 83).
Elevation, as used in this report, refers to distance above the vertical datum.

Supplemental Information
Specific conductance is given in microsiemens per centimeter at 25 degrees Celsius (µS/cm
at 25 °C).
Concentrations of chemical constituents in water are given in either milligrams per liter (mg/L)
or micrograms per liter (µg/L).

Abbreviations
EPA           U.S. Environmental Protection Agency
NPS           National Park Service
USGS          U.S. Geological Survey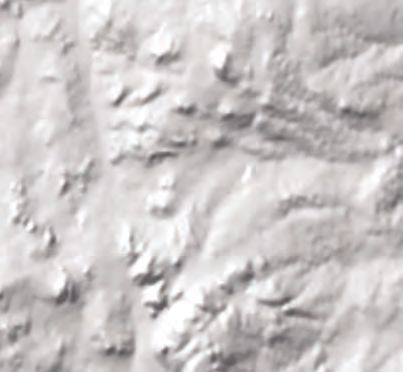
Borehole Analysis, Single-Well Aquifer Testing, and Water
Quality for the Burnpit Well, Mount Rushmore National
Memorial, South Dakota
By William G. Eldridge,1 Galen K. Hoogestraat,1 and Steven E. Rice2

Abstract                                                           transmissivity estimates of 7.7 and 10 ft2/d, and the Cooper-
                                                                   Jacob method produced estimates of 9.7 and 12 ft2/d,
                                                                   respectively.
      Mount Rushmore National Memorial (hereafter referred               Storativity (specific yield) estimated using the Theis
to as “the memorial”), in western South Dakota, is maintained      method for the NPS aquifer-test data was 0.85 and 0.92 for the
by the National Park Service (NPS) and includes 1,278 acres        upper and lower drawdown zones of the aquifer, respectively.
of land in the east-central part of the Black Hills. An ongo-      The Cooper-Jacob method applied to the NPS aquifer-test data
ing challenge for NPS managers at the memorial is providing        produced storativity estimates of 0.11 and 0.50 for the upper
water from sustainable and reliable sources for operations,        and lower drawdown zones, respectively. The Theis method
staff, and the increasing number of visitors. In 2020, the         applied to the USGS aquifer-test data estimated storativity val-
U.S. Geological Survey (USGS) and NPS completed a hydro-           ues of 0.77 and 1.0 for the upper and lower drawdown zones,
logical study of the Burnpit well (well 5), a 580-foot-deep        respectively. The Cooper-Jacob method estimated storativity
open hole groundwater well completed in metamorphic (crys-         of 0.50 and 0.60 for the upper and lower drawdown zones of
talline) rock at the memorial. The purpose of this study was to    the USGS aquifer test, respectively. The estimated storativity
estimate the geological and hydraulic properties of the aquifer    values from the NPS and USGS aquifer tests for the upper and
supplying the well and to determine the water quality of the       lower drawdown zones were higher than expected for lime-
groundwater from the well. The study provides NPS staff and        stones and schists.
managers background information for assessing future uses for            The hypothetical equilibrium drawdown for the Burnpit
the well. Methods for data collection and analysis for the study   well was estimated after the NPS test in 2009 at no more,
included borehole and video camera analysis in 2020, aquifer       and possibly less, than 35 gallons per minute. The NPS noted
testing by the NPS in 2009 and the USGS in 2020, and water-        that the sustainable yield likely was overestimated because
quality sampling in 2020.                                          the water level did not stabilize during the NPS aquifer test.
      Borehole camera video generally matched the lithology
                                                                   The specific capacity for the NPS aquifer test in 2009 was
recorded in the well log. Fractures recorded in the well log and
                                                                   0.16 gallon per minute per foot ([gal/min]/ft) of drawdown at
observed with the borehole camera, including more than 20          3 hours, and the specific capacity for the USGS aquifer test
less prominent fractures and rough sidewall areas, indicated       in 2020 was 0.13 (gal/min)/ft of drawdown at 3 hours. The
a fractured aquifer. The fractures are the primary conduits for    rate of water-level recovery after pumping ceased was 0.017
groundwater flow through the rock and into the well.               and 0.013 (gal/min)/ft for the NPS and USGS aquifer tests,
      Transmissivity was estimated for the upper and lower         respectively. The water-level recovery rate was nearly an order
water-level drawdown zones at the Burnpit well with data           of magnitude less than the specific capacity estimated during
from the NPS and USGS using the Theis and Cooper-Jacob             pumping, indicating that water levels in the Burnpit well may
methods. Transmissivity for the NPS test using the Theis           not recover quickly enough during pumping to provide for a
method was 9.0 and 11 feet squared per day (ft2/d) for the         continuous source of water.
upper and lower drawdown zones, respectively. Using the                  Water-quality samples were collected at the Burnpit well
Cooper-Jacob method, the transmissivity was 22 and 14 ft2/d        on June 24 and July 23, 2020, and analyzed for field-measured
for the upper and lower drawdown zones of the aquifer,             properties, major ions, metals, nutrients, and perchlorate.
respectively. Transmissivity estimates from data from the          Iron, zinc, and lithium concentrations for unfiltered samples
USGS test were similar. The Theis method, applied to the           in the well were at least three times greater than the mean
upper and lower drawdown zones of the aquifer, produced            filtered sample concentrations reported for crystalline aquifers
                                                                   in the Black Hills. Manganese concentrations were less than
  1U.S.   Geological Survey.                                       the mean concentration for crystalline aquifers but exceeded
  2National   Park Service.                                        the U.S. Environmental Protection Agency (EPA) secondary
2 Borehole Analysis, Single-Well Aquifer Testing, and Water Quality for the Burnpit Well, Mount Rushmore National Memorial
drinking-water standards. The iron concentration from the Throughout the history of the memorial, water supplies
June 24 sample was about 11 times greater than the EPA for operations, staff, and visitors were provided by springs and
secondary drinking-water standards and mean concentrations wells from several sites (table 1, fig. 1). From 1927 to 1967,
from crystalline aquifers in the Black Hills. Arsenic con- a cluster of springs named Rushmore Spring (spring 3, fig. 1)
centrations in Burnpit well samples collected in 2020 were was developed to provide water for operational uses (Powell
greater than the EPA primary drinking-water standard and the and others, 1973). Several other springs were mapped at the
mean concentration for crystalline aquifers in the Black Hills. memorial, and Grizzly Bear Spring (spring 6, fig. 1) was
Arsenic occurs naturally in the rock of crystalline aquifers, developed in the late 1950s to provide water to a campground.
and concentrations from samples in the Black Hills com- In 1950, a 75,000-gallon (gal) water storage reservoir was
monly exceed the EPA primary drinking-water standard of constructed, and in 1956, a 500,000-gal water storage reser-
10 micrograms per liter. High concentrations of arsenic, iron, voir was added with distribution lines to gravity feed water
and manganese metals in the Burnpit well make groundwater from Rushmore Spring to the water treatment plant, pump
from the well in its natural state unusable as a drinking-water house, and housing. Wells 1 and 2 and an unnamed borehole
source, and water treatment would be necessary to reduce the near spring 4 (fig. 1) were drilled in 1960 but were not used
trace element concentrations to less than the EPA primary and as water supplies because of low yields and existing water
secondary drinking-water standards. However, if the memo- sources from Rushmore Spring were closer to the distribution
rial has immediate nonpotable water requirements, such as system (Powell and others, 1973).
for construction and fire suppression, groundwater from the Well 3 (referred to by NPS staff as “well 1”; table 1,
Burnpit well could provide water without causing additional fig. 1) was completed in July 1967 to a depth of 200 feet
stress to current (2021) drinking-water sources. (ft) as part of a geologic study. In October 1967, well 3
was integrated into the water production system and began
replacing Rushmore Spring as the primary water source. In
September 1967, well 4 (fig. 1) was completed to a depth
Introduction of 500 ft but was never used because of low yield (Powell
and others, 1973). A third 125,000-gal reservoir was added
Mount Rushmore National Memorial (hereafter referred to the water storage system in 1978. From 1967 through
to as “the memorial”), in western South Dakota, is maintained 2010, well 3 was the primary water source (Hoogestraat and
by the National Park Service (NPS) and includes 1,278 acres Rowe, 2016), and in 2010, well 6 (referred to by NPS staff as
of land in the east-central part of the Black Hills (fig. 1). In “well 2”; table 1, fig. 1) was completed to a depth of 500 ft to
1925, the U.S. Congress passed legislation allowing sculptures supplement water provided by well 3. The NPS maintains five
of four former U.S. presidents in the exposed granite on the permits from the South Dakota Department of Environment
southeast face of Mount Rushmore. Work on the sculptures and Natural Resources for water rights at the memorial with
began in 1927 and was declared complete in 1941. The num- three of the five permits (US596–2, 2588–2, and 2736–2)
ber of visitors to the memorial increased from 393,000 in 1941 licensing a total of 0.122 cubic foot per second (ft3/s) (about
to more than 2,000,000 in 2020 with a maximum annual atten- 55 gallons per minute [gal/min]) for water production, and two
dance of more than 2,400,000 in 2017 (National Park Service, permits (528–2 and US560–2A) licensing 0.0088 ft3/s (4 gal/
2020). An ongoing challenge for NPS managers at the memo- min) for Grizzly Bear Spring and 0.066 ft3/s (30 gal/min) for
rial is providing water from sustainable and reliable sources well 1, respectively (table 2; South Dakota Department of
for operations, staff, and the increasing number of visitors. Environment and Natural Resources, 2021).
Water use at Mount Rushmore includes drinking water, The Burnpit well (well 5; fig. 1) was completed at the
fire suppression, construction, infrastructure maintenance, memorial in 2008 to a depth of 580 ft in metamorphic (crystal-
equipment cleaning, and concessionaire use. The demand for line) rock. The Burnpit well was intended to supplement exist-
water to support these uses has increased with time. Between ing water sources but was not integrated into the water distri-
1968 and 1970, the total water consumed at the memorial bution system and has remained unused since construction. In
was between 6.8 and 7.7 million gallons per year (Powell and 2020, the U.S. Geological Survey (USGS) and NPS completed
others, 1973). In 2016, water pumped from wells reached an a hydrological study of the Burnpit well at the memorial to
annual maximum of about 8.6 million gallons (Molly Davis, estimate the geological and hydraulic properties of the aquifer
National Park Service, written commun., 2021). NPS staff are supplying the well and to measure the water quality of the
interested in understanding the hydrogeology, potential pro- groundwater from the well. The hydrologic study provides
duction capacity, and water chemistry of existing wells to meet NPS staff and managers background information that can be
existing and future water demands. used for assessing future uses for the well.Introduction 3
103°28' R. 5E. R. 6E. 103°27' 103°26'
Well 4
12 7 8 Well 1
16A
244
Borehole
4 4
Well 6
43°53'
244
3 (Rushmore Spring)
4 Well 3
5 (Red Spring)
4
MOUNT RUSHMORE
1
T.
4
2
S.
Sculptures
Well 5
(Burnpit Well)
13 18 17
Climate
station 6 4
(Grizzly Bear Spring)
2
4
Well 2
24 19 20
43°52'
Base modified from U.S. Department of Agriculture (2020) 0 0.25 0.5 MILE
Universal Transverse Mercator projection, zone 13
0 0.25 0.5 KILOMETER
EXPLANATION MONTANA
NORTH DAKOTA
Mount Rushmore National Memorial
boundary (study area) MINNESOTA
Well 1 Well with label
4
1
Spring with label, tail indicates BLACK
SOUTH DAKOTA
direction of discharge HILLS
MOUNT RUSHMORE
NATIONAL MEMORIAL
Borehole WYOMING
Stream IOWA
8 Public Land Survey System NEBRASKA
section number
Figure 1. Study area and geographic features, wells, a borehole, and springs at Mount Rushmore National Memorial, South
Dakota, 2021.4 Borehole Analysis, Single-Well Aquifer Testing, and Water Quality for the Burnpit Well, Mount Rushmore National Memorial
Table 1. Inventory of wells, a borehole, and springs at Mount Rushmore National Memorial, South Dakota, 2021.
[USGS, U.S. Geological Survey; NWIS, National Water Information System; gal/min, gallon per minute; (gal/min)/ft, gallon per minute per foot;
--, not applicable; in., inch; ft, foot; SD DENR, South Dakota Department of Environment and Natural Resources; NPS, National Park Service]
Well depth
USGS NWIS Well
Number Date well (feet below
Site type identification Site names1 Water use diameter Aquifer2
(fig. 1) completed land
number (inches)
surface)
Well 1 435230103254501 2–6–8–cad2 July 1960 Not used 62.5 8 Alluvium
2 435206103273701 2–5–13ddd July 1960 Not used 58 8 Alluvium
3 435300103265001 Well 1; July 14, 1967 Production 200 6 Crystalline rock
2–6–7cdd2
4 -- 2–6–8cad1 Sept. 8, 1967 Not used 500 6 Crystalline rock
5 435240103265301 Burnpit well Oct. 29, 2008 Not used 580 8-in. for 42 Crystalline rock
ft; then
6-in.
(open
hole)
6 435302103270501 Well 2 June 16, 2010 Production 500 8 Crystalline rock
Borehole -- -- Test hole 1960 Not used 94 -- Crystalline rock
Spring 1 -- 2–5–13aac -- Not used -- -- --
2 435215103273501 2–5–13dda -- Not used -- -- --
3 435301103270201 Rushmore -- Production -- -- --
Spring;
2–6–7cdd1
4 -- 2–6–8ccb -- Not used -- -- --
5 -- Red Spring; -- Not used -- -- --
2–6–18abb
6 435231103265101 Grizzly Bear -- Not used -- -- --
Spring;
2–6–18dbb
1Site names from Powell and others (1973) or commonly used by NPS staff.
2Powell and others (1973) describe crystalline aquifers as metamorphic rock aquifers.
Purpose and Scope tests were collected by the NPS in 2009 and by the USGS
in 2020. Water-quality samples were collected in June and
The purpose of this report is to document the methods, July 2020 at the Burnpit well and analyzed for 36 constituents.
data, and results from borehole analyses; two single-well
aquifer tests; and water-quality sampling and analysis of the
Burnpit well at the memorial. The scope of the report includes Previous Studies
data only for the Burnpit well and does not include data and
Powell and others (1973) summarized previous stud-
analyses for the two production wells (wells 3 and 6) in use as
ies completed before 1973 describing geologic features
of 2021. Borehole analyses used lithologic information from
near Mount Rushmore that included Darton (1901, 1918),
literature, well logs, and images from borehole camera surveys
Darton and Paige (1925), and Page and others (1953). Powell
in June and July 2020. Data for the two single-well aquifer
and others (1973) also provided an early hydrogeologicalIntroduction 5
Water level Date range of Discharge Specific
Date of discharge Relative yield
(feet below water-level rate capacity References
measurements (gal/min)
land surface) measurements (gal/min) ([gal/min]/ft)
4.5–9.5 Dec. 1966–May -- -- -- 29–30 Powell and others,
1968 1973; SD DENR,
2021
2.1–3.6 Dec. 1966–May -- -- -- -- Powell and others,
1968 1973
Flowing July 1967–May 11 Aug. 14, 1967 1.74 50 (for 10–12 Powell and others,
1968 hours) 1973
4.8–7.5 Sept. 1966–May -- -- 0.38 25–30 (for 10–12 Powell and others,
1968 hours) 1973
5.87–30.0 Aug. 2009– -- -- 0.13–0.16 50–55 (for 8 SD DENR, 2020;
June 2020 (for 3 hours); 35, or Larry Martin, NPS,
hours) less, gal/min written commun.,
sustained 2009
22.0 June 2010 -- -- -- -- SD DENR, 2020
-- -- -- -- -- -- Powell and others,
1973
-- -- 5 1967 -- -- Powell and others,
1973
-- -- 1 1967 -- -- Powell and others,
1973
-- -- 20; 13.5 1967; 1995 -- -- Powell and others,
1973; USGS, 2021
-- -- 1 1967 -- -- Powell and others,
1973
-- -- 7 1967 -- -- Powell and others,
1973
-- -- 4 1967 -- -- Powell and others,
1973
investigation of the memorial that included assessments of (Graham, 2008). From 2011 to 2015, Hoogestraat and Rowe
existing water supplies and suggestions for future water sup- (2016) investigated perchlorate and selected metals in wells,
plies. Geologic maps of the Black Hills that included Mount springs, surface waters, and soils at the memorial.
Rushmore were completed by DeWitt and others (1989),
Driscoll and others (2002), and Redden and DeWitt (2008).
Redden and others (2016) published a geologic map and cross Study Area Description
sections specific to the Mount Rushmore area. The USGS
The study area included the Burnpit well (well 5) in the
completed hydrologic studies of the Black Hills from 1990
memorial in the east-central part of the Black Hills in South
through 2002 and summarized findings in Carter and others
Dakota (fig. 1). Land surface elevation in the memorial bound-
(2002) and Driscoll and others (2002). The NPS completed a
ary ranges from 4,420 to 5,725 ft above the North American
geologic resource evaluation report of the memorial in 2008
Vertical Datum of 1988 at the summit of Mount Rushmore.Table 2. South Dakota water rights permits maintained by the National Park Service at Mount Rushmore National Memorial as of January 2021, listed by priority date (South
6 Borehole Analysis, Single-Well Aquifer Testing, and Water Quality for the Burnpit Well, Mount Rushmore National Memorial
Dakota Department of Environment and Natural Resources, 2021).
[ft3/s, cubic foot per second; Mt., Mount; ft, foot; gal/min, gallon per minute]
Permit number
(South Dakota
Permitted
Department of Applicable site Water right
Permit status discharge Date permit approved Permit notes
Environment and (table 1) priority date
(ft3/s)
Natural Resources,
2021)
US596–2 Spring 3 (Mt. Licensed 0.03 July 19, 1949 June 11, 1949 Water uses described in the permit application
Rushmore Spring) include domestic, recreational, and fire protec-
tion. Permit application mentions a water project
completed in October 1938 to divert water from a
spring to a 36,500-gallon storage reservoir.
528–2 Spring 6 (Grizzly Licensed 0.0088 June 17, 1959 March 28, 1959 Water uses in the permit application include fire
Bear Spring) protection, public recreation, and a restaurant.
The permit describes water system construction
completed on May 15, 1959, that included a con-
crete collector basin and three infiltration laterals
installed 18 inches below land surface with an
80-ft length. The water system was planned for
use by a campground.
US560–2A Well 1 (groundwater) Licensed 0.066 September 27, 1961 May 11, 1961 Water uses in the permit include resort and conces-
sion operations, domestic, fire protection, and
landscaping. The well was completed on July 27,
1960, with depth of 61 ft and a 6-inch casing. The
well pump was installed on August 10, 1961, with
an expected yield of 30 gal/min. The well is 150 ft
from the east boundary.
2588–2 Well 3 (groundwater) Incorporated 0.07 September 5, 2006 May 11, 2006 The permit amends permit US596–2 by changing the
with permit diversion location from spring 3 to well 3 and by
2736–2 appropriating an additional 31 gal/min. Water uses
include recreation and commercial. The well was
drilled in July 1967 to a depth of 200 ft and began
service in October 1967. The permit describes a
500,000-gallon storage tank added to the distribu-
tion system in 1957. Surface water use as a water
source was discontinued in October 1967. Permit
documentation concluded that well 3 and spring
waters were the same waters supplied by the same
aquifer contained in Proterozoic-age crystalline
rocks.
2736–2 Well 6 (groundwater) Licensed 0.022 March 16, 2015 January 2, 2015 The permitted source of water was from well 6 with
a depth of 500 ft, and the permit amends permit
2588–2 with an additional appropriation of 10
gal/min, which was the difference between the
authorized 45 gal/min and the pump capacity of
55 gal/min.Introduction 7
South Dakota State Highway 244 provides access to the and pegmatite at various depths (South Dakota Department of
memorial and extends from the easternmost border to the Environment and Natural Resources, 2020). Unconsolidated
northwest corner of the memorial boundary. The NPS oversees alluvial deposits derived from streams and drainages weather-
administrative buildings, visitor areas, a large parking facility, ing the consolidated rock overlie the igneous and metamorphic
hiking paths, and the sculpture on the southeast side of Mount rocks. The origin of the rocks, description of the topography,
Rushmore. and discussion of geologic structures at Mount Rushmore are
described in Powell and others (1973). Summary descriptions
of the geologic material composing the local groundwater
Climate aquifers are provided in this section from youngest to oldest.
Climate in the Black Hills area is continental with gener- Quaternary alluvium deposits are in the northeastern part
ally low precipitation, hot summers, cold winters, and extreme of the memorial along ephemeral stream drainages (fig. 3).
variations in precipitation and temperature (Driscoll and oth- The deposits consist of unconsolidated to poorly consolidated
ers, 2002). Mean annual precipitation at the memorial reported rock with clasts of as much as boulder-sized Proterozoic-aged
by the National Oceanic and Atmospheric Administration from rock (Redden and others, 2016) that are mostly schist frag-
1981 to 2010 was about 21.5 inches (in.; National Oceanic and ments with lesser amounts of granite and pegmatite (Powell
Atmospheric Administration climate station USC00395870, and others, 1973). Wells 1 and 2 were completed in alluvium
Mount Rushmore National Memorial, South Dakota, United with depths of about 62 and 58 ft below land surface, respec-
States; National Oceanic and Atmospheric Administration, tively (table 1; South Dakota Department of Environment
2020; fig. 1). Annual precipitation from 1981 to 2020 at Mount and Natural Resources, 2020). The lithologic log for well 1
Rushmore ranged from about 11.2 in. (in 1985) to about reported that soft bedrock may have been detected at 37 ft
39.0 in. (in 2019; fig. 2). Precipitation was generally less than below land surface and noted that the alluvial material was
normal in the 1980s and early 1990s, greater than normal in from weathered quartz-muscovite schist (South Dakota
the late 1990s, less than normal in the early 2000s, and normal Department of Environment and Natural Resources, 2020).
or greater than normal in the late 2000s and 2010s (fig. 2). The Granitic rocks at the memorial are early Proterozoic-
cumulative difference from annual normal increased nearly aged (about 1.715 billion years ago) Harney Peak Granite
40 in. from 1994 to 1999 and more than 40 in. from 2009 to (Redden and others, 2016). The Harney Peak Granite is fine
2019 (fig. 2). grained to pegmatitic. Sills, dikes, and large bodies of granite
Cumulative differences in annual normal precipitation are throughout the rock in the memorial (fig. 3). The domi-
may correlate to groundwater-level trends measured in wells nant minerals in the Harney Peak Granite include perthitic
completed in unconfined or semiconfined aquifers. The posi- microcline, oligoclase, quartz, and muscovite and accessory
tive correlation between precipitation and groundwater levels minerals include tourmaline, biotite, and garnet (Redden and
occurs because precipitation can be the primary recharge others, 2016). The sculpture at the memorial and most surficial
source for unconfined aquifers (Anderson and others, 2019). features in the west consist of Harney Peak Granite (fig. 3;
Therefore, wells completed in unconfined aquifers near Mount Powell and others, 1973).
Rushmore would be expected to have lower water levels in the Several types of Proterozoic-aged metamorphic rock are
early 1990s and mid- to late 2000s and relatively higher water exposed at the memorial including metagraywackes, metaba-
levels in the late 1990s and 2009 through 2020. Additionally, salts, schists, carbonate facies, and biotite schists (fig. 3).
the same pattern would be expected for seasonal changes, Metagraywacke units 1 and 2 are exposed at the land surface
with water levels lower during the drier months of the year and consist of quartz-mica schists and phyllites that are tan
and higher during the wetter months of the year; however, and greenish gray to gray (unit 2) or tan and gray to black
continuous water-level and spring-flow data were not avail- (unit 1; Redden and others, 2016). Metagraywacke unit 2 is in
able to demonstrate the correlation for Mount Rushmore wells the east and metagraywacke unit 1 is in the central and western
and springs. parts of the memorial (fig. 3). Metabasalt units are present as
thin outcrops in the center of the memorial and are composed
of pale-green to dark-gray or green amphibolites that are finely
Geologic Setting crystalline (fig. 3). Schist, quartzite, and metaconglomerate
with large quartzite clasts of as much as 3 ft also are detected
The geologic setting at the memorial includes rocks from in the center of the memorial (fig. 3). A thin unit of carbon-
igneous and metamorphic events (Powell and others, 1973). ate facies iron formation with iron-stained metachert and
The western part of the memorial, including the sculpture, is carbonaceous phyllite is present at a narrow outcrop near the
composed mostly of granite (fig. 3). The eastern part of the center of the memorial as an interflow deposit about 0.2 mile
memorial is composed mostly of granite and schists (fig. 3). (mi) east of well 3 and 0.1 mi east of the Burnpit well. A unit
Quartz veins, dikes, and sills consisting of pegmatites are of Proterozoic-aged biotite-garnet schist and biotite schist is
abundant in the eastern part of the memorial (Powell and exposed in the southwestern part of the memorial (fig. 3) and
others, 1973). Lithologic logs from wells and a borehole is composed of graphitic schist and phyllite with garnet- and
completed near Mount Rushmore record bodies of granite biotite-rich layers and massive quartzose beds (Redden and8 Borehole Analysis, Single-Well Aquifer Testing, and Water Quality for the Burnpit Well, Mount Rushmore National Memorial
50
40
30
20
10
Precipitation, in inches
0
−10
−20 EXPLANATION
[Data from summed daily values at National Oceanic and Atmospheric
Administration climate station USC00395870 (Mount Rushmore National
Memorial, S. Dak., United States) with missing data substituted from
−30 climate station USC00393868 (Hill City, S. Dak., United States) located
about 7 miles northwest (National Oceanic and Atmospheric
Administration, 2020)]
Annual precipitation
−40 Difference from annual normal (1981–2010)
Cumulative difference from annual normal
−50
81
82
83
84
85
86
87
88
89
90
91
92
93
94
95
96
97
98
99
00
01
02
03
04
05
06
07
08
09
10
11
12
13
14
15
16
17
18
19
20
19
19
19
19
19
19
19
19
19
19
19
19
19
19
19
19
19
19
19
20
20
20
20
20
20
20
20
20
20
20
20
20
20
20
20
20
20
20
20
20
Year
Figure 2. Annual precipitation and cumulative difference from annual normal, in inches, at Mount Rushmore National Memorial from 1981 through 2020 observed at
National Oceanic and Atmospheric Administration climate station USC00395870 (Mount Rushmore National Memorial, South Dakota. United States) with missing data
substituted with daily data from climate station USC00393868 (Hill City, South Dakota, United States; National Oceanic and Atmospheric Administration, 2020).Introduction 9
103°28' R. 5E. R. 6E. 103°27' 103°26'
Well 4 A'
Xh Qal
12 7 8
Well 1
Xgw1
Borehole
44
Xh
Xgw2
Well 6 Well 3 Xby
43°53'
3 (Rushmore Spring) 4 Xif
5 (Red Spring)
4
Xgw1
Xgw2
1 Xh Xh
4
T. MOUNT RUSHMORE
2
S. A
Well 5
(Burnpit well)
Xbs Xcq
18 17
13
6
4
Xby
(Grizzly Bear Spring)
2 Xh
4
Xgw1
Well 2
24 19 20
43°52'
Base modified from U.S. Geological Survey (2020) 0 0.25 0.5 MILE Geologic map and cross section modified
Universal Transverse Mercator projection, zone 13 from Powell and others (1973)
0 0.25 0.5 KILOMETER and Redden and others (2016)
FEET
Elevation, in feet above mean sea level
6,000
A A' 6,000
MOUNT RUSHMORE
5,500 Xh 5,500
Well 3
Xif
5,000 Xby 5,000
Well 4
Xbs1 Xgw1
Xcq
4,500 Xgw2 Qal 4,500
Xh Xh
Xh Xif
4,000 4,000
0 5,500 11,000
DATUM IS NORTH AMERICAN VERTICAL DATUM OF 1988
EXPLANATION
Mount Rushmore National Geologic unit (modified from Redden and others, 2016)
Memorial boundary
Well 1 Qal Alluvium—Unconsolidated to poorly consolidated; Xcq Schist, quartzite, and metaconglomerate—Clasts
Well with label clasts to boulder size of Proterozoic lithologies as much as 3 feet across of quartzite; gray, dark gray, tan
4
1 Spring with label, tail indicates
Xh Harney Peak Granite—Fine grained to pegmatic; Xif Carbonate facies iron formation—Iron-stained
direction of discharge
typically layered; occurs as sills and dikes to large metachert, and cabonaceous pyllite as interflow deposits
Borehole
bodies; some are zoned; age 1.715 billion years
A A' Xgw1 Metagraywacke unit 1—Quartz-mica schist, mica schist,
Cross section line Xgw2 Metagraywacke unit 2—Quartz-mica schist and and phyllite; tan, gray, to black; variously bedded
Quartz vein pyllite; tan, greenish gray, to gray; variously bedded
Xbs Biotite-garnet schist and biotite schist—Graphitic
8 Public Land Survey System Xby Metabasalt—Pale-green to dark-gray or green
schist and phyllite with garnet- and biotite-rich
section number amphibolite; typically finely crystalline
layers and massive quartzose beds
Figure 3. Geology of Mount Rushmore National Memorial (modified from Powell and others, 1973; Redden and others, 2016).10 Borehole Analysis, Single-Well Aquifer Testing, and Water Quality for the Burnpit Well, Mount Rushmore National Memorial
others, 2016). Quartz veins, some with surface exposures Local precipitation provides the primary recharge to
exceeding 0.5 mi in length, are in metagraywacke units 1 aquifers in the memorial (Powell and others, 1973). Fractures
and 2, as well as in the schist, quartzite, and metaconglomer- and joints in the Proterozoic granite and pegmatite rock of
ate metamorphic units (fig. 3). Quartz veins also are reported the crystalline aquifers rapidly transmit large quantities of
in well logs several hundred feet below land surface (South recharged water to the wells and springs in the north-central
Dakota Department of Environment and Natural Resources, part of the memorial, including well 3, well 6, and Rushmore
2020). The thickness of the quartz veins reported in well logs Spring (Powell and others, 1973; fig. 1). Recharge to the
at the Burnpit well ranges from 18 to 40 ft (South Dakota crystalline aquifers also may result from high infiltration
Department of Environment and Natural Resources, 2020). rates from permeable surficial deposits (Rahn, 1990). Powell
and others (1973) estimated that a mean annual precipitation
of 19 in. provides enough recharge to maintain springflow,
Hydrogeology streamflow, and well production for the memorial; however,
The hydrogeology of the memorial includes localized mean annual precipitation of less than 15 in. could reduce
and noncontinuous aquifers composed of unconsolidated spring discharge, cause streamflow to cease, and lower well
Quaternary alluvial deposits and consolidated Proterozoic productivity. Total annual precipitation of less than 15 in. was
igneous and metamorphic bedrock (Powell and others, 1973; recorded only three times (1985, 1988, and 2012) from 1981
Hoogestraat and Rowe, 2016). Groundwater in the alluvial to 2020 (fig. 2). The actual effect of low precipitation in those
aquifers is affected by the hydrologically connected stream years is unknown because continuous water-level and spring-
waters in the drainages of the memorial. The volume of flow data are not available for those years.
groundwater in the alluvial aquifers depends on the discharge Groundwater-level data for aquifers in the memorial are
and stage of the streams overlying the aquifers. Powell and sparse. Powell and others (1973) reported water levels from
others (1973) provided detailed descriptions of the alluvial the mid-1960s through May 1968 at wells 1–4 (table 1). Water
aquifers and evaluated their potential as future water supplies. levels at wells 1, 2, and 4 ranged from 2.1 to 9.5 ft below land
Aquifers in the Proterozoic igneous and metamorphic surface during that time, and well 3 was reported as flowing
rocks of the Black Hills generally are referred to as crystalline above the land surface from July 1967 through May 1968
aquifers. In the Black Hills, crystalline rocks are the old- (table 1). The flowing artesian conditions at well 3 indicate
est geologic units and regionally form a basement under the that the well could be completed in a semiconfined aquifer or
local Paleozoic, Mesozoic, and Cenozoic rocks and sediments that granite or pegmatite sills, acting to confine groundwater
(Williamson and Carter, 2002). Crystalline rock generally has flow, cause upwelling of water near well 3 (Powell and oth-
low permeability and forms the lower confining unit for the ers, 1973). The water level was measured at the Burnpit well
sedimentary aquifers in the Black Hills. Localized aquifers in after the completion of drilling on October 29, 2008, at 30.0 ft
exposed crystalline rock generally have a small spatial extent below land surface (South Dakota Department of Environment
and are common in the central core of the Black Hills, includ- and Natural Resources, 2020), and on August 24, 2009, the
ing the memorial, where enhanced secondary permeability in NPS reported a water level of about 30 ft below land surface.
the rock results from weathering and fracturing (Carter and On June 6 and 24, 2020, water levels recorded by the USGS
others, 2002). at the Burnpit well were 8.04 and 5.87 ft below land surface,
The volume and flow characteristics of groundwater in respectively, and on July 23, 2020, the USGS measured a
aquifers composed of Proterozoic igneous and metamorphic water level at 20.45 ft below land surface (U.S. Geological
bedrock are affected by fractures and intrusions in the rock. Survey, 2021).
The amount of groundwater available locally depends on the The pattern of generally increasing water levels at the
volume of fractured rock in the subsurface at the location Burnpit well from 2008 to 2020 correlates with the increase in
(Powell and others, 1973). In crystalline aquifers of the Black cumulative difference from annual normal precipitation from
Hills, water-table (unconfined) conditions generally prevail 2008 to 2020 (fig. 2). The cumulative difference from annual
where fractures in the rock are saturated and topography normal precipitation increased from −3.7 to 41.8 in. from 2008
affects groundwater-flow directions (Carter and others, 2002; through 2020, which corresponds to increased water levels
Driscoll and others, 2002). Fractures created by intrusion of at the Burnpit well from about 30.0 ft below land surface to
pegmatitic dikes and sills into mica schists and other metamor- 5.87 ft below land surface during the same time. The positive
phic rock allow groundwater to feed springs in the central part correlation between precipitation and groundwater levels at
of the memorial (springs 3, 5, and 6; fig. 1). The fractures also the Burnpit well indicates that the well is recharged primarily
are likely responsible for the more productive aquifers in the by precipitation.
central part of the memorial compared to the metagraywacke Groundwater-quality conditions of crystalline aquifers
and schist units in the eastern part of the memorial that do not in the Black Hills area of South Dakota were summarized by
provide ideal conditions for productive aquifers (Powell and Williamson and Carter (2002), Putnam and others (2008),
others, 1973). and South Dakota Mines (2021). Water-quality conditions of
crystalline aquifers, referred to as Precambrian aquifers in
Williamson and Carter (2002) within and near the memorial,Methods for Data Collection and Analysis 11
are affected by the bedrock mineralogy, climatic variability The purpose of the borehole camera video analysis was to
(wet and dry cycles), and human sources of contaminants. observe rock fractures that could facilitate groundwater flow
In general, groundwater from the nearby limestone aquifers to the well and to determine the optimal analytical method for
in the Black Hills has greater hardness, alkalinity, and total aquifer-testing analysis. Rock fractures were visible because
dissolved solids than the crystalline aquifers in the core of the the well is cased only at the top 40 ft, and the remaining 540-ft
Black Hills because the dissolution of limestone and dolo- well depth is an open hole without any casing. Video of the
mite occurs more rapidly than dissolution of minerals in the well casing and borehole of the Burnpit well was recorded by
crystalline bedrock. Crystalline aquifers generally have higher NPS personnel using an Allegheny Instruments Heavy Duty
concentrations of trace elements (such as iron, manganese, GeoVision Nano Camera system (Allegheny Instruments,
and arsenic) than the limestone aquifers in the Black Hills and 2021). The camera was downward looking, which limited the
generally have a small, localized spatial extent (Williamson view of the borehole sidewalls containing fractures; however,
and Carter, 2002). fractures were observed despite the limited sidewall view. The
camera system was suspended on a 650-ft cable and lowered
into the well on June 23 and July 29, 2020. The depth below
Methods for Data Collection and land surface recorded by the camera system could be inaccu-
rate by as much as 2 ft because the depth counter on the cam-
Analysis era system was started between the top of the casing and the
land surface, which was a distance of about 2 ft. The borehole
Methods for data collection and analysis to determine video data recorded on June 23 included well depths below
the geological and hydraulic properties of the aquifer supply- land surface from about 0 to 98 ft and from 220 to 250 ft and
ing the Burnpit well, and the water quality of the groundwater at a stationary depth of 256 ft. The video was not continu-
from the well, included borehole and video camera analysis ous because of operational errors, and additional video was
in 2020, aquifer testing by the NPS in 2009 and the USGS in recorded on July 29. Borehole video data recorded on July 29
2020, and water-quality sampling in 2020. Borehole analy- were collected continuously from 0 to about 533 ft below land
sis used data from well logs and borehole camera video to surface. The full depth of the well was not recorded because
document rock fractures that could facilitate groundwater high sediment concentrations starting at about 520 ft below
flow to the well and to determine the analytical method for land surface decreased the video quality and the well borehole
aquifer-testing analysis. Single-well aquifer tests by the NPS was not clearly visible.
in 2009 and the USGS in 2020 for the Burnpit well estimated
hydraulic properties of the aquifer by comparing water-level
data from the aquifer test to theoretical curves from analytical
Single-Well Aquifer Testing
solutions for idealized aquifers. Aquifer tests also provided Single-well aquifer tests were completed at the Burnpit
data on the maximum sustainable pumping rate of the well. well on August 25, 2009, by the NPS and on June 24, 2020,
Data associated with the borehole video and aquifer testing are by the USGS. A single-well aquifer test estimates hydraulic
provided in a USGS data release (Eldridge and Hoogestraat, properties of an aquifer by comparing the water-level change
2021). Water-quality data from the Burnpit well were analyzed curve, caused by pumping from a single well, to theoreti-
by recording groundwater field properties, collecting water cal curves from analytical solutions of idealized aquifers
samples for laboratory chemical analysis, and comparing the (Stallman, 1978; Schaap, 2000). Both tests were similar in
results to drinking-water standards and mean concentrations design; both manually recorded water-level measurements at
for crystalline aquifers in the Black Hills. Water-quality results various time intervals before, during, and after pumping using
are recorded in the USGS National Water Information System electric water-level measurement tapes (electric tape). Single-
database (U.S. Geological Survey, 2021) and can be accessed well testing was necessary because observation wells do
using the USGS site identification number for the Burnpit well not exist in the study area. Manual measurements were used
(435240103265301; table 1). because the in-well pumping equipment did not allow enough
space to suspend a transducer. A monitor tube was installed
Borehole Analysis temporarily in 2020; however, the transducer data were unus-
able because the transducer became stuck at a tubing joint at a
Borehole analysis at the Burnpit well was completed by depth of about 180 ft below land surface and blocked the flow
examining well logs and downward-looking borehole camera of water in the tube.
video. The well log for the Burnpit well recorded well con- During well construction in 2008, the drilling contractor
struction information and geologic lithology (South Dakota noted that the bottom 100 ft of the well were drilled through
Department of Environment and Natural Resources, 2020). hard gray schist that did not produce any appreciable amount
Data from the well log lithology were manually correlated to of water, and water-bearing fractures did not exist deeper than
images from the borehole camera video. 485 ft below land surface. The contractor installed the pump, a
Grundfos 40S100–30 with a 10-horsepower motor, at a depth12 Borehole Analysis, Single-Well Aquifer Testing, and Water Quality for the Burnpit Well, Mount Rushmore National Memorial
of 504 ft below land surface. After installation, the contractor The USGS single-well aquifer test in 2020 used a
tested the pump and reported a pumping rate of 150 gal/min pumping rate of about 27 gal/min, which was the maximum
reduced the water level in the well to the depth of the pump; capability of the pump and generator. The discharge rate
however, the contractor completed another test using a pump- from pumping was measured by recording the time with a
ing rate of about 55 gal/min that resulted in a stable water stopwatch to fill a 5-gal bucket. Discharge was measured five
level at about 460 ft below land surface for 8 hours. times during the pumping part of the test (table 3). Water-level
The single-well aquifer test at the Burnpit well on measurements were recorded at intervals ranging from 1 to
August 25, 2009, was completed by the NPS about 1 year after 13 minutes with the pump on and 15 seconds to 20 minutes
the well was drilled on October 29, 2008. The purpose of the with the pump off. More frequent measurements were made
test was to determine the maximum pumping rate that the well when the water-level changes were rapid, and less frequent
could sustain to provide a steady source of groundwater. The measurements were made during slower water-level changes.
test also facilitated water-quality sampling of the groundwater The well was pumped for 186 minutes (3.1 hours), which was
in the well by purging the well for several hours before sample the time required to purge the well for water-quality sampling.
collection. During the 2009 NPS aquifer test, water-level The pump was turned off and water-level measurements were
drawdown was measured manually by volumetric timing using recorded for 195 minutes as the water level recovered. The
a watch and a bucket of known volume by NPS personnel with test included 82 observations of time and water-level displace-
the pump on, and water-level recovery was measured with the ment, measured in feet (table 3).
pump turned off. Water levels deeper than about 250 ft could AQTESOLV Pro version 4.50.002 (Hydrosolve, Inc.,
not be measured during the 2009 NPS test because pumping 2007) software was used to analyze data collected from the
equipment in the well prevented the electric tape from reach- NPS and USGS single-well aquifer tests. The AQTESOLV
ing the water level. software uses curve fitting of time and water-level data to esti-
The NPS single-well aquifer test in 2009 used a pumping mate transmissivity and storage properties. The curve-fitting
rate of about 20 gal/min. The well was pumped for 194 min- algorithm creates a best-fit curve by varying the estimated
utes (3.2 hours) before pumping was discontinued. Water transmissivity and other hydraulic parameters until a theoreti-
levels were measured with an electric tape at intervals ranging cal curve best fits the measured time and water-level observa-
from 3 to 10 minutes with the pump on and 1 to 10 minutes tions (Hydrosolve, Inc., 2007). Although AQTESOLV has an
with the pump off. Water-level measurements were recorded automatic curve-fitting feature, manual curve fitting was used
until the water level declined to about 150 ft below the for optimizing fit.
land surface. Water-level recovery was measured for about The Theis (Theis, 1935) and Cooper-Jacob (Cooper and
148 minutes (2.5 hours) until water levels were within 40 ft of Jacob, 1946) curve-matching techniques were used to deter-
the initial water level. Data recorded during the test included mine aquifer transmissivity and storativity. The Theis method
71 observations of time and water-level displacement, mea- uses theoretical drawdown curves based on assumptions about
sured in feet (table 3). the aquifer including an infinite areal extent, homogeneous
The USGS completed a single-well aquifer test at the and isotropic geologic material with uniform aquifer thick-
Burnpit well (well 5; fig. 4) on June 24, 2020, in conjunc- ness, unconfined groundwater conditions, unsteady ground-
tion with the collection of water-quality samples. After about water flow, fully or partially penetrating pumping well, and
10 years of nonuse, the original pump failed and was replaced the displacement of water levels is small relative to saturated
with a temporary pump. The drilling contractor temporarily thickness (Hydrosolve, Inc., 2007). The Theis method was
installed a Grundfos 16S30–24 pump at about 500 ft below modified for use with data from an unconfined aquifer by
land surface. Additionally, a 1-in.-diameter black polyvinyl correcting the drawdown data to account for aquifer saturated
monitor tube was taped to the downpipe to facilitate water- thickness (Kruseman and de Ridder, 1994; Hydrosolve, Inc.,
level measurements during the test. Water levels were mea- 2007). An advantage of the Theis method is that it considers
sured manually by USGS personnel using a 1,000-ft cali- drawdown and recovery water-level data when estimating
brated electric tape with a measuring point of 2.70 ft above aquifer hydrogeologic properties.
land surface established at the top of the monitor tube. Water The Cooper-Jacob method (Cooper and Jacob, 1946) for
discharged during pumping was routed through a 5-ft-long an unconfined aquifer also was used to analyze the drawdown
steel pipe attached to the well outlet and then downhill to water-level data from the aquifer tests. Like the Theis method
a natural drainage. Infiltration of pumped water discharged modification for unconfined aquifers, the Cooper-Jacob
at the surface was assumed to be minimal and to not affect method adjusts water-level displacement data recorded during
the test; however, pooled water about 10 ft south of the well an aquifer test of an unconfined aquifer by considering the sat-
infiltrated the land surface about 5 minutes after the pump was urated thickness of the aquifer (Hydrosolve, Inc., 2007). The
turned off. Weather was consistent during the test and did not Cooper-Jacob method often is used for fractured rock aquifers
affect test results. The weather was hot (as much as 80 degrees to determine if wellbore water storage and geologic fractures
Fahrenheit) with light wind and no clouds, and the barometric change the slope of the time-drawdown water-level curves
pressure ranged from 634 to 635 millimeters of mercury dur- (Hydrosolve, Inc., 2007). Straight-line curve matching to the
ing the test. water-level drawdown data was used for the Cooper-JacobYou can also read