Boston "Emerald Necklace" Case Study - Ramboll
←
→
Page content transcription
If your browser does not render page correctly, please read the page content below
Report MIT Wescoat

Boston “Emerald Necklace” Case Study

Product of research on “Enhancing Blue-Green Environmental and Social Performance
in High Density Urban Environments”
Sponsored by the Ramboll Foundation

20 July 2015

Authors:
Alex Marks, James L. Wescoat Jr., Karen Noiva, and Smita Rawoot
Massachusetts Institute of Technology

                                                                               Page 1
Report MIT Wescoat

CONTENTS

1.
   PREFACE
  ........................................................................................................................................................
  3

2.
   DEFINING BLUE-GREEN INFRASTRUCTURE (BGI) IN BOSTON
  ............................................
  5

3.
   SITUATING BOSTON’S BLUE GREEN INFRASTRUCTURE IN A LOCAL, REGIONAL &
COMPARATIVE INTERNATIONAL CONTEXT
  ...........................................................................................
  9

4.
   CHALLENGES THAT CITIES LIKE BOSTON FACE TODAY
  ....................................................
  24

5.
   RESEARCH FINDINGS ON HOW BOSTON HAS ADDRESSED SUCH CHALLENGES
USING BGI: THE EXPANDED PROCESS MODEL APPROACH
  ......................................................
  31

6.
   RESEARCH FINDINGS ON THE VALUES ADDED BY BGI IN BOSTON
  ..............................
  37

7.
   RESEARCH FINDINGS ON INSTITUTIONAL DYNAMICS
  ..........................................................
  48

8.
   RESEARCH FINDINGS RELEVANT FOR IMPLEMENTING FUTURE BGI PROJECTS
  ...
  56

9.
   REFERENCES
  ............................................................................................................................................
  58

10.
   ANNEXES
  ..................................................................................................................................................
  63


                                                                                                                                                                       Page 2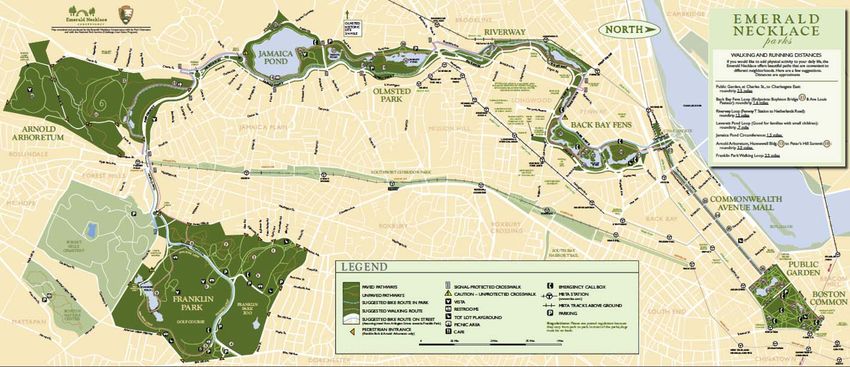
Report MIT Wescoat

1. PREFACE

This report summarizes the research, findings, and recommendations of the Blue-Green Infrastructure
(BGI) case study in Boston, Massachusetts, USA. It is one of seven case studies in the comparative
research project funded by the Ramboll Foundation. Blue-green infrastructure extends the well-established
concept of green infrastructure (e.g., open space and tree canopy) to encompass hydrologic systems and
processes that make enormous contributions to the aesthetic, functional, and cultural values of urban
landscapes.

Boston was selected as a case study based on its renowned “Emerald Necklace” park system, which is a
continuously evolving example of blue-green infrastructure over the past 130+ years (Figure 1). Designed
by landscape architect Frederick Law Olmsted toward the end of his career in the 1880s, the Emerald
Necklace became a breakthrough project in urban environmental design (Poole, 2002; Zaitzevsky, 1982).
It stands as an early model for addressing functional issues of urban stormwater management on tidal
rivers, and it has been emulated in other cities in the U.S. and internationally.

The Emerald Necklace consists of seven major blue-green components that link sanitary and stormwater
sewerage improvements with river corridor parks, urban ponds, an arboretum and subwatershed, and
Boston’s largest public park. It is well-defined spatially and well-documented in public archives. This early
design precedent underwent major changes in its underlying assumptions as early as the 1910s when its
tidal outlet was dammed, and it became a freshwater reservoir. Other parts of the Emerald Necklace have
been redesigned on multiple occasions over the past century, e.g., to cope with the introduction of the
automobile, and with an ecological restoration design project for the Muddy River that is currently
underway. It is precisely these adaptations and continuities that enable long-term evaluation of its BGI
performance in social and environmental terms, and that offer guidance for other urban BGI initiatives.

At the same time, the Emerald Necklace has missing links, in particular with the Charles River Esplanade
and the large Boston harbor waterfront, which have not yet been well-connected in a unified system. While
the overall Boston park system remains intact, its maintenance and performance have varied over the
decades, as will be shown. These positive and negative lessons are important for current and future BGI
planning and implementation in Boston, the other Ramboll case study cities, and beyond.

                                                                                                       Page 3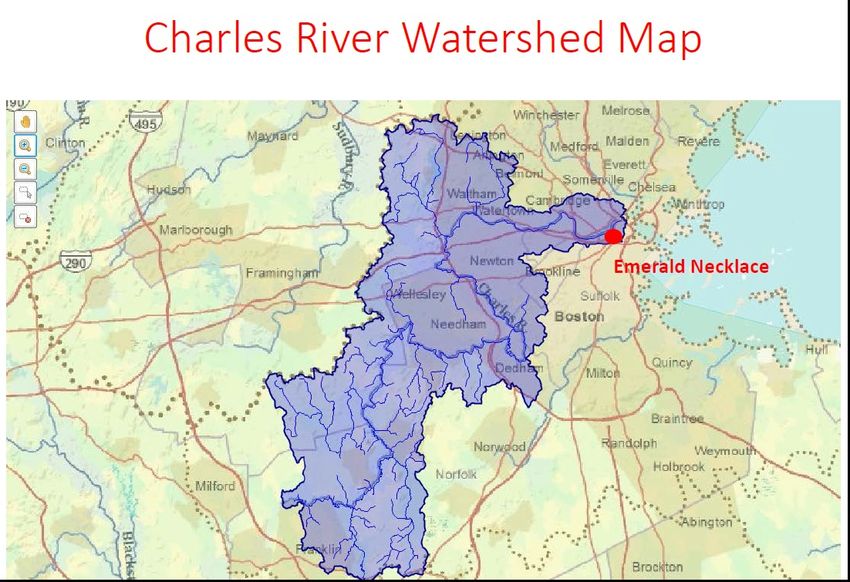
Report MIT Wescoat

Figure 1. Late plan of the Boston Park System by Olmsted in 1894, which shows his approach to the park as a system
with a contiguous network of amenity spaces from Franklin Park down to the Charles River

This case study report begins with on a brief section on the definition blue-green infrastructure, which is
common to all of the Ramboll case studies. The third section situates the Boston case study by developing
a typology of the key components and contexts of the Emerald Necklace and by comparing Boston with a
large database of other cities, including the other Ramboll case studies. The fourth section offers a
perspective on planning challenges that Boston faces today, to set the stage for asking how blue-green
infrastructure has addressed such challenges in the past, and how it might do so creatively in the future.
The fifth section gives a new interpretation of the Emerald Necklace case study using the Expanded
Process Model, which begins by identifying the initial problem, and then proceeds to the driving forces for
address them with a BGI solution, the enabling and constraining conditions, alternatives considered,
options implemented, their outcomes, and subsequent adjustments as new problems emerge and are
addressed (see Dewey, 1938 for the philosophical basis of the Expanded Process Model; cf. Wescoat,
1992).

This historical geographic approach provides the basis for three sets of findings in sections 6 through 8.
Section 6 reviews the major types of value that have been added by the Emerald Necklace example of
blue-green infrastructure. These comprise its natural capital, built capital, human capital, social capital,
symbolic capital, and financial capital. Section 7 summarizes the findings on Institutional structures and
dynamics that have enabled and constrained development of the Emerald Necklace. Section 8
summarizes the lessons from this case study on Implementation of BGI projects, again both in Boston and
beyond.

                                                                                                           Page 4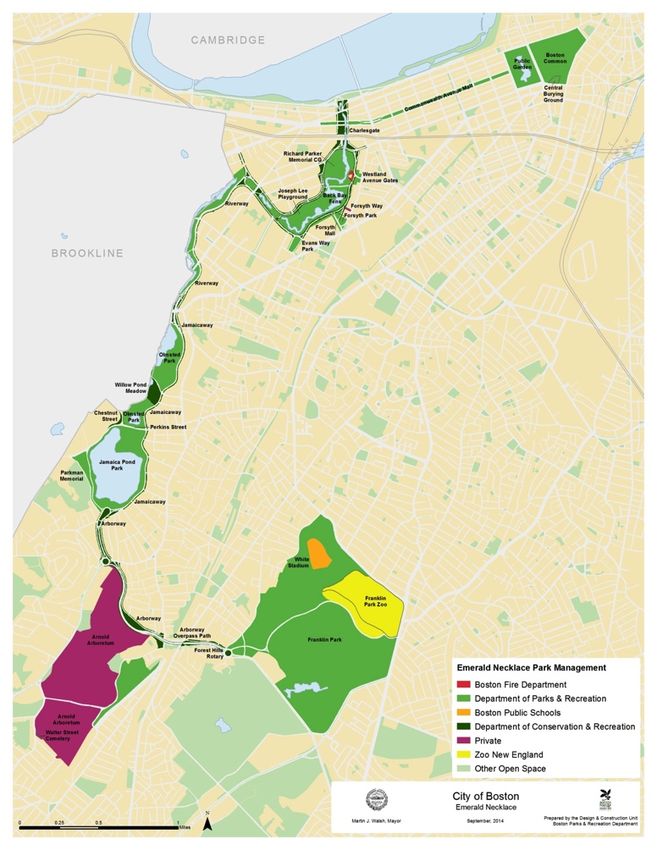
Report MIT Wescoat

While we treat the Emerald Necklace as an historical case study in this report, it is even more significant as
an important platform for assessing future BGI development opportunities in cities like Boston. The city is
growing in population and thriving economically, though it faces challenges of aging transportation
infrastructure, urban drainage and water quality issues, coastal sea level hazards, and long-term social
concerns in housing, schools, and services. In these respects it bears comparison, in particular, with
Copenhagen, Mumbai, and Singapore. Although open space has long been important in the city, we will
show that public funding for it has declined in real terms in recent decades, and the city very much needs to
understand the current and future value of blue-green infrastructure. Thus Boston will need to continue to
                                                                              th
draw motivation from other cities, as it did from Hamburg in the late-19 century, and as it does today from
cities like Portland, New York City, and others.

2. DEFINING BLUE-GREEN INFRASTRUCTURE (BGI) IN BOSTON

This section introduces the concept of blue-green infrastructure (BGI), with some initial comments on its
                                                                                                      1
relevance for Boston. This definition of BGI is shared across all of the Ramboll case studies. A more
Boston-specific case study introduction is presented later in the report.

The concept of “green infrastructure” and its benefits for ecology and social life are increasingly
well-established in urban environmental planning, policy, research, and design. However, much green
infrastructure is closely linked with and even defined by “blue” water processes. Some cities such as
Boston continue to describe these values and systems as “parks” and “open space.” Open space now
seems somewhat empty of meaning while infrastructure implies practical functions and performance.

An increasing number of cities are creating or restoring urban water bodies and systems to enhance urban
livability and quality of life. Blue-green infrastructure projects are proliferating in exciting ways. Research is
now needed to identify, analyze, and enhance the benefits and added values stemming from this
combination of blue-green infrastructure, especially its impact on improving social life and
human-environmental experience.

Boston is arguably one of the earliest examples of an explicitly BGI development, beginning in the 1880s
that was a system of water and landscape parks that came to be known as the Emerald Necklace. It is the
focus of this report.

What do we mean by Blue-Green Infrastructure (BGI)?

Blue-green infrastructure (BGI) is a dynamic system in urban contexts that connect vegetation with
waterbodies. BGI integrates hydrological and biological water treatment trains in systems where green

1
    It was drafted by Herbert Dreiseitl, Bettina Wanschura, Matthias Worlen, and James Wescoat.

                                                                                                             Page 5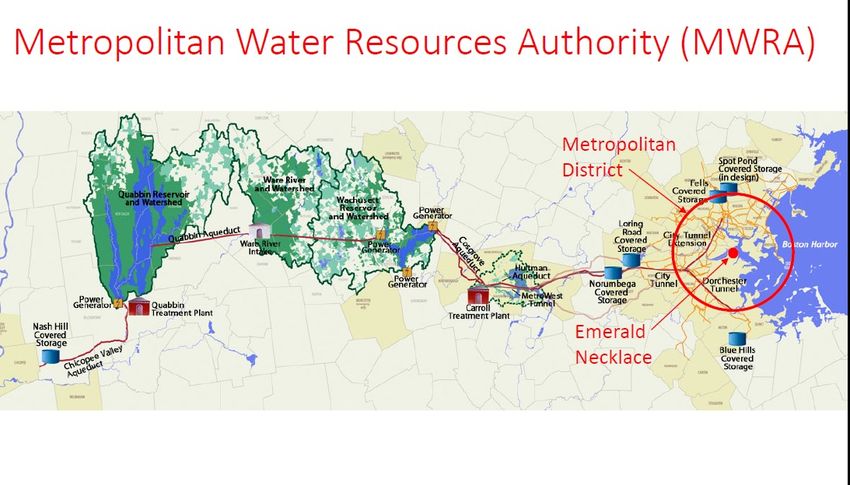
Report MIT Wescoat

features are integrated and seamlessly overlapping with blue features. Together they strengthen urban
ecosystems by evoking natural processes in man-made environments. The hypothesis is that such
systems have a positive impact on the experience and behavior of people using these infrastructures that
have societal benefits.

The term green infrastructure often refers to areas with plants including their rhizomes and natural
substrates like parks, green roofs, greenbelts, alleys, vertical gardens on buildings, etc. The Boston
Common was the earliest example of this concept, arising with the origin of the city itself to provide
common grazing land, then common gather space, in the 17th century. “But BGI often involves
non-vegetative, constructed surfaces and substrates, such as porous hardscapes, loose stone infiltration
basins, gravel wetlands and specialized soils for root growth in narrow spaces.”

Blue infrastructure is related to hydrological functions including urban stormwater systems as well as
surface and groundwater bodies. This water infrastructure may be natural, adapted or man-made and
provide the functions of retention, storm water treatment, reuse, groundwater infiltration, sewer treatment,
freshwater supply, etc. Coastal cities like Boston originate around the blue infrastructure of freshwater
supplies adjacent to tidal rivers and harbors for trade.

Blue-green infrastructure brings these two systems and values together in ways that are greater than the
sum of their individual benefits. The benefits of this more integrated approach can range from a stronger
sense of place to the health, happiness, and aesthetics of urban environmental experience. Interestingly,
Boston’s first official “park” was a sanitary waterway improvement – i.e., blue-green infrastructure -- known
as the Back Bay Fens, which is a key component of this case study.

In BGI research we especially look at cases where these benefits can be documented, and where
blue-green infrastructure can be actively used by people, thus being relevant for social life in areas for
recreation, improvement of walkability or bikeability, and beauty.

What are the objectives of BGI?

Blue-green infrastructure combines the demands of sustainable water and stormwater management with
the demands of urban planning and urban life, and thus it:

    •   Brings the urban water cycle closer to natural hydrologic processes to provide more efficient water
        treatment, use, supply, as well as mitigation of droughts and floods)

    •   Contributes to the visual and recreational amenity of the city’s ecological and built environment.

    •   Helps manage conflicts between urban settlements and negative impact on natural systems in
        innovative ways (e.g., by protecting ecosystems, caring for public open spaces, and adapting to for
        climate change,)

    •   Improves urban sustainability and livability.

                                                                                                         Page 6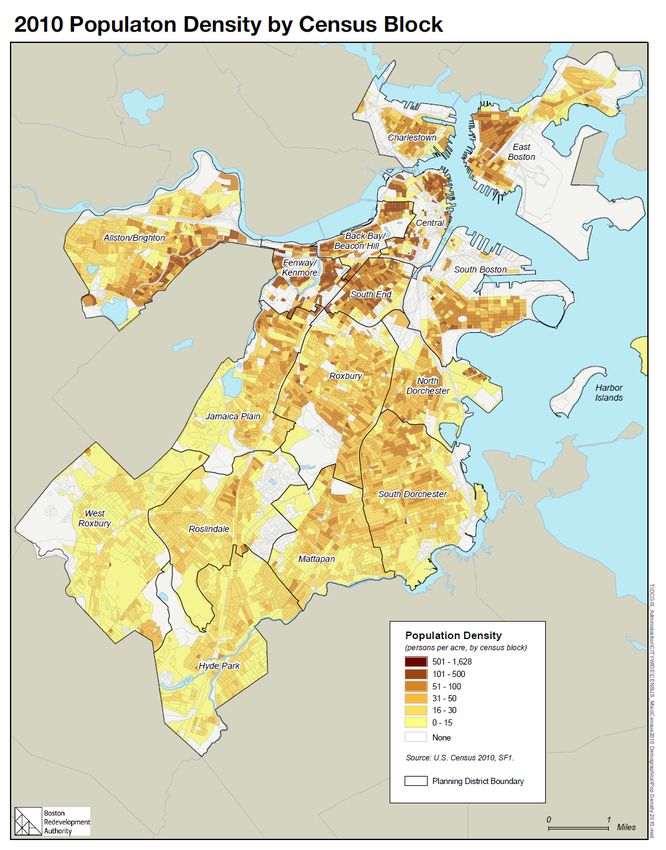
Report MIT Wescoat

                                                        This graphic illustrates the gradient from grey
                                                        infrastructure at the top to blue and green
                                                        infrastructure being adjacent but functionally
                                                        separated from each other (second) to overlapping
                                                        blue and green infrastructure in a riverbed with
                                                        green banks (third) to full integration of blue-green
                                                        stormwater management from on roof tops and
                                                        vertical gardens to naturalistic drainage systems
                                                        (bottom).

                                                        The most defining quality of BGI is this overlapping
                                                        of blue and green features and processes that
                                                        provide relevant functions and services. Its
                                                        services are (1) water related, (2) ecosystems
                                                        related, (3) have benefits on the social life and by
                                                        doing so are (4) financially relevant.

Blue-green infrastructure: gradient from separated to
integrated systems (Herbert Dreiseitl)

                                                                                                            Page 7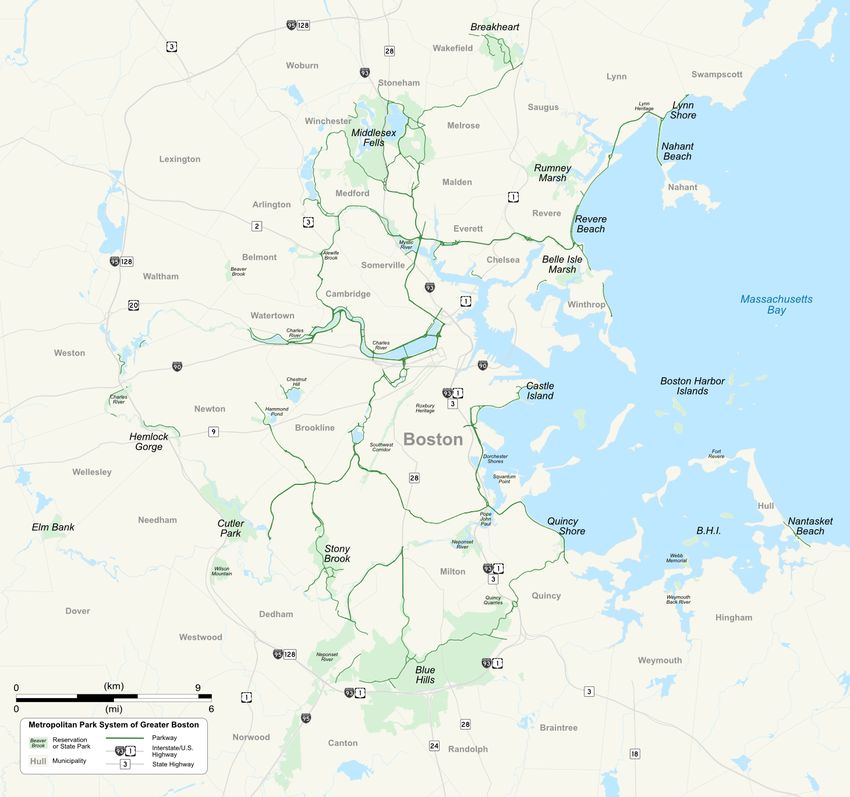
Report MIT Wescoat

This intersection of blue, green and social benefits can:

    •   Balance water flows (Reduce stormwater runoff and peak flows through local detention and
        retention measures in soil interstices, minimization impervious areas, etc.)

    •   Improve water quality (reduce organic pollution through mechanical filtration, biological cleaning,
        accumulation of oxygen in the soil, etc.)

    •   Enhance ecosystem services (micro climate improvement like balanced temperatures and
        evaporative cooling, buffer wet and dry conditions, increase of biodiversity, reduce fine dust and
        improve air quality, metabolism and photosynthesis, etc.)

    •   Broaden societal benefits (recreational spots for mental and physical health, attractive meeting
        places, promotion of creativity, aesthetical values, etc.)

    •   Increase financial benefits (reduce drainage infrastructure and the related development and
        maintenance costs, etc.)

What is needed to create Blue-Green Infrastructure?

To implement BGI projects or citywide systems, an interdisciplinary cooperation of water management and
urban environmental planning and design is needed. BGI considers all parts of the hydrological cycle and
strives for its integration with the design of green spaces. Integrative strategies care jointly about ecological,
economic, social, and cultural sustainability. The Boston case study shows that institutional integration is
ideal, integrative approaches to BGI design and implementation can occur within single or dual-agency
contexts.

As demonstrated by the principles for Water Sensitive Urban Planning, methods and technologies that
were once solely a civil engineering issue are expanding to include a much broader array of disciplines.
This adds a level of complexity never-before seen in stormwater management discourse, for example,
particularly with regard to aesthetics and open space planning. The main challenges for sustainable
stormwater management are not technological, but increasing awareness of the benefits and supportive
skills needed for BGI implementation. To move forward, communication must improve, and ecologic,
economic and social arguments proven by data-driven analysis.

                                                                                                          Page 8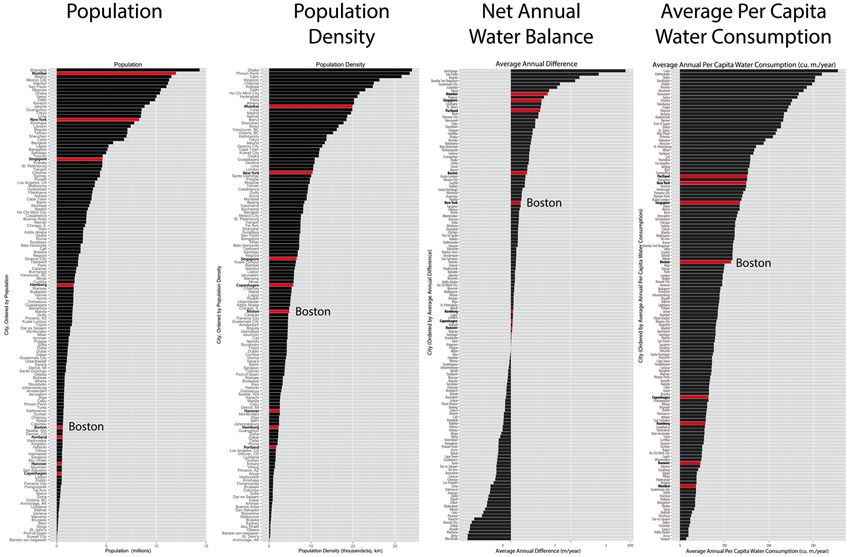
Report MIT Wescoat

3. SITUATING BOSTON’S BLUE GREEN INFRASTRUCTURE IN A LOCAL,
   REGIONAL & COMPARATIVE INTERNATIONAL CONTEXT

This section introduces the Boston case study in detail. It describes the case at three geographical scales.
First, it presents key facts about Boston’s Blue-Green Infrastructure project, known as the Emerald
Necklace (Necklace). We then proceed to a broader perspective on how the Emerald Necklace fits within
the larger context of regional water and environmental systems in the Boston metropolitan area. Finally,
we scale out to consider how Boston’s urban water system compares with that of other cities around the
world including the seven Ramboll case study cities. This sets the stage for an analysis of the planning
challenges that cities like Boston face in section 4.

a. The Emerald Necklace as a set of landscape places, types, and institutions
The Emerald Necklace consists of a rich variety of landscape places, types, and institutions. Figure 2
provides a map of the spatial connectivity among these places as part of a larger park system, and their
overall perception by the people of Boston as a valued landscape. The Emerald Necklace is a beloved
place for Boston, and it is a significant part of the city’s identity. As will be discussed in a later section of the
report, these qualities may be interpreted partly as an example of the “biophilia” or love of nature among
urban residents, and partly as an example of “symbolic capital,” in how Bostonians envision their city.

Figure 2. Modern map of the Emerald Necklace. Source: Emerald Necklace Conservancy

At the same time, each bead on the Emerald Necklace is a different kind of jewel. Commonwealth Avenue
is an urban boulevard, constructed on reclaimed land. The Back Bay Fens is a downstream urban

                                                                                                             Page 9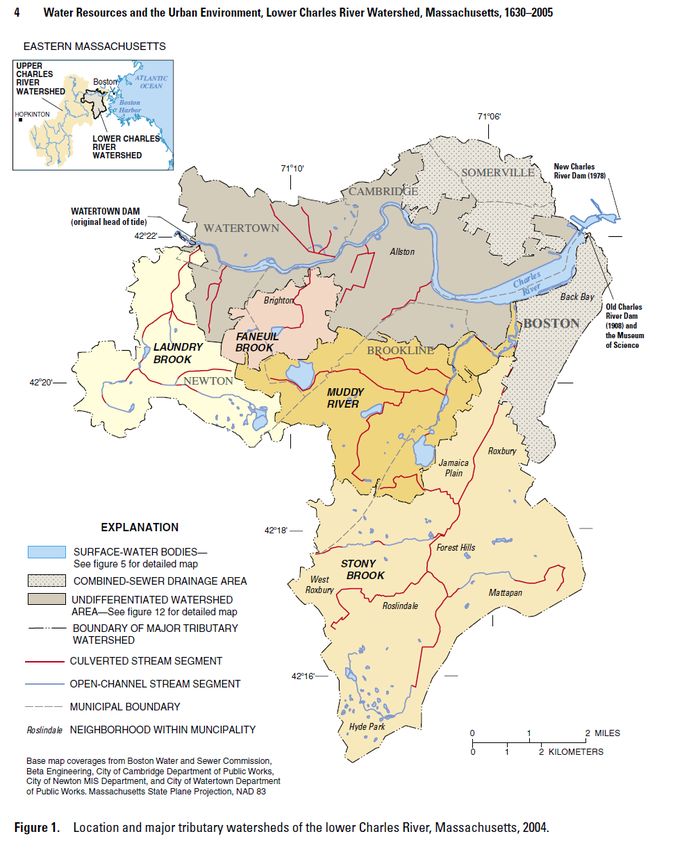
Report MIT Wescoat

drainage improvement amenity, and the first Boston’s public parks. It is linked with other parks upstream
by different types of urban greenways, such as the Riverway and Arborway. Several small urban
reservoirs or “ponds” highlight the middle reaches of the watershed. They are connected by a landscaped
Arborway to the Arnold Arboretum, which is internationally renowned for its combination of scientific botany
and landscape design. Further along the Arborway lies Franklin Park, which is the largest park in Boston
                                                                                           2
and, according to Olmsted, the only true “park” in the Emerald Necklace.

These key components of the park system vary greatly in size (Figure 3), from Franklin Park’s 166 hectares
to the small connective corridors of Commonwealth Avenue and the Riverway, which have only 1 hectares
of green space.

Figure 3. Components of Boston's Emerald Necklace, ordered by area

Remarkably, once authorized, the Emerald Necklace system was constructed in a concentrated period of
roughly two decades (Figure 4). To be sure, it had deeper historical roots. The historic “Boston Common”
                                                     th                                                 th
originates with the City itself in the early 17 century, but it was not until the mid-19 century that the next
major space known as the Public Garden was built next to the Common. The Public Garden was then
extended along Commonwealth Avenue, an urban boulevard built on reclaimed land in the tidal estuary,
                                                                                                               3
and the start of the system that would become the Emerald Necklace (Seasholes, 2003).
The park system did not develop instantly. Several proposals were put forward in the 1860s and 70s
(Zaitzevsky, 1982). However, it was not until Olmsted’s plan that the Boston Parks Commission was able
to implement the system described here. How did this happen? How did the system endure and evolve

2
 Olmsted believed a “park” had to have large open vistas both for public gathering in visual respite. He insisted that the Back Bay
Fens, by comparison, was an urban sanitary improvement.
3
  A surprising finding in this research is that the phrase “Emerald Necklace”, which is associated with Olmsted did not
seem to have been used until the 1970s. Olmsted and the City described it as the “Boston Park System.” This
renaming has proven a very successful “rebranding” of Olmsted’s contribution.

                                                                                                                            Page 10
Report MIT Wescoat
over time? What values does it have today? How can answers to these questions help us envision and
implement new blue-green infrastructure revolutions in Boston and other cities in the near future? These
are the questions that we seek to answer in this report.
Figure 4. Figure showing a timeline of construction of the components of Boston's Emerald Necklace. Emerald
Necklace components are ordered by size.
b. The Metropolitan Blue-Green Infrastructure Context of the Emerald Necklace
The Emerald Necklace does not exist in an environmental vacuum. It is part of larger scale blue and green
infrastructure systems at the metropolitan scale. Table 1 begins with the Emerald Necklace components
4
described above, which are owned and managed by the Boston Parks and Recreation Department . A
non-governmental civic organization founded in 1998 known as the Emerald Necklace Conservancy (2014)
raises funds for Necklace conservation projects and programs.
Table 1. Typology of Boston’s Blue Green Infrastructure
Places Types Organizations
Emerald Necklace Historic Park System
Commonwealth Ave Downstream urban boulevard Boston Parks and Recreation
Back Bay Fens Lowland drainage improvement Department
Riverway Urban stream & travel corridor
Jamaica Ponds Small upstream reservoirs Emerald Necklace Conservancy
Arborway Landscaped urban parkway
Arnold Arboretum Upstream public scientific park
Franklin Park Upstream public recreational park
Boston green Open space, canopy & pervious cover Multiple agencies
infrastructure
Muddy River & Stony Major urban watersheds of Boston BWSC
Brook watersheds
Green Alleys and Audubon Local, stormwater demonstration projects BWSC, Public Works Dept.
Circle
Charles River Major regional watershed Multiple Agencies
Metropolitan Park System Regional park system
of Greater Boston
Charles River Basin Downstream reservoir MA DCR
Charles River Esplanades Downstream riverbank parks
Metropolitan Water Regional water and wastewater system MWRA
Resources Authority
4
A small portion of The Riverway is located within the Town of Brookline and the Parkways alongside the Necklace are
on state-owned land.
Page 11Report MIT Wescoat
Over time, the City of Boston developed larger systems of “green infrastructure”, i.e., in its parks and
playgrounds, open spaces, tree canopy, and pervious land cover. For example, the City recently added a
set of four ecological stormwater management Demonstration Projects, required in a Consent Decree, by
the Boston Water and Sewer Commission (Marks, 2014). These and other projects are managed by a wide
array of only partially coordinated City departments.
In hydrologic terms, the Emerald Necklace is situated in parts of two small urban watersheds, known as the
Muddy River and Stony Brook, which affect its “blue” processes and performance. The watersheds have
not been designated or treated as blue-green infrastructure. Instead, the Boston Water and Sewer
Commission (BWSC) manages them primarily for functional purposes such as stormwater collection,
conveyance to the Charles River and flood mitigation by (Figure 5). Interestingly, it is when they intersect
parts of the Emerald Necklace, such as the Arnold Arboretum and Back Bay Fens that their infrastructure
value is expanded to encompass other environmental and social benefits (Tenny-Broga, Arnold Arboretum
Archives, 2015; and Poole, 2002).
Figure 5. Urban Watersheds that encompass the Emerald Necklace. Source: USGS.
Page 12Report MIT Wescoat
As shown in the inset map to Figure 5, these small urban watersheds are tributary to the larger Charles
River watershed that drains 35 communities before discharging into Boston Harbor. The Charles River
watershed is managed by numerous agencies from the Federal to State, Municipal, and NGO levels
(Figure 6). For example, water quality is managed by the U.S. Environmental Protection Agency,
Massachusetts Department of Energy and Environment, and municipal water quality permits. The Charles
River Watershed Association is a prominent NGO that monitors and advocates for water quality
improvements. It also directs a Blue Cities program that supports BGI projects in Boston and surrounding
communities.
Figure 6. Charles River Watershed in Metropolitan Boston, indicating the downstream location of the Emerald
Necklace park system. Source: CRWA?
The lower Charles River basin and Esplanade parks are immediately connected with the Emerald
Necklace’s Back Bay Fens, which is managed by the Massachusetts Department of Conservation and
Recreation (DCR) (Figure 7).
Figure 7. Downstream Charles River waterfront parks managed by the Massachusetts Department of Conservation
and Recreation (DCR), indicating the Emerald Necklace point of discharge into the river.
Page 13Report MIT Wescoat
These lower Charles River parks then fit within a larger Metropolitan Park System of Greater Boston, which
is also managed by the Massachusetts Department of Conservation and Recreation (Figure 8). That park
system was envisioned and implemented at almost the same time as the Emerald Necklace, by Olmsted’s
famous protégé, Charles Eliot. It too linked the blue infrastructure of rivers, ponds, and reservoirs, with the
green infrastructure of forests, parks, and landscaped transportation corridors. To this day, some park
roads in the Emerald Necklace are managed by DCR. Thus, one would imagine that these similarly
structured urban and regional BGI systems could be integrated in a way that function as a single multi-level
system. Although these different administration park jurisdictions coordinate with one another, they have
not been able to gain major synergies from one another, which is a limitation that needs to be understood
and hopefully transformed.
Figure 8. Metropolitan Park System of Greater Boston, in which the Emerald Necklace area is indicated as a red
rectangle.
The final important layer of blue-green infrastructure included here is the Metropolitan Water Resources
Authority (MWRA). The MWRA has responsibility for collection, storage, and distribution of water resources
to the City of Boston and many of its suburbs. It is also responsible for collection, treatment, and discharge
Page 14Report MIT Wescoat
of metropolitan sewage (Figure 9). This system provides an essential regional water resources perspective
on blue-green urban infrastructure for several reasons: 1) if urban BGI can recharge soil moisture and
groundwater, it can conserve and reduce regional water demand; 2) it can slow down and reduce the
volume of stormwater that enters regional sewerage systems; and 3) it thus can also reduce energy and
capacity requirements of regional water and wastewater treatment plants. With separation of combined
sewers in cities like Boston, some of these historical linkages are changing, but the connections among
regional water supply, demand, and disposal planning are key dimensions of urban BGI, as elaborated in
the next section on key urban and water attributes of the Boston case study.
Figure 9. Metropolitan Water Resource Authority’s supply region
c. Profile of Urban, Water, and Environmental Systems in the Boston Metropolitan Region
In this section we introduce the broader context of Boston as a city, which is defined in part by its
population size and density, hydroclimatic water supply, and per capita water demand.
Boston, MA is the state capitol of Massachusetts. It was settled in 1630 and is therefore one of the oldest
urban areas in the original 13 U.S. colonies. Boston was officially incorporated as a city almost two
centuries after its settlement, in 1822.
i. Population Size and Density
By 2013, the population was 655,884 people, while that of the metropolitan area was 4.6 million, making it
the 10th largest in the United States. Boston’s city area is 232 km2, and that of the metropolitan area is
~11,700 km2, so the population densities of the city and metropolitan area are 2,825.4 and 396
people/km2, respectively. Figure 10 indicates the wide range of densities in the City, and it is interesting
that the Emerald Necklace parks extend from high to middle density areas of the City. The high density,
high value, land was actually part of a reclamation process that acquired the land when it had much lower
Page 15Report MIT Wescoat
cost, and sold adjacent parcels of appreciating reclaimed land to finance additional parks (Berrezebeitia,
pers comm. 2015).)
Figure 10. Boston population density by Census Block
Boston, as a city in the U.S., is considered to have a very high Human Development Index of 0.914. It is
ranked 5th in the world. The nominal GDP for the Boston metropolitan area for 2013 was USD$ 370.769
billion in 2013, placing it in the top 10 U.S. cities (as ranked by metropolitan GDP for 2013). Dividing by the
population of the Boston metropolitan area gives a nominal GDP per capita for 2013 of USD$80,098 (BEA,
2014).
ii. Hydroclimatic Water Supply
Boston is located at latitude of 42° 21’ N and a longitude of 71° 03’ W on the eastern seaboard of the
United States of America. It is classified in the Köppen climate classification system as having a humid
continental climate with hot summers (Dfa). This can be visualized using a water budget approach (Figure
11).5 The monthly water balance chart and data were obtained from the online interface WebWIMP
(climate.geog.udel.edu/~wimp/). A water budget diagram plots two variables, Precipitation (P) and
5
The hydroclimatic terms water budget and water balance are used interchangeably. It is important to note that the
water budgets described here are point data, and do not describe the watershed or water system’s overall supply.
Page 16Report MIT Wescoat
Evapotranspiration (ET). From those two variables and initial assumptions about soil conditions, one can
estimate changes in Storage (DST), Surplus (SURP), and Deficit (DEF).
Figure 11. Components of the net annual water balance for Boston, MA. Source: WebWIMP. URL:
climate.geog.udel.edu/~wimp/.
As shown in Figure 11, Boston has a surplus water balance for most of the year and only has a deficit for a
few months during the summer. The average total monthly precipitation is quite constant for Boston, MA
throughout the year. The monthly average is 93.4 mm/month +/- 8.5 mm/month (about 10%), and the range
among months is only 31mm. This bears comparison with other humid European cities and also Singapore,
and it stands in sharp contrast with monsoon climates such as Mumbai and arid climates.
The minimum and maximum temperatures experience a much larger variation throughout the year, ranging
from around 0°C in the winter months of December, January, and February to warm temperatures during
the summer months of June, July, and August. These differences in temperatures have substantial effects
on evapotranspiration rates (ETo), which peak at about 150 mm per month in mid summer.
The net surplus water balance in the spring and fall months, and the net deficit water balance in summer,
are summarized in figure 12 below.
Page 17Report MIT Wescoat
Figure 12. Net monthly water budget for Boston, MA in mm/month
In addition to these average conditions, it is important to understand patterns and trends in extreme storm
events (Fig 13). Boston receives an average of 16 heavy rains per annum.6 These are storms greater than
7.6 mm/hr, and again they bear comparison with European but not monsoon Asian urban storm events.
Figure 13. Histogram of the number of heavy rain events per year, as defined by rainfall events exceeding 7.6mm/hour
6
Number of heavy rains per annum is based on data from 1948-2012. The standard deviation was +/- 7. The definition
for heavy precipitation used was any event exceeding 7.6mm in an hour. Precipitation data was obtained from the U.S.
National Oceanic and Atmospheric Administration (NOAA).
Page 18Report MIT Wescoat
iii. Annual water demand
In addition to the demand that climate makes on natural rainwater supply, it is important to understand the
water demand of cities. The international Urban Metabolism database at MIT lists Boston’s water use at
approximately 315 liters per capita per day (lpcd). This amount reflects gross supply divided by population.
Actual per capita water use at the household level is somewhat lower, and is declining, based in part on
loss and leak control, in part on conservation demand management, and in part on increasing water prices.
The current household standard for cities in Massachusetts is 65 gallons per capita per day (246 lpcd). We
offer a comparative international perspective on Boston’s population density, water supply, and water
demand in the section that follows.
d. How “Boston” Fits Within a Larger International Sample of Urban Water Systems
Our research compared Boston and the other Ramboll case study cities with a larger sample of 142 cities.
This section shows how Boston compares with these other cities on three key criteria relevant to the study:
net climatic water budget, annual per capita water use and urban population density (figure 14).
Figure 14. Comparative urban and water variables in the Ramboll study.
Page 19Report MIT Wescoat
The left hand figure shows that Boston is one of the smaller cities in the Ramboll study in terms of
population size. The chart second from the left shows that Boston has a median population density. It has
the third largest annual water surplus in hydroclimatic terms, and it has an above median per capital water
use. Boston thus is in a relatively good position with a high supply relative to its demand; even so, it has
needed to develop a long distance regional water reservoir and aqueduct system to supply the City and its
suburbs. These four variables are compared for the Ramboll case study cities below.
i. Population and Population Density
Mumbai is the case study city with the largest population. In the larger database of cities, its size is
exceeded only by Shanghai. However, in this study, New York and Singapore are also quite large in terms
of population. Hamburg is close to the middle as far as population goes, while Boston, Hanover, and
Copenhagen are all smaller cities relative to those in the database. While population density is correlated
with population size, smaller cities like Boston and Copenhagen are similar in density to Singapore. The
two German case studies are similar in density despite being very different in population size. Population
size and density are useful to keep in mind when comparing BGI projects in different urban contexts.
Arguably, density is more significant in affecting and constraining what can be done in spatial terms, while
population size may affect what can be done in terms of programming.
Table 2. Selected city attributes for the Ramboll cases, including those for variables used in clustering
Variables Used in Clustering
City Population Population Average Per Capita Water Net Annual
Density Consumption Water Balance
3
Millions Capita/km2 m /capita/year L/capita/day m /year
Boston 0.599 4783 115 315 0.540
Copenhagen 0.505 5740 64 175 0.063
Hamburg 1.60 2258 57 156 0.073
Hanover 0.518 2541 46 126 0.050
Mumbai 12.0 19865 36 99 1.231
New York City 8.27 10350 149 408 0.332
Portland 0.584 1689 151 414 0.980
Singapore 4.59 6582 135 367 1.030
ii. Hydroclimatic water supply
Of the eight case studies in the table above, Boston's net annual water balance puts it in the middle, along
with New York. Mumbai has the highest net annual water balance, followed closely by Singapore. Both
Mumbai and Singapore have an excess of 1m/year, though Mumbai has more pronounced monsoon wet
and dry seasons. The European case study cities of Hanover, Hamburg, and Copenhagen do not have
annual surpluses or deficits, on average, but may be more susceptible to deficits in periods of drought and
Page 20Report MIT Wescoat
climate variability. When we look at where these cities lay in the rank order plot of net annual water
balance, we see that the size case studies lay in pairs that lie relatively close together.
We also found that the case studies do not have any representation for the cities with large negative net
annual water balances. This is a distinct and significant gap in the coverage of the case studies. It is true
that cities with net annual water balances can be considered to reside in arid regions. However, it would be
incorrect to assume that these cities would not benefit from BGI. On the one hand, while a city may have a
negative net annual water balance, there may be some months where the net monthly water balance is
positive. And even during months where the monthly balance is negative, a city in an arid region may still
receive an intense rainstorm. A case in point is the city of Los Angeles, which is in the middle of an historic
drought. Yet at the same time that efforts to conserve water are ramping up due to drought conditions Los
Angeles has been pummeled by severe rainstorms that have caused major landslides and significant
property damage. In fact, Los Angeles also has an effort to expand BGI within the city to mitigate
stormwater runoff, similar to the Ramboll case studies. Similarly, Riyadh, Saudi Arabia, just received the
Aga Khan Award for Architecture for its extensive Wadi Hanifa Wetlands Project. Thus, net annual water
balance affects the types of BGI water and plantings patterns appropriate for BGI projects in different cities,
but all cities have BGI potential and can draw by analogy from the Ramboll cases.
iii. Water use
New York City has the highest per capita water consumption of the Ramboll cases, followed closely by
Portland, which is widely regarded as a water-conserving city. New York, Portland, Singapore, and Boston
are in the upper half of cities in terms of per capita water consumption, while Copenhagen, Hanover, and
Hamburg, are in the lower half. There could be greater representation of cases between Boston and
Copenhagen, which drops from 315 to 175 lpcd. At the low end, Mumbai is the only case study with an
average per capita water consumption of less than 100L/capita/day, and the standards in India are to raise
that amount to 135 lpcd. This is around the threshold of the WHO recommended daily allowance for water
for human health, which is between 50-100L/capita/day. In reality, the residents in Mumbai have widely
different levels of access to water and sanitation. There is greater potential to explore the types and
benefits of BGI that develop in these different water use circumstances.
The next step is to analyze these variables jointly, in order to classify the case study cities by their
population density, water balance, and water use.
e. Cluster Analysis of Urban and Water Variables
When we examine jointly the three variables most relevant for this study – urban density, water supply, and
water use – using a hierarchical cluster analysis. -- The results are plotted as a dendrogram and shown in
Page 21Report MIT Wescoat
Fig. 15. When the dendrogram is split into six clusters, Boston is grouped into a cluster with Singapore and
New York City. It is also interesting to consider which cities are most similar to Boston and these other
cases within the larger cluster. The subclusters that include the case studies are shown in Fig. 16.
Examining the subclusters, we see that Boston is grouped most closely with Minsk and Panama City. New
York was paired with Geneva only at the same level of similarity. In contrast to New York and Boston,
Singapore is grouped with a number of different cities. It is grouped most closely with Buenos Aires and
then this pair is grouped with Melbourne. At the next level of clustering, it was then grouped together with
the pair of Amsterdam and Chicago. Finally, the subcluster includes Sofia, Shanghai, Kuala Lumpur, and
Anchorage.
Among the Ramboll case studies, Boston is most closely associated with Singapore, followed by New York
City and Portland, followed by Copenhagen (figure 16). It is significantly different from the cluster that links
Hamburg, Hanover, and Mumbai (i.e., low water use cities).
Figure 15. Dendrogram of cluster analysis results.
Page 22Report MIT Wescoat
Figure 16. Close-up of the Boston, Singapore, and New York city subgroups of the dendrogram shown in Fig. 15.
These cluster analysis results should be interpreted as relative relationships between cities based on the
three variables used to cluster them. These types of data-mining provide information about how similar and
different the Ramboll case studies are relative to 136 other cities around the world. While these 136 other
cities have not been examined in the same depth as the Ramboll cases, they provide some context for
understanding how the cases compare with each other as well as with other cities around the world.
With these ways of situating the Boston case study in local, regional, and international terms, we are now
prepared to examine the BGI planning challenges that cities like Boston face today.
Page 23Report MIT Wescoat
4. CHALLENGES THAT CITIES LIKE BOSTON FACE TODAY
With this urban, regional, and international context for the Emerald Necklace case study, we may consider
the challenges that cities like Boston face today. Boston’s challenges are most fully presented in its plans,
budgets, and open space studies, which are the product of intensive community and professional
consultation. This section of the report reviews the challenges identified in current plans, with a special
emphasis on the extent to which they include proposals for BGI to address those challenges. As such, this
section discusses the role of BGI in Boston’s plans, and not the research team’s arguments about what
BGI could and should be in Boston, which are research inferences drawn in later chapters of the study.
Urban Scale Challenges
7
Each year the Mayor of Boston (2015) offers a Boston State of the City address. In his first state of the
city address Mayor Martin Walsh identified the following four challenges and priorities for Boston:
• Improving Education for Today and the Future (performance; facilities)
• Spurring Innovation, Supporting Creativity (start-ups; IT; apps)
• Stronger Neighborhoods, Making Housing More Accessible, Affordable (incentives; makeovers)
• Helping Our Most Vulnerable Residents (e.g., seniors)
8
He also referred to Boston’s membership in Rockefeller Foundation’s 100 Resilient Cities program. Two
points stand out in the Mayor’s address: First, the challenges he described did not mention the city’s blue
or green infrastructure, which is a challenge for the field. For BGI to gain greater traction in public finance,
it will have to address the pressing socio-economic challenges that were addressed. Second, the month
after the mayor’s address, Boston experienced an unprecedented record snow emergency (~110 inches),
9
which crippled urban transportation infrastructure and daily activities. In addition to winter storms, the
number of intense rainfall events has increased in frequency and intensity in recent years (Figures 13 and
14). Sea level rise and coastal storm surge are escalating concerns in Boston. The question that comes to
mind, but that was not mentioned in the Mayor’s address is: How might BGI in Boston address new
challenges from extreme weather events?
7
http://www.cityofboston.gov/stateofthecity/
8
http://www.100resilientcities.org/
9
http://www.mass.gov/governor/docs/news/attachment-a-severe-winter-weather-pattern-impacts-supplemental-info.pd
f
Page 24Report MIT Wescoat
Figure 17. Figure of the 5 minutes precipitation intensity vs. storm return frequency. Research suggests that more
intense storms will become increasingly frequent. This leads to increased risk of flooding and flood extent, with
associated damages.
Figure 18. Plot showing the return precipitation height (in mm, on the ordinate) associated with various storm durations
(in hours, on the abscissa) for various storm return frequencies (in years, identified by individual plots and different
colors). The line texture shows the minimum, mean, and maximum of the range of associated precipitation heights for
the different scenarios.
Page 25Report MIT Wescoat
However, on a separate occasion the same Mayor of Boston (2015) stated:
The future of Boston lies in its parks and open spaces. Our parks bring people
together, diffuse social pressures, educate and strengthen our children, cool our
planet, keep us healthy, and add economic value to our endeavors. They can
10
become a powerful organizing force for advancing our city’s image.
As we shall see, this statement conveys many of the types of “value” and “capital” that are examined in a
later section of the Boston study, namely, natural capital, social capital, human capital, built capital, and
symbolic capital.
In administrative terms, the Boston Redevelopment Authority (BRA) has the principal responsibility for
preparing plans for the City. A recent BRA publication presents a demographic and economic profile of the
11
City, listing some of its current challenges as:
• Growing population size, diversity, and youth. The city is #6 in the nation in immigration; and
major immigrant groups include those from the Dominican Republic, China, Viet Nam, and Latin
America.
• Boston is #1 in growth of young professionals
• It is a well-educated population (#5 higher education);
• Growing employment (esp., computers, food and drink, health; though it has experienced losses
in financial & investment employment).
None of these demographic attributes are linked with environmental conditions. However, other BRA
environmental planning initiatives do have actual or potential connections with BGI. They include:
12
• Climate change preparedness and resiliency
13
• Living with Water 2015 design competition for coastal planning
14
• Waterfront planning and development
15
• Water transportation
16
• Urban agriculture
It is not clear how such challenges and planning initiatives relate to one another, which is usually the task of
a comprehensive plan. However, it may come as a surprise that Boston had not prepared a
comprehensive plan in fifty (50) years! Again, in 2015, BRA began a process for BOSTON 2030, its first
10
Mayor Martin J. Walsh, Transition Team Report on Energy, Environment and Open Spaces, April 2014 – quoted in
Draft Open Space Master Plan, 2015, p. 2-1
11
BRA. Boston Economy Publication 2013.
http://www.bostonredevelopmentauthority.org/getattachment/86038673-b830-4152-9108-3c50978aa69e/BOSTON
12
http://www.bostonredevelopmentauthority.org/getattachment/b0847519-3045-4d2f-b7e7-23e6b91f63c4
13
http://www.bostonlivingwithwater.org/
14
Downtown Waterfront Public Realm Plan DRAFT 4-09-14
15
South Boston Waterfront Sustainable Transportation Plan Executive Summary 2015-01-15.
16
Article 89 Made Easy - Demystifying the City's New Zoning Article for Urban Agriculture
Page 26Report MIT Wescoat
comprehensive plan in 50 years (to be completed in 2017). The Boston 2030 Request for Proposals (2015)
gives a sense of major challenges facing Boston today. The RFP identifies 8 major themes:17
1. Housing: Building the housing that keeps Boston accessible to all.
2. Mobility: Creating an efficient, equitable, sustainable transportation system.
3. Environment + Adaptation: Using our natural resources wisely while preparing for the impacts of
a changing climate.
4. Parks + Open Space: Providing world-class spaces for recreation and public life.
5. Prosperity + Equity: Creating jobs and supporting education and workforce development
infrastructure to broaden economic opportunity.
6. Arts, Culture + Creativity: Enriching Boston and harnessing our creative potential in all
endeavors.
7. Land Use, Design + Placemaking: Building on a rich tradition of creating vibrant urban places
and neighborhoods.
8. Health: Improving and sustaining the health of our population.
The Parks and Open Space theme is most closely associated with BGI, but it is framed in the old language
of parks and open space rather than BGI ideals of urban landscape restoration, biophilia, or ecosystem
services. Each of the other themes can be associated with and positively affected by Blue-Green
Infrastructure. For example, Housing can acquire greater value through BGI, and climate adaptation can
be enhanced by BGI. The arts, culture, creativity, and placemaking are all advanced by BGI. The rapidly
growing field of the health benefits of environmental design can be directly linked with BGI.18 However, the
text of current plans indicates that these connections would need to be made far more explicit than they are
at present.
Thus, a major finding is that Blue-Green Infrastructure is at present implicit, and not a
coherently defined goal for urban planning and design in Boston.
Independent of its comprehensive plan, Boston is finalizing a Master Plan for Parks and Open Space for
19
2015-2021. The nearly 750 page long Draft Open Space Master Plan (OSMP) is organized in seven
major sections: 1) Community Setting; 2) Environmental Inventory and Analysis; 3) Inventory of Lands of
Conservation and Recreation Interest; 4) Community Vision; 5) Analysis of Needs; 6) Goals and Objectives;
and 7) Action Plan. The sections most pertinent to this study are the Analysis of Needs and Action Plan.
The Needs are divided into three major sections: 1) Resource Protection, which includes Greenways,
Harbor Open Space, and Urban Wilds and Natural Areas; 2) Community Open Space and Recreation for
17
http://imagine.boston.gov/#mission.
18
http://dirt.asla.org/2015/06/03/what-dose-of-nature-do-we-need-to-feel-better/
19
A
copy
of
the
draft
master
plan
was
downloaded
from
the
internet
before
it
was
taken
down
for
finalization;
copy
on
file
with
authors;
previous
Master
Plan
online
at:
http://www.cityofboston.gov/parks/openspace0814.asp.
Page 27Report MIT Wescoat
each major neighborhood of the city; and 3) Open Space Systems Management which includes cemeteries,
community gardens, the Emerald Necklace; Public Shade Trees. Two important aspects of this
organization are first, that with the exception of the harbor, it does not feature water resources; and second,
that what we are calling Blue-Green Infrastructure is split between the first and third sections.
Significantly for this case study, the Open Space Master Plan has a chapter devoted to needs and priorities
for the Emerald Necklace. That vision emphasizes the following topics in its Analysis of Needs:
SPECIFIC TOPICS MENTIONED IN THE OSMP FOR THE EMERALD NECKLACE
Historic Landscape Integrity
Unity of access
Awareness and education
Safety and security
Trees
Shrub plantings
Woodlands
Wildlife management
Water quality
Infrastructure
Structures
Existing Art Works and Memorials
Memorials and gifts
Intrusive elements
Fundraising and collaborative efforts
Maintenance
Project review and approvals
Page 28Report MIT Wescoat
This list of topics has changed little since the previous Open Space Master Plan for 2008-2015. All of these
topics have relevance for BGI. They include many of the types of value considered here, i.e., natural capital;
built capital; symbolic capital; financial capital; and some measure of social capital. However, they do not
present a visionary list of needs and priorities. They deal mainly with green infrastructure and are
functional and practical in nature.
Finally, Boston recently conducted an innovative Youth Participatory Budgeting exercise that identified four
projects. One of them involves a type of Blue-Green Infrastructure that is less emphasize in professional
practice - installing water bottle refill systems in City parks. These methods of Citizen and Youth budgeting
are very popular, and have great potential.
Regional Scale Challenges
th
At the larger regional scale envisioned by landscape architect Charles Eliot and others in the late-19
century, the MAPC (2014) adopted a MetroFuture plan in 2008 and a Strategic Plan for 2015-20 (2014).
The Strategic Plan adopted the following priorities:
Priority A: Encourage development and preservation consistent with smart growth principles
Priority B: Partner with our cities and towns to promote regional collaboration, enhance effectiveness,
and increase efficiency.
Priority C: Play a leading role in helping the region to achieve greater equity
Priority D: Help the region reduce greenhouse gas emissions and adapt to the physical,
environmental, and social impacts of climate change and natural hazards.
These priorities stress social equity and economic efficiency, which again, have not been as closely
connected with BGI. Detailed sections on Energy, Air, Water, and Wildlife come closer to concepts of
20
blue-green infrastructure.
As mentioned above, the Massachusetts Department of Conservation and Recreation has responsibility for
the Metropolitan Park System of Greater Boston. However, by all accounts that State agency has been
suffering from severely diminishing funding.
The most significant structural in the case of Boston and other U.S. cities is declining
public sector finance, caused by higher social service demands and diminished tax
revenues. Funding cuts jeopardize all public sector initiatives including BGI in the U.S.
20
http://www.mapc.org/sites/default/files/MetroFuture_Goals_and_Objectives_1_Dec_2008.pdf
Page 29Report MIT Wescoat
Multi-Scale and Urban Civil Society Challenges
Local BGI projects increasingly involve multi-scale collaboration. The Muddy River Restoration Project is
an excellent example. Initiated after the 1996 floods in part to create more flood storage, this project is led
by the U.S. Army Corps of Engineers with active roles by the State of Massachusetts, MWRA, Boston
Water and Sewer Commission, and Boston Parks and Recreation. It also has an Oversight Committee
(MMOC) that includes leading civil society organizations. The MMOC has articulated five major challenges
for this explicitly BGI project: 1) Flood Control Improvement; 2) Improvement of Water Quality; 3)
Enhancement of aquatic/riparian habitat; 4) Rehabilitation of Landscape & Historic Resources; and 5)
21
Implementation of Best Management Practices (BMPs). Phase I is moving toward successful completion,
but Phase II is held up, once again, by stalled public funding, this time at the federal level.
The Charles River Watershed Association is an active member of the MMOC. It was created to address
the deteriorating regional water quality of the Charles River. It has argued persuasively that these
challenges involve contaminated land use runoff as well as combined sewer overflows. As noted earlier, it
also has a “Blue Cities Program” that is helping develop stormwater demonstration projects mandated by a
Consent Decree, in which the Boston Water and Sewer Department will install and monitor small-scale
blue green infrastructure projects that reduce urban stormwater runoff (Marks, 2014). It is the most “blue”
of the regional organizations.
The next larger regional organization related to BGI is the Boston Natural Areas Network, which supports
22
the following programs that have much in common with BGI projects.
• Community Gardens
• Urban Wilds
• Greenways
• Trees & Orchards
• City Natives
• Garden Education
Returning to the urban scale, the Emerald Necklace Conservancy NGO stands out as an umbrella NGO,
23
along with some 40 NGOs associated with the various Necklace Parks, greenways, and amenity types.
This organization emphasizes volunteer programs and partnership with the Boston Parks Department.
We conclude from this complex scale of challenges that BGI alternatives are being defined
and advanced as much or more by civil social organizations and NGOs, as by public
agencies. Public-private partnerships and civil society organizations are attempting to
21
http://www.muddyrivermmoc.org/.
22
http://www.bostonnatural.org/index.htm.
23
http://www.emeraldnecklace.org/.
Page 30Report MIT Wescoat
address declining public investment, combining the authority of the state with the
resources of non-state actors.
5. RESEARCH FINDINGS ON HOW BOSTON HAS ADDRESSED SUCH
CHALLENGES USING bgi: THE EXPANDED PROCESS MODEl approach
Historical Geographic Description of the Boston Case
In the course of researching the Boston and Mumbai case studies, we developed an historical geographic
24
method for describing a case that may have relevance for other case studies in the project. To describe a
BGI case, it is prepare a chronology of its origins and development, along with maps of its geographic
context.
The historical chronology of a case study should begin with its antecedent conditions including both the
problems and inspirations for the Blue Green Infrastructure approach. The major historical periods of this
case study of the Emerald Necklace are:
• 1850s – Large scale tidal land filling for real estate development in Boston. Sewage discharge in
low-lying tidal areas along the Charles River.
• 1870s – Newly created Parks Commission acquires land for recreational and urban improvement
purposes.
• 1880s – Frederick Law Olmsted hired to prepare plans, implemented over the next two decades.
• 1900s – Other major components of the “Necklace” developed
• 1910s – Impoundment of the Charles River changes the brackish tidal regime into a stable
freshwater reservoir, i.e. only the stormwater storage and recreation functions retained.
• 1920s – Major revisions for automobile circulation and extensive conversion of park marshland
for increased recreational use.
• late 1980s-2000 – Master-planning efforts
• 2010s – Ecological design initiatives
24
For the Mumbai case see Rawoot et al. 2015.
Page 31You can also read