Brain Structural Network Compensation Is Associated With Cognitive Impairment and Alzheimer's Disease Pathology
←
→
Page content transcription
If your browser does not render page correctly, please read the page content below
ORIGINAL RESEARCH
                                                                                                                                             published: 25 February 2021
                                                                                                                                         doi: 10.3389/fnins.2021.630278

                                             Brain Structural Network
                                             Compensation Is Associated With
                                             Cognitive Impairment and
                                             Alzheimer’s Disease Pathology
                          Edited by:
                                             Xiaoning Sheng 1 , Haifeng Chen 1,2,3 , Pengfei Shao 1 , Ruomeng Qin 1,2,3 , Hui Zhao 1,2,3 ,
                             Yong Liu,
                                             Yun Xu 1,2,3 , Feng Bai 1,2,3* and Alzheimer’s Disease Neuroimaging Initiative †
           Beijing University of Posts
    and Telecommunications (BUPT),           1
                                              Department of Neurology, Affiliated Drum Tower Hospital of Medical School and The State Key Laboratory
                                 China       of Pharmaceutical Biotechnology, Institute of Brain Science, Nanjing University, Nanjing, China, 2 Jiangsu Province Stroke
                       Reviewed by:          Center for Diagnosis and Therapy, Nanjing, China, 3 Nanjing Neuropsychiatry Clinic Medical Center, Nanjing, China
                            Jiu Chen,
     Nanjing Medical University, China
                          Swati Rane,        Background: Structural network alterations in Alzheimer’s disease (AD) are related to
            University of Washington,        worse cognitive impairment. The aim of this study was to quantify the alterations in
                        United States
                                             gray matter associated with impaired cognition and their pathological biomarkers in
                   *Correspondence:
                            Feng Bai
                                             AD-spectrum patients.
                 baifeng515@126.com
                                             Methods: We extracted gray matter networks from 3D-T1 magnetic resonance imaging
     † Data    used in preparation of this
                                             scans, and a graph theory analysis was used to explore alterations in the network
          article were obtained from the
     Alzheimer’s Disease Neuroimaging        metrics in 34 healthy controls, 70 mild cognitive impairment (MCI) patients, and 40 AD
                Initiative (ADNI) database   patients. Spearman correlation analysis was computed to investigate the relationships
        (adni.loni.usc.edu). As such, the
            investigators within the ADNI    among network properties, neuropsychological performance, and cerebrospinal fluid
          contributed to the design and      pathological biomarkers (i.e., Aβ, t-tau, and p-tau) in these subjects.
         implementation of ADNI and/or
  provided data but did not participate      Results: AD-spectrum individuals demonstrated higher nodal properties and edge
in the analysis or writing of this report.
                                             properties associated with impaired memory function, and lower amyloid-β or higher
               A complete listing of ADNI
           investigators can be found at     tau levels than the controls. Furthermore, these compensations at the brain regional
  http://adni.loni.usc.edu/wp-content/       level in AD-spectrum patients were mainly in the medial temporal lobe; however, the
          uploads/how_to_apply/ADNI_
             Acknowledgement_List.pdf.
                                             compensation at the whole-brain network level gradually extended from the frontal lobe
                                             to become widely distributed throughout the cortex with the progression of AD.
                    Specialty section:
          This article was submitted to      Conclusion: The findings provide insight into the alterations in the gray matter network
               Brain Imaging Methods,        related to impaired cognition and pathological biomarkers in the progression of AD. The
                a section of the journal
             Frontiers in Neuroscience
                                             possibility of compensation was detected in the structural networks in AD-spectrum
       Received: 17 November 2020
                                             patients; the compensatory patterns at regional and whole-brain levels were different
        Accepted: 26 January 2021            and the clinical significance was highlighted.
       Published: 25 February 2021
                                             Keywords: cognitive impairment, pathological biomarkers, Alzheimer’s disease, structural compensation ability,
                              Citation:      gray matter (GM) atrophy
    Sheng X, Chen H, Shao P, Qin R,
               Zhao H, Xu Y, Bai F and
  Alzheimer’s Disease Neuroimaging
      Initiative (2021) Brain Structural
                                             INTRODUCTION
Network Compensation Is Associated
            With Cognitive Impairment
                                             Alzheimer’s disease (AD), the most prevalent cause of dementia, is characterized by progressive loss
 and Alzheimer’s Disease Pathology.          in the activities of daily living and cognitive impairment, which causes a very large socioeconomic
          Front. Neurosci. 15:630278.        burden (van der Lee et al., 2018). The number of individuals with AD is increasing significantly
     doi: 10.3389/fnins.2021.630278          every year, and 10–20% of people aged 65 or older suffer from mild cognitive impairment (MCI)

Frontiers in Neuroscience | www.frontiersin.org                                     1                                         February 2021 | Volume 15 | Article 630278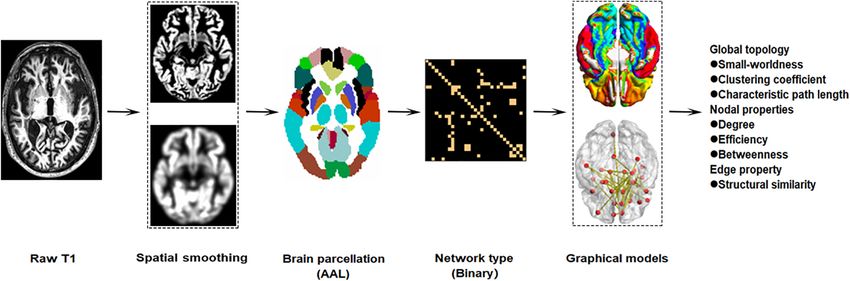
Sheng et al.                                                                                                Brain Structural Network Compensation

which is known as a prodromal clinical stage of AD (Kim et al.,              To this end, we compared the structural networks and
2020). However, the effective period of symptomatic treatment is          the structural similarity within gray matter in AD-spectrum
limited (Patnode et al., 2020). Therefore, the early diagnosis and        patients using a graph theoretical approach (Rubinov and Sporns,
prognosis of clinical AD-spectrum patients is of great importance         2010). In the present study, the aim was to explore whether
as it increases the time window to implement interventions that           gray matter network parameters were linked to declines in
attenuate or reverse deterioration (Luo et al., 2019).                    cognitive impairment and abnormal CSF pathology in AD-
    Structural magnetic resonance imaging (MRI) is a promising            spectrum patients.
approach used to identify the progression of disease (Lane
et al., 2019). Evidence has been accumulating that changes
leading to cognitive impairment and dementia are not limited              MATERIALS AND METHODS
to specific regions but rather exhibit widespread changes in
connectivity and topological properties that have emerged as              Data used in the preparation of our study were obtained from the
potential intermediate biomarkers for AD (Verfaillie et al., 2018).       Alzheimer’s Disease Neuroimaging Initiative (ADNI) database1 .
The pattern of gray matter morphology can be defined as a                 The protocol was authorized by the ADNI and informed consent
network that consists of multiple regions (i.e., nodes) that are          was obtained according to the Declaration of Helsinki. The
interconnected when structural similarity is exhibited within the         ADNI was launched in 2003 as a non-profit organization, led
cortex across subjects (Beheshti et al., 2017). The advantage of          by Principal Investigator Michael W. Weiner, MD. The aim of
examining the morphology of gray matter networks is that it               the ADNI is to test whether neuroimaging, neuropsychological
provides the possibility to accurately quantify individual brains         assessment, and biological markers could track the progression
using tools from graph theory (Batalle et al., 2013; Beheshti             of AD and conduct early diagnosis. For up-to-date information,
et al., 2017). For example, the small world coefficient provides          see adni-info.org.
an indication of whether the organization of connections in the
network is different from a randomly organized network (Zhao              Study Population
et al., 2017). Although the biological significance of structural         This study included 34 healthy controls (HC), 70 early or late
similarities is not fully understood, the similarity within gray          MCI patients, and 40 AD patients, and used a subset of T1-
matter has been shown to be related to synchronized maturation            weighted MRI images for these 144 subjects. Subjects were
between brain regions, which may reflect a higher degree of               originally recruited for ADNI-GO or ADNI-2. Group inclusion
clustering (Wang et al., 2018). Previous studies have shown               criteria were as follows. HC subjects had no memory complaints,
that changes in structural properties in gray matter are related          a CDR score of 0 and Mini-Mental State Examination (MMSE)
to the degree of cognitive impairment and disease severity in             scores between 26 and 30. MCI subjects had a CDR score
individuals with AD (Vipin et al., 2018). In the early and                of 0.5, MMSE scores between 21 and 30, as well as memory
preclinical stages of dementia, the gray matter network might             complaints and abnormal memory function according to the
commence reorganization and show high resilience to network               Logical Memory II subscale (Delayed Paragraph Recall) from the
integrity damages (Lin et al., 2020). Previous studies have further       Weschler Memory Scaled—Revised (=8 for 16 years and more of
demonstrated that lower cerebrospinal fluid (CSF) Aβ42 levels             education; =4 for 8–15 years of education; and =2 for 0–7 years
in individuals with cognitive impairment were closely associated          of education), but an absence of dementia. To be included in
with the perceived decline in memory performance (Zhang                   the AD group, participants had memory complaints, CDR scores
et al., 2018). In a series of structural neuroimaging studies,            between 0.5 and 2.0, MMSE scores less than 26, and presented
it was reported that individuals with cognitive impairment                the criteria for probable AD diagnosis according to National
exhibited, from the perspective of topological properties, higher         Institute of Neurological and Communicative Disorders and
nodal degree centrality and lower nodal betweenness in the                Stroke/Alzheimer’s Disease and Related Disorders Association
bilateral hippocampus, compared to the healthy controls (Chen             (NINCDS/ADRDA) (Lu et al., 2019). In addition, we also
et al., 2020). Recently, structural similarity within the gray            excluded participants with a history of significant psychiatric
matter network in individuals with cognitive impairment was               and neurological illness (e.g., depression, stroke, traumatic brain
mainly related to the thalamus, insula, and occipital cortex              injury, and others). All participants were required to provide
and was associated with poor memory performance (Ahmed                    informed consent compatible with the local sites (Institutional
et al., 2019). However, there has been no research exploring              Review Board regulations). Table 1 shows the detailed clinical
the altered structural network measures related to pathological           and demographic information for these subjects.
biomarkers in combination with the structural similarity and
topological properties in patients with cognitive impairment.             Clinical and Neuropsychological
If individuals with cognitive impairment at the early stage               Measurement
of AD could be identified, they may benefit from early                    All participants received a series of cognitive evaluations in
targeted intervention. With developments in neuroimaging,                 the primary analyses, including the MMSE, Montreal Cognitive
an increasing number of studies have focused on identifying               Assessment (MoCA); Functional Activities Questionnaire (FAQ);
brain functional and structural alterations related to the AD             Clinical Dementia Rating Sum of Boxes (CDRSB); Alzheimer’s
continuum, which may potentially be considered a biomarker
of AD pathology.                                                          1
                                                                              adni.loni.usc.edu

Frontiers in Neuroscience | www.frontiersin.org                       2                                  February 2021 | Volume 15 | Article 630278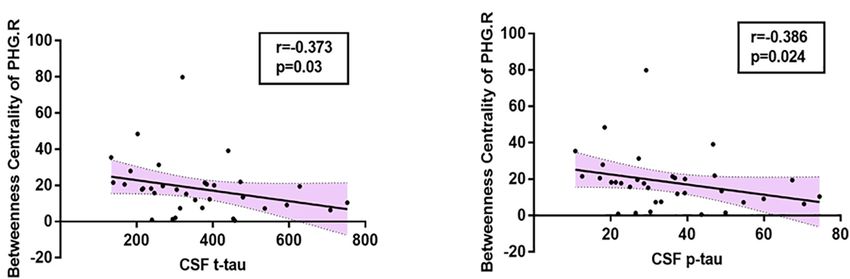
Sheng et al.                                                                                                                          Brain Structural Network Compensation

TABLE 1 | Demographic and neuropsychological data.

Items                                    HC (n = 34)                       MCI (n = 70)                        AD (n = 40)                   F/χ 2                     P

Demographics
Age (years)                              72.38 ± 0.87                       73.78 ± 0.84                       74.85 ± 1.37                    1.082                0.342b
Education (years)                        16.21 ± 0.48                       15.73 ± 0.34                       15.15 ± 0.45                    1.273                0.283b
Gender (male/female)                        13/21                              42/28                              23/17                        4.614                0.100a
General cognition
MMSE                                     28.76 ± 0.26                       27.61 ± 0.21                       23.25 ± 0.30                    9.653
Sheng et al.                                                                                                                    Brain Structural Network Compensation

    FIGURE 1 | Workflow graphic of gray matter structural networks. The processing of gray matter structural network roughly includes preprocessing (A: spatial
    smoothing), brain parcelation (B), network type (C), graphical models (D), and network reconstruction (E).

number of edges, and average network strength considered as                             are connected when the similarity value of ROIs exceeds the
the sum of all weighted edges for every node, using the Graph                           statistical threshold (P < 0.05, False Discovery Rate, FDR
Theoretical Network Analysis Toolbox (GRETNA6 ) based on                                corrected) determined by the random arrangement method
Brain Connectivity Toolbox (Wang et al., 2015).                                         (Toppi et al., 2012). A brief description of specific definitions,
                                                                                        calculating formula, and topological property descriptions for
Network Parameters and Network Reconstruction                                           the network G with N nodes and V edges follows below (Xu et al.,
Every subject’s gray matter network from gray matter                                    2016; Yang et al., 2020).
segmentations was extracted, using a fully automated method to
implement in MATLAB7 . Briefly, we defined nodes as 3 × 3 × 3                           Global Topological Properties
voxel regions in gray matter through an atlas free approach                             The inverse of the harmonic mean of the shortest path length
(Rimkus et al., 2019). We then defined connectivity using                               between every two nodes in the network is considered as Global
statistical similarity in gray matter structures by Spearman’s                          efficiency. It efficiently measures the information communication
correlations across intensity values of corresponding voxels                            capacity of the whole network. It is calculated as:
between one node and neighbor nodes in the gray matter (Tijms                                                                   1     X 1
et al., 2016). All similarity values were collected in a matrix.                                          Eglobal (G) =
                                                                                                                            N (N − 1)   dij
Nodes connected were ensured that all subjects had a threshold                                                                            i6=j∈G
that they had a similar chance including at most 5% spurious
                                                                                        dij is the shortest path length between node i and j of the network.
connections through a random permutation method (Toppi
                                                                                            Local efficiency of the network measures how efficiently the
et al., 2012). To reduce the number of local tests, the nodal
                                                                                        communication information is among the neighbors of a specific
network characteristics for nodes were averaged in 90 regions of
                                                                                        node when that node is removed, which shows how fault tolerant
interest as defined by the automatic anatomical labeling (AAL)
                                                                                        the network is and is calculated as:
brain atlas (Tzourio-Mazoyer et al., 2002; Jin et al., 2020). The
network metrics were classified as “basic” or “higher-order”                                                             1 X
                                                                                                           Elocal(G) =         Eglobal(Gi)
parameters (Liu et al., 2020). The basic parameters included the                                                         N
                                                                                                                                i∈G
local and global degree and the small-worldness. Higher-order
network parameters consisted of the clustering coefficient,                             Gi is the subgraph consisting of the nearest neighbors of node i.
characteristic path length, degree centrality, and betweenness
centrality (Rubinov and Sporns, 2010). To further explore
                                                                                        Nodal Topological Properties
the topological structure of the network, we calculated the                             Nodal global efficiency quantifies how efficiently the parallel
small-worldness, global efficiency, and local efficiency. To obtain                     information transfers from one node in the network and is
the network edge, we calculated the connectivity referred to                            calculated as:
the statistical similarity between each pair of 90 ROIs, which                                                              1   X 1
                                                                                                       Enodal_global (i) =
is computed by the Spearman’s correlation of the grey matter                                                               N−1        dij
                                                                                                                                           i6=j∈G
intensity values of the corresponding voxels in the ROIs. All
similarity values are arranged in a similarity matrix. ROIs                             dij indicates the shortest path length between node i and
                                                                                        j of the network.
6
    http://www.nitrc.org/projects/gretna/                                                   Nodal local efficiency indicates the efficiency of the
7
    https://github.com/bettytijms/Single_Subject_Grey_Matter_Networks                   communication among the first neighbors of one node when it is

Frontiers in Neuroscience | www.frontiersin.org                                     4                                        February 2021 | Volume 15 | Article 630278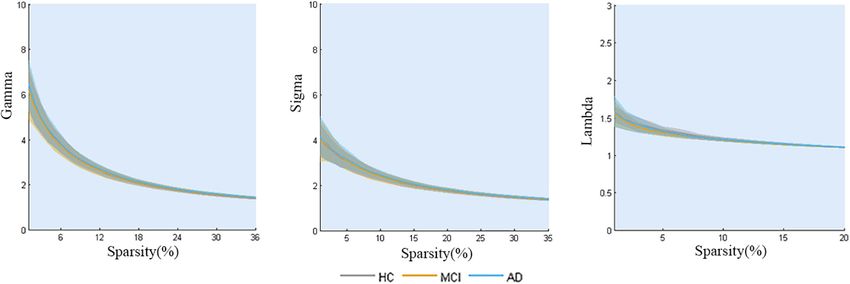
Sheng et al. Brain Structural Network Compensation
removed. It is calculated as: controls (all P < 0.05), including scores on the MMSE, MoCA,
FAQ, CDRSB, ADAS13, and EcogSP.
1 X 1
Enodal_local (i) = We observed a significant reduction in CSF Aβ levels
Ni (Ni − 1) dmn (P < 0.001) and increased CSF t-tau (P = 0.001) and p-tau
m6 =n∈Gi
(P = 0.001) levels with the progression of AD.
Gi is the sub-graph which consists of node i and its
local neighbors.
Global Topology of Gray Matter
Nodal strength is defined as the sum of the edge weights in a
subnetwork Gi , which is the graph that includes the nodes that Structural Networks
are direct neighbors of node i. It can be defined as: The properties of the global network analysis are shown in
Figure 2. No significant differences were calculated among
the three groups in global efficiency or the small-worldness
X
Snodai (i) = wij
j∈Gi (P > 0.05, FDR corrected).
where wij is the edge weight linking node i and j in the Node-Based Analysis of Gray Matter
subnetwork Gi . Structural Networks
The nodal analysis is shown in Figure 3. Abnormal nodal levels
Statistical Analysis (betweenness centrality, degree centrality, and nodal efficiency)
Statistical analyses were performed with the Statistical Package were observed in AD-spectrum patients (P < 0.05, FDR
for the Social Sciences (SPSS, IBM v22). A one-way analysis corrected). In general, gradually increasing nodal properties in
of variance (ANOVA) was performed in the analyses of age, the medial temporal lobe (right parahippocampal gyrus and right
education, and data volume, with significance at P < 0.05 among amygdala) were associated with the progression of AD across the
the control group, the MCI group, and the AD group. The Chi- three groups (from HC to MCI to AD), with the exception of
squared (χ2 ) test was applied in the analysis of gender, among decreased betweenness centrality of the right parahippocampal
the three groups. Because the neuropsychological data was of gyrus in the MCI group.
non-normal distribution, the Kruskal–Wallis test was applied in In the present study, significant relationships between
the analyses of the neuropsychological data with significance at altered nodal (i.e., right parahippocampal gyrus and right
P < 0.05 among the three groups (Zhu et al., 2016). amygdala) properties and multidomain cognitive impairments
At the level of the edge properties of the brain network, were observed in AD-spectrum patients (Table 2; for more
we used the two-sample t test to investigate group differences details, see Supplementary Table 2). In addition, no significant
between any two groups, adjusting for age, sex, and education correlation was calculated between altered nodal properties
years with a false discovery rate (FDR) correction for and CSF biomarkers in HC and MCI patients, and the
multiple comparisons. betweenness centrality in the right parahippocampal gyrus was
One-way analysis of covariance (ANCOVA) was used to negatively correlated with CSF t-tau (r =-0.373, P = 0.03)
explore the group differences in the structural networks (degree (Figure 4A) and p-tau (r = -0.386, P = 0.024) (Figure 4B)
centrality, betweenness centrality, global efficiency, and local concentration in AD patients.
efficiency) while adjusting based on age, sex, and education years.
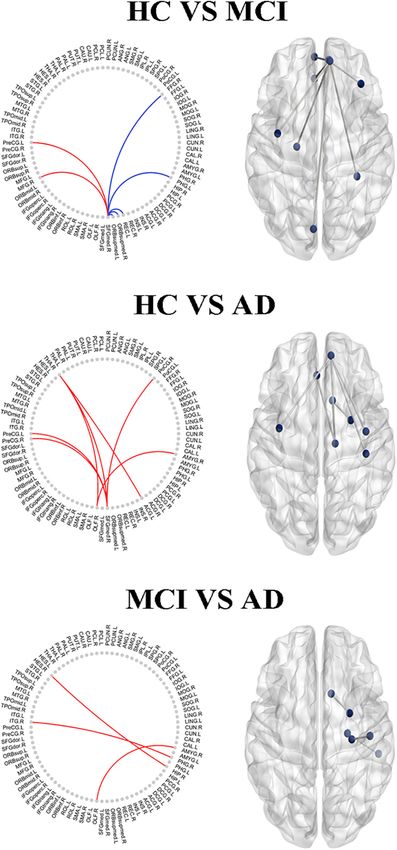
Correction of multiple testing used the FDR. Subsequently, we Connectivity-Based Analysis
conducted a post hoc analysis to investigate the group differences By using correcting for multiple comparisons with FDR
between any pair of all groups. correction, the AD-spectrum patients had significant differences
Additionally, a multiple linear regression analysis was in the structural similarity within the gray matter network
conducted to investigate the relationships among CSF pathology when compared to the controls. In addition to a few edges
indicators, gray matter network graph theoretical properties, and showing decreased structural similarity, most of the others
cognitive function adjusting for age, gender, and education years showed increases with the development of AD. In detail, the
at P < 0.05, uncorrected (Lu et al., 2017; Wang et al., 2020). abnormal connections were mainly related to the frontal lobe in
the MCI group (Figure 5A), but were more widely distributed in
the frontal lobe, thalamus, and subcortical structures in the AD
RESULTS group (Figures 5B,C) (P < 0.05, FDR corrected).
Significant associations between altered edge properties and
Demographic, Neuropsychological, and cognitive impairments were detected in AD-spectrum patients.
CSF Data Interestingly, most of these connections between edges were
The characteristic demographic, neuropsychological and CSF associated with the frontal lobe in both the MCI and AD groups
data of the participants are presented in Table 1. No significant (Table 3, for more details, see Supplementary Tables 3, 4).
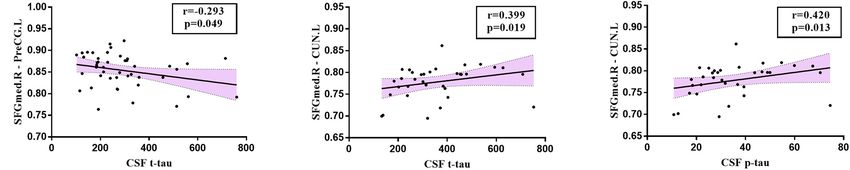
differences among the three groups were observed in age, gender, In addition, the connection between the right medial superior
or education years (P > 0.05). Multiple cognitive functions were frontal gyrus and left precentral gyrus (t-tau: r = -0.293,
more impaired in MCI and AD patients than in the controls, P = 0.049) (Figure 6A) was negatively correlated with the CSF tau
and the largest differences were between AD patients and the concentrations in MCI patients. In the AD group, the connection
Frontiers in Neuroscience | www.frontiersin.org 5 February 2021 | Volume 15 | Article 630278Sheng et al. Brain Structural Network Compensation FIGURE 2 | Global topology of gray matter structural networks in AD-spectrum patients. No significant differences were calculated among the three groups (all P > 0.05, FDR corrected). FIGURE 3 | Between-groups comparisons showed the altered betweenness centrality (A: right parahippocampal gyrus), degree centrality (B: right parahippocampal gyrus; C: right amygdala) and nodal efficiency (D: right parahippocampal gyrus) in AD-spectrum patients. PHG.R, right parahippocampal gyrus; AMYG.R, right amygdala; *P < 0.05, **P < 0.01, ***P < 0.001 indicates a statistical difference between groups by FDR corrected. Frontiers in Neuroscience | www.frontiersin.org 6 February 2021 | Volume 15 | Article 630278
Sheng et al. Brain Structural Network Compensation
TABLE 2 | Significant correlations between altered graph theoretical properties and neuropsychological performance in AD-spectrum patients.
Neuropsychological scale Group Network properties Spearman’s correlation P-values
coefficient
FAQ HC DC of PHG.R 0.352 0.041*
DC of AMYG.R 0.36 0.037*
NE of PHG.R 0.362 0.035*
MCI BC of PHG.R 0.301 0.011*
AD DC of PHG.R 0.334 0.035*
DC of AMYG.R 0.335 0.034*
NE of PHG.R 0.342 0.031*
CDRSB HC BC of PHG.R 0.37 0.031*
DC of PHG.R 0.424 0.012*
DC of AMYG.R 0.388 0.023*
NE of PHG.R 0.433 0.011*
MCI BC of PHG.R 0.295 0.013*
DC of PHG.R 0.343 0.004**
NE of PHG.R 0.286 0.016*
AD DC of PHG.R 0.339 0.032*
NE of PHG.R 0.362 0.022*
ADAS13 AD DC of PHG.R 0.395 0.012*
NE of PHG.R 0.364 0.021*
EcogSP Mem MCI DC of AMYG.R − 0.236 0.049*
EcogSP Lang HC BC of PHG.R 0.392 0.022*
MCI NE of PHG.R 0.248 0.038*
EcogSP Visspat HC BC of PHG.R 0.355 0.039*
DC of PHG.R 0.492 0.003**
NE of PHG.R 0.477 0.004**
MCI DC of AMYG.R − 0.244 0.041*
AD BC of PHG.R 0.334 0.035*
DC of PHG.R 0.462 0.003**
DC of AMYG.R 0.384 0.014*
NE of PHG.R 0.511 0.001**
EcogSP Plan HC BC of PHG.R 0.386 0.024*
DC of PHG.R 0.436 0.01**
NE of PHG.R 0.454 0.007**
MCI BC of PHG.R 0.326 0.006**
AD DC of AMYG.R 0.395 0.012*
NE of PHG.R 0.336 0.034*
EcogSP Organ HC BC of PHG.R 0.464 0.006**
DC of PHG.R 0.484 0.004**
NE of PHG.R 0.494 0.003**
EcogSP Divatt HC BC of PHG.R 0.348 0.044*
DC of PHG.R 0.491 0.003**
NE of PHG.R 0.498 0.003**
AD NE of PHG.R 0.328 0.039*
EcogSP Total HC BC of PHG.R 0.394 0.021*
DC of PHG.R 0.4 0.019*
NE of PHG.R 0.413 0.015*
AD DC of PHG.R 0.407 0.009**
DC of AMYG.R 0.389 0.013*
NE of PHG.R 0.446 0.004**
*P < 0.05, **P < 0.01 indicates an uncorrected relevant analysis.
HC, healthy controls; MCI, mild cognitive impairment; AD, Alzheimer’s disease; BC, Betweenness Centrality; DC, Degree Centrality; NE, Nodal Efficiency; PHG.R,
right parahippocampal gyrus; AMYG.R, right amygdala; MMSE, mini mental state examination; MoCA, Montreal Cognitive Assessment; FAQ, Functional Activities
Questionnaire; CDRSB, Clinical Dementia Rating Sum of Boxes; ADAS13, Alzheimer’s Disease Assessment Scale; EcogSP, Everyday Cognition by the patient’s study;
Mem, Memory; Lang, Language; Visspat, Visuospatial; Plan, Planning; Organ, Organization; Divatt, Divided Attention.
Frontiers in Neuroscience | www.frontiersin.org 7 February 2021 | Volume 15 | Article 630278Sheng et al. Brain Structural Network Compensation
FIGURE 4 | Relationships between altered nodal properties and CSF biomarkers in AD group. The betweenness centrality in the right parahippocampal gyrus was
negatively correlated with CSF t-tau (A: r = -0.373, P = 0.03) and CSF p-tau (B: r = -0.386, P = 0.024) in AD patients. PHG.R, right parahippocampal gyrus.
between the right medial superior frontal gyrus and left cuneus preclinical stages of dementia, which is similar to previous studies
was positively correlated with CSF t-tau (r = 0.399, P = 0.019) (De Vogelaere et al., 2012). Thus, structural network properties
(Figure 6B) and CSF p-tau (r = 0.420, P = 0.013) (Figure 6C). can be a sensitive and reliable index to detect changes in the
evolution of AD.
These findings are in line with previous studies reporting
DISCUSSION altered graph theoretical properties in these regions in AD-
spectrum patients (Shah et al., 2018; Liu et al., 2020). Most of
In the present study, we investigated topological alterations the network graph theoretical properties referring to the frontal
in the structural network within gray matter, the relationships lobe, medial temporal lobe, and subcortical structures–areas that
to pathological biomarkers, and their behavioral significance play a role in perception, executive control, episodic memory, and
in AD-spectrum patients. The three main findings are as understanding–have consistently been found to be affected across
follows: (i) The local regional rearrangements in AD-spectrum the development of AD (Geib et al., 2017; Danti et al., 2018; Luo
patients are mainly in the medial temporal lobe. (ii) The et al., 2018). Furthermore, our study may reflect reorganization
rearrangements in the whole-brain networks gradually extended and high resilience to network integrity damage. Previous
from the frontal lobe to become widely distributed in the studies evaluating graph theoretical properties have described
cortex with the progression of AD. (iii) These rearrangements compensation at the level of hippocampal/parahippocampal
in gray matter might be associated with compensation, which regions and the frontal and occipital lobes (van Duinkerken
was influenced following multidomain cognitive impairments et al., 2016; Li et al., 2018). In line with prior studies,
and AD-related CSF. in our analysis, network integrity was widely increased due
Research interest is transforming to increasingly earlier to the compensation in specific nodes related to cognition.
diagnoses, since the origin of AD and the key to treatment Despite differences in methodologies, compensation has been
probably lie in preventing progression to a fully-fledged disease described in other neurological and psychiatric disorders, such
(Hem et al., 2016; Slot et al., 2018). It should be noted that as schizophrenia (Sapara et al., 2014) and early stages of
compensation in the structural network has been shown to be Parkinson’s disease (Nonnekes et al., 2019). Increased global
manifested earlier in AD-spectrum patients (Liu et al., 2020), connectivity in the frontal lobe, hippocampus, and occipital
and there is increasing interest in the study of structural network areas has been previously reported for mild AD patients (Bai
alterations to assess the progression in subjects who have a et al., 2011; De Vogelaere et al., 2012). Similarly, our study
higher risk of AD (Sanchez-Benavides et al., 2018). Therefore, shows that the compensation appears in the medial temporal
it is essential to evaluate alterations in structural networks lobe at the brain regional level, while it gradually spread
related to cognition and pathology (Dicks et al., 2020). In from the frontal lobe to the widely distributed throughout the
the present study, we deduced that there was the possibility cortex at the whole-brain network level with AD degenerative
of compensation in the structural networks in AD-spectrum processes. However, there is no specific report about the
patients, as expected from previous AD-spectrum studies which potential mechanism revealing the patterns of this compensation
also provided additional evidence for our research results (Wook within structural networks of AD-spectrum patients. In that
Yoo et al., 2015; Caso et al., 2016). Our findings demonstrate sense, our findings present novel evidence of pathophysiological
that brain regional compensation may start from the medial mechanisms in alterations within the gray matter network of
temporal lobe, and the level of compensation within the whole AD-spectrum patients.
gray matter network moved from the frontal lobe to the more In addition, little is known about the pathological basis
extensive cortex as the disease progressed. We confirmed that the of structural network compensation (Jackson et al., 2019).
gray matter network might commence reorganization and show The findings of impaired graph theoretical properties with
high resilience to network integrity damages in the early and reference to the frontal lobe, medial temporal lobe, and
Frontiers in Neuroscience | www.frontiersin.org 8 February 2021 | Volume 15 | Article 630278Sheng et al. Brain Structural Network Compensation FIGURE 5 | The altered edge based on the node analysis in AD-spectrum patients. Edges with significant (P < 0.05, FDR correction) increase (in red) or decrease (in blue) in MCI (A) and AD (B) in patients compared with HC, and MCI group compared with AD (C). Results are shown in anatomical view (left panels) and in connectograms (right panels). subcortical structures involved alterations affecting gray exists with a potential AD pathological basis behind them. matter structures in the present AD spectrum patients, Taken together, our findings and those from structural network which is in line with previous studies reporting increased studies suggest structural brain compensation in response Aβ deposition and pathological tau accumulation in these to brain damage (Wook Yoo et al., 2015; Liu et al., 2020). regions in AD (Buckley et al., 2017). This study demonstrates However, the relationship between structural changes and the compensation related to cognitive impairments, which disease progression remains controversial. Modifications in Frontiers in Neuroscience | www.frontiersin.org 9 February 2021 | Volume 15 | Article 630278
Sheng et al.                                                                                                                   Brain Structural Network Compensation

TABLE 3 | Significant correlations between the altered edge properties and neuropsychological performance in MCI and AD patients.

Neuropsychological scale                      Group                             Edge                                Spearman’s correlation             P-values
                                                                                                                         coefficient

MMSE                                              MCI                    SFGmed.R – MFG.R                                     0.356                            0.002**
                                                                     SFGmed.R – ORBsupmed.L                                 − 0.277                            0.02*
                                                  AD                    SFGmed.R – PreCG.R                                  − 0.396                            0.011*
MoCA                                              AD                    SFGmed.R – PreCG.R                                  − 0.35                             0.027*
                                                                        SFGmed.R – PoCG.R                                   − 0.395                            0.012*
                                                                           ACG.L – THA.R                                    − 0.349                            0.027*
FAQ                                               AD                    SFGmed.R – PreCG.R                                    0.385                            0.014*
CDRSB                                             AD                    SFGmed.R – PoCG.R                                     0.315                            0.048*
ADAS13                                            AD                       ACG.L – THA.R                                      0.354                            0.025*
EcogSP Lang                                       AD                 SFGmed.R – ORBsupmed.R                                   0.319                            0.045*
EcogSP Plan                                       MCI                    SFGmed.R – FFG.R                                     0.308                            0.009**

*P
Sheng et al. Brain Structural Network Compensation
spectrum patients and highlight the potential for applying this project was in part funded by the Alzheimer’s Disease
structural network metrics to monitor disease progression. Neuroimaging Initiative (ADNI) (National Institutes of Health
Grant U01 AG024904) and DOD ADNI (Department of
Defense award number W81XWH-12-2-0012). ADNI is funded
DATA AVAILABILITY STATEMENT by the National Institute on Aging, the National Institute
of Biomedical Imaging and Bioengineering, and through
The raw data supporting the conclusions of this article will be generous contributions from the following: AbbVie, Alzheimer’s
made available by the authors, without undue reservation. Association; Alzheimer’s Drug Discovery Foundation; Araclon
Biotech; BioClinica, Inc.; Biogen; BristolMyers Squibb Company;
CereSpir, Inc.; Cogstate; Eisai Inc.; Elan Pharmaceuticals, Inc.; Eli
ETHICS STATEMENT Lilly and Company; EuroImmun; F. Hoffmann-La Roche Ltd and
its affiliated company Genentech, Inc.; Fujirebio; GE Healthcare;
The studies involving human participants were reviewed,
IXICO Ltd.; Janssen Alzheimer Immunotherapy Research &
approved by the ADNI database (http://adni.loni.usc.edu) as well
Development, LLC; Johnson & Johnson Pharmaceutical Research
as the written informed consents from the patients/participant.
& Development LLC; Lumosity; Lundbeck; Merck & Co., Inc.;
Meso Scale Diagnostics, LLC; NeuroRx Research; Neurotrack
AUTHOR CONTRIBUTIONS Technologies; Novartis Pharmaceuticals Corporation; Pfizer Inc.;
Piramal Imaging; Servier; Takeda Pharmaceutical Company;
FB, HZ, and YX designed the study and edited the manuscript. and Transition Therapeutics. The Canadian Institutes of Health
XS and HC analyzed the data and wrote the manuscript. HC, Research is providing funds to support ADNI clinical sites
RQ, and PS validated the statistics. ADNI collected the data. in Canada. Private sector contributions are facilitated by the
All the authors contributed to the article and approved the Foundation for the National Institutes of Health (www.fnih.org).
submitted version. The grantee organization is the Northern California Institute
for Research and Education, and the study is coordinated
by the Alzheimer’s Therapeutic Research Institute at the
FUNDING University of Southern California. ADNI data are disseminated
by the Laboratory for Neuro Imaging at the University of
This work was supported partly by grants from the National Southern California.
Natural Science Foundation of China (Nos. 81822013 and
82071186), Jiangsu Provincial Key Medical Talents (No.
ZDRCA2016085), the Key Research and Development SUPPLEMENTARY MATERIAL
Program of Jiangsu Province of China (BE2016610), the
National Key Research and Development Program of China The Supplementary Material for this article can be found
(2016YFC1300500–504), and Jiangsu Province Key Medical online at: https://www.frontiersin.org/articles/10.3389/fnins.
Discipline (ZDXKA2016020). Data collection and sharing for 2021.630278/full#supplementary-material
REFERENCES burden. JAMA Neurol. 74, 1455–1463. doi: 10.1001/jamaneurol.2017.
2216
Ahmed, R. M., Landin-Romero, R., Liang, C. T., Keogh, J. M., Henning, E., Caso, F., Agosta, F., and Filippi, M. (2016). Insights into white matter damage in
Strikwerda-Brown, C., et al. (2019). Neural networks associated with body Alzheimer’s Disease: from postmortem to in vivo diffusion tensor MRI studies.
composition in frontotemporal dementia. Ann. Clin. Transl. Neurol. 6, 1707– Neurodegener. Dis. 16, 26–33. doi: 10.1159/000441422
1717. doi: 10.1002/acn3.50869 Chen, H., Sheng, X., Luo, C., Qin, R., Ye, Q., Zhao, H., et al. (2020).
Bai, F., Liao, W., Watson, D. R., Shi, Y., Wang, Y., Yue, C., et al. (2011). The compensatory phenomenon of the functional connectome related to
Abnormal whole-brain functional connection in amnestic mild cognitive pathological biomarkers in individuals with subjective cognitive decline. Transl.
impairment patients. Behav. Brain Res. 216, 666–672. doi: 10.1016/j.bbr.2010. Neurodegener. 9:21.
09.010 Danti, S., Handjaras, G., Cecchetti, L., Beuzeron-Mangina, H., Pietrini, P., and
Batalle, D., Muñoz-Moreno, E., Figueras, F., Bargallo, N., Eixarch, E., and Gratacos, Ricciardi, E. (2018). Different levels of visual perceptual skills are associated
E. (2013). Normalization of similarity-based individual brain networks from with specific modifications in functional connectivity and global efficiency. Int.
gray matter MRI and its association with neurodevelopment in infants with J. Psychophysiol. 123, 127–135. doi: 10.1016/j.ijpsycho.2017.10.002
intrauterine growth restriction. Neuroimage 83, 901–911. doi: 10.1016/j. De Vogelaere, F., Santens, P., Achten, E., Boon, P., and Vingerhoets, G.
neuroimage.2013.07.045 (2012). Altered default-mode network activation in mild cognitive impairment
Beheshti, I., Maikusa, N., Matsuda, H., Demirel, H., and Anbarjafari, G. (2017). compared with healthy aging. Neuroradiology 54, 1195–1206. doi: 10.1007/
Histogram-based feature extraction from individual gray matter similarity- s00234-012-1036-6
matrix for Alzheimer’s Disease classification. J. Alzheimers Dis. 55, 1571–1582. Dicks, E., van der Flier, W. M., Scheltens, P., Barkhof, F., Tijms, B. M.,
doi: 10.3233/jad-160850 and Alzheimer’s Disease Neuroimaging Initiative (2020). Single-subject gray
Buckley, R. F., Hanseeuw, B., Schultz, A. P., Vannini, P., Aghjayan, S. L., matter networks predict future cortical atrophy in preclinical Alzheimer’s
Properzi, M. J., et al. (2017). Region-specific association of subjective disease. Neurobiol. Aging 94, 71–80. doi: 10.1016/j.neurobiolaging.2020.
cognitive decline with tauopathy independent of global beta-amyloid 05.008
Frontiers in Neuroscience | www.frontiersin.org 11 February 2021 | Volume 15 | Article 630278Sheng et al. Brain Structural Network Compensation
Geib, B. R., Stanley, M. L., Wing, E. A., Laurienti, P. J., and Cabeza, R. (2017). Sapara, A., Ffytche, D. H., Birchwood, M., Cooke, M. A., Fannon, D.,
Hippocampal contributions to the large-scale episodic memory network predict Williams, S. C., et al. (2014). Preservation and compensation: the functional
vivid visual memories. Cereb. Cortex 27, 680–693. doi: 10.1093/cercor/ neuroanatomy of insight and working memory in schizophrenia. Schizophr.
bhv272 Res. 152, 201–209. doi: 10.1016/j.schres.2013.11.026
Hem, S., Albite, R., Loresi, M., Rasmussen, J., Ajler, P., Yampolsky, C., et al. Shah, P., Bassett, D. S., Wisse, L. E. M., Detre, J. A., Stein, J. M.,
(2016). Pathological changes of the hippocampus and cognitive dysfunction Yushkevich, P. A., et al. (2018). Mapping the structural and
following frontal lobe surgery in a rat model. Acta Neurochir. 158, 2163–2171. functional network architecture of the medial temporal lobe using
doi: 10.1007/s00701-016-2938-6 7T MRI. Hum. Brain Mapp. 39, 851–865. doi: 10.1002/hbm.
Jackson, J., Jambrina, E., Li, J., Marston, H., Menzies, F., Phillips, K., et al. (2019). 23887
Targeting the synapse in Alzheimer’s Disease. Front. Neurosci. 13:735. doi: 10. Slot, R. E. R., Verfaillie, S. C. J., Overbeek, J. M., Timmers, T., Wesselman,
3389/fnins.2019.00735 L. M. P., Teunissen, C. E., et al. (2018). Subjective cognitive impairment cohort
Jin, M., Wang, L., Wang, H., Han, X., Diao, Z., Guo, W., et al. (2020). Altered (SCIENCe): study design and first results. Alzheimers Res. Ther. 10:76.
resting-state functional networks in patients with hemodialysis: a graph- Tijms, B. M., Kate, M. T., Wink, A. M., Visser, P. J., Ecay, M., Clerigue, M.,
theoretical based study. Brain Imaging Behav. [Epub ahead of print]. doi: 10. et al. (2016). Gray matter network disruptions and amyloid beta in cognitively
1007/11682-020-00293-8 normal adults. Neurobiol. Aging 37, 154–160. doi: 10.1016/j.neurobiolaging.
Kim, G. W., Kim, B. C., Park, K. S., and Jeong, G. W. (2020). A pilot study of brain 2015.10.015
morphometry following donepezil treatment in mild cognitive impairment: Toppi, J., De Vico Fallani, F., Vecchiato, G., Maglione, A. G., Cincotti, F., Mattia,
volume changes of cortical/subcortical regions and hippocampal subfields. Sci. D., et al. (2012). How the statistical validation of functional connectivity
Rep. 10:10912. patterns can prevent erroneous definition of small-world properties of a brain
Lane, C. A., Barnes, J., Nicholas, J. M., Sudre, C. H., Cash, D. M., Parker, T. D., connectivity network. Comput. Math Methods Med. 2012:130985.
et al. (2019). Associations between blood pressure across adulthood and late-life Tzourio-Mazoyer, N., Landeau, B., Papathanassiou, D., Crivello, F., Etard, O.,
brain structure and pathology in the neuroscience substudy of the 1946 British Delcroix, N., et al. (2002). Automated anatomical labeling of activations in SPM
birth cohort (Insight 46): an epidemiological study. Lancet Neurol. 18, 942–952. using a macroscopic anatomical parcellation of the MNI MRI single-subject
doi: 10.1016/s1474-4422(19)30228-5 brain. Neuroimage 15, 273–289. doi: 10.1006/nimg.2001.0978
Li, W., Yang, C., Wu, S., Nie, Y., Zhang, X., Lu, M., et al. (2018). Alterations van der Lee, S. J., Wolters, F. J., Ikram, M. K., Hofman, A., Ikram, M. A., Amin,
of graphic properties and related cognitive functioning changes in mild N., et al. (2018). The effect of APOE and other common genetic variants on the
Alzheimer’s Disease revealed by individual morphological brain network. Front. onset of Alzheimer’s disease and dementia: a community-based cohort study.
Neurosci. 12:927. doi: 10.3389/fnins.2018.00927 Lancet Neurolo. 17, 434–444. doi: 10.1016/s1474-4422(18)30053-x
Lin, X., Chen, Y., Wang, M., Song, C., Lin, B., Yuan, X., et al. (2020). Altered van Duinkerken, E., Ijzerman, R. G., Klein, M., Moll, A. C., Snoek, F. J., Scheltens,
topological patterns of gray matter networks in tinnitus: a graph-theoretical- P., et al. (2016). Disrupted subject-specific gray matter network properties
based study. Front. Neurosci. 14:541. doi: 10.3389/fnins.2020.00541 and cognitive dysfunction in type 1 diabetes patients with and without
Liu, H., Hu, H., Wang, H., Han, J., Li, Y., Qi, H., et al. (2020). A brain network proliferative retinopathy. Hum. Brain Mapp. 37, 1194–1208. doi: 10.1002/hbm.
constructed on an L1-norm regression model is more sensitive in detecting 23096
small world network changes in early AD. Neural Plast. 2020:9436406. Verfaillie, S. C. J., Slot, R. E. R., Dicks, E., Prins, N. D., Overbeek, J. M., Teunissen,
Llufriu, S., Martinez-Heras, E., Solana, E., Sola-Valls, N., Sepulveda, M., Blanco, Y., C. E., et al. (2018). A more randomly organized grey matter network is
et al. (2017). Structural networks involved in attention and executive functions associated with deteriorating language and global cognition in individuals with
in multiple sclerosis. Neuroimage Clin. 13, 288–296. doi: 10.1016/j.nicl.2016.11. subjective cognitive decline. Hum. Brain Mapp. 39, 3143–3151. doi: 10.1002/
026 hbm.24065
Lu, F. M., Liu, C. H., Lu, S. L., Tang, L. R., Tie, C. L., Zhang, J., et al. Vipin, A., Foo, H. J. L., Lim, J. K. W., Chander, R. J., Yong, T. T., Ng, A. S. L., et al.
(2017). Disrupted topology of frontostriatal circuits is linked to the severity of (2018). Regional white matter hyperintensity influences grey matter atrophy in
insomnia. Front. Neurosci. 11:214. doi: 10.3389/fnins.2017.00214 mild cognitive impairment. J. Alzheimers Dis. 66, 533–549. doi: 10.3233/jad-
Lu, J., Testa, N., Jordan, R., Elyan, R., Kanekar, S., Wang, J., et al. (2019). Functional 180280
connectivity between the resting-state olfactory network and the hippocampus Wang, H., Jin, X., Zhang, Y., and Wang, J. (2016). Single-subject morphological
in Alzheimer’s Disease. Brain Sci. 9:338. doi: 10.3390/brainsci9120338 brain networks: connectivity mapping, topological characterization and test-
Luo, C., Li, M., Qin, R., Chen, H., Yang, D., Huang, L., et al. (2019). White matter retest reliability. Brain Behav. 6:e00448.
microstructural damage as an early sign of subjective cognitive decline. Front. Wang, J., Khosrowabadi, R., Ng, K. K., Hong, Z., Chong, J. S. X., Wang, Y.,
Aging Neurosci. 11:378. doi: 10.3389/fnagi.2019.00378 et al. (2018). Alterations in brain network topology and structural-functional
Luo, Y., Schulz, K. P., Alvarez, T. L., Halperin, J. M., and Li, X. (2018). Distinct connectome coupling relate to cognitive impairment. Front. Aging Neurosci.
topological properties of cue-evoked attention processing network in persisters 10:404. doi: 10.3389/fnagi.2018.00404
and remitters of childhood ADHD. Cortex 109, 234–244. doi: 10.1016/j.cortex. Wang, J., Wang, X., Xia, M., Liao, X., Evans, A., and He, Y. (2015).
2018.09.013 GRETNA: a graph theoretical network analysis toolbox for imaging
Nonnekes, J., Ruzicka, E., Nieuwboer, A., Hallett, M., Fasano, A., and Bloem, B. R. connectomics. Front. Hum. Neurosci. 9:386. doi: 10.3389/fnhum.2015.
(2019). Compensation strategies for gait impairments in parkinson disease: a 00386
review. JAMA Neurol. 76, 718–725. doi: 10.1001/jamaneurol.2019.0033 Wang, J., Zhang, Y., Zhu, D., Yang, Z., Liu, F., Qin, W., et al. (2020). A common
Patnode, C. D., Perdue, L. A., Rossom, R. C., Rushkin, M. C., Redmond, N., variant in OXTR rs53576 impacts topological patterns of brain functional
Thomas, R. G., et al. (2020). Screening for cognitive impairment in older adults: networks. Eur. Child Adolesc. Psychiatry 29, 993–1002. doi: 10.1007/s00787-
updated evidence report and systematic review for the US preventive services 019-01414-5
task force. JAMA 323, 764–785. doi: 10.1001/jama.2019.22258 Wook Yoo, S., Han, C. E., Shin, J. S., Won Seo, S., Na, D. L., Kaiser, M., et al.
Rimkus, C. M., Schoonheim, M. M., Steenwijk, M. D., Vrenken, H., Eijlers, A. J., (2015). A network flow-based analysis of cognitive reserve in normal ageing
Killestein, J., et al. (2019). Gray matter networks and cognitive impairment in and Alzheimer’s Disease. Sci. Rep. 5:10057.
multiple sclerosis. Mult. Scler. 25, 382–391. doi: 10.1177/1352458517751650 Xu, T., Cullen, K. R., Mueller, B., Schreiner, M. W., Lim, K. O., Schulz, S. C.,
Rubinov, M., and Sporns, O. (2010). Complex network measures of brain et al. (2016). Network analysis of functional brain connectivity in borderline
connectivity: uses and interpretations. Neuroimage 52, 1059–1069. doi: 10. personality disorder using resting-state fMRI. Neuroimage Clin. 11, 302–315.
1016/j.neuroimage.2009.10.003 doi: 10.1016/j.nicl.2016.02.006
Sanchez-Benavides, G., Grau-Rivera, O., Suarez-Calvet, M., Minguillon, C., Yang, D., Huang, L., Luo, C., Li, M., Qin, R., Ma, J., et al. (2020).
Cacciaglia, R., Gramunt, N., et al. (2018). Brain and cognitive correlates Impaired structural network properties caused by white matter hyperintensity
of subjective cognitive decline-plus features in a population-based cohort. related to cognitive decline. Front. Neurol. 11:250. doi: 10.3389/fneur.2020.
Alzheimers Res. Ther, 10:123. 00250
Frontiers in Neuroscience | www.frontiersin.org 12 February 2021 | Volume 15 | Article 630278Sheng et al. Brain Structural Network Compensation Zhang, H., Therriault, J., Kang, M. S., Ng, K. P., Pascoal, T. A., Rosa-Neto, P., et al. Conflict of Interest: The authors declare that the research was conducted in the (2018). Cerebrospinal fluid synaptosomal-associated protein 25 is a key player absence of any commercial or financial relationships that could be construed as a in synaptic degeneration in mild cognitive impairment and Alzheimer’s disease. potential conflict of interest. Alzheimer’s Res. Ther. 10:80. Zhao, C., Jiang, J., Xu, Z., and Guan, Y. (2017). A study of EMR- Copyright © 2021 Sheng, Chen, Shao, Qin, Zhao, Xu, Bai and Alzheimer’s Disease based medical knowledge network and its applications. Comput. Neuroimaging Initiative. This is an open-access article distributed under the terms Methods Programs Biomed. 143, 13–23. doi: 10.1016/j.cmpb.2017. of the Creative Commons Attribution License (CC BY). The use, distribution or 02.016 reproduction in other forums is permitted, provided the original author(s) and the Zhu, J., Zhuo, C., Liu, F., Qin, W., Xu, L., and Yu, C. (2016). Distinct disruptions of copyright owner(s) are credited and that the original publication in this journal resting-state functional brain networks in familial and sporadic schizophrenia. is cited, in accordance with accepted academic practice. No use, distribution or Sci. Rep. 6:23577. reproduction is permitted which does not comply with these terms. Frontiers in Neuroscience | www.frontiersin.org 13 February 2021 | Volume 15 | Article 630278
You can also read