Brief communication: Increased glacier mass loss in the Russian High Arctic (2010-2017)
←
→
Page content transcription
If your browser does not render page correctly, please read the page content below
The Cryosphere, 16, 35–42, 2022
https://doi.org/10.5194/tc-16-35-2022
© Author(s) 2022. This work is distributed under
the Creative Commons Attribution 4.0 License.

Brief communication: Increased glacier mass loss in the Russian
High Arctic (2010–2017)
Christian Sommer1 , Thorsten Seehaus1 , Andrey Glazovsky2 , and Matthias H. Braun1
1 Institut   für Geographie, Friedrich-Alexander-Universität Erlangen-Nürnberg, 91058 Erlangen, Germany
2 Institute   of Geography, Russian Academy of Sciences, Moscow, 119017, Russia

Correspondence: Christian Sommer (chris.sommer@fau.de)

Received: 10 December 2020 – Discussion started: 28 December 2020
Revised: 8 November 2021 – Accepted: 10 November 2021 – Published: 6 January 2022

Abstract. Glaciers in the Russian High Arctic have been           tainties in the gravimetric approach might arise from the scat-
subject to extensive atmospheric warming due to global cli-       tered ice caps and various corrections related to surround-
mate change, yet their contribution to sea level rise has been    ing oceans, surface hydrology, and glacial isostatic adjust-
relatively small over the past decades. Here we show sur-         ment (GIA). In this study we have measured surface ele-
face elevation change measurements and geodetic mass bal-         vation changes in most Russian Arctic glaciers from digital
ances of 93 % of all glacierized areas of Novaya Zemlya,          elevation models (DEMs) to derive geodetic mass changes
Severnaya Zemlya, and Franz Josef Land using interfero-           between 2010 and 2017. We use synthetic aperture radar
metric synthetic aperture radar measurements taken between        (SAR) DEMs of the TanDEM-X satellites, which are inde-
2010 and 2017. We calculate an overall mass loss rate of          pendent from cloud cover and provide a high spatial resolu-
−22±6 Gt a−1 , corresponding to a sea level rise contribution     tion. However, the SAR-data-derived elevation change rate
of 0.06 ± 0.02 mm a−1 . Compared to measurements prior to         can be biased by differences in signal penetration depth into
2010, mass loss of glaciers on the Russian archipelagos has       the glacier surface between DEM acquisitions of different
doubled in recent years.                                          seasons. The depth of signal penetration is related to the pre-
                                                                  vailing glacier surface conditions at the acquisition time. In
                                                                  general, SAR penetration is close to zero for melting snow
                                                                  surfaces and bare glacier ice and increases in dry snow. X-
1   Introduction                                                  band penetration depths of several meters have been ob-
                                                                  served in different regions (e.g., Millan et al., 2015; Zhao and
The Arctic has undergone large environmental changes due          Floricioiu, 2017; Abdullahi et al., 2018; Li et al., 2021). Pre-
to polar climate change (Box et al., 2019). An increase in        viously, penetration depths have been estimated by a num-
glacier mass loss has been observed in many polar regions         ber of studies (e.g., Abdullahi et al., 2018, 2019; Li et al.,
(Morris et al., 2020; Zheng et al., 2018; Ciracì et al., 2020).   2021) using backscatter intensity. SAR backscatter intensity
The Russian High Arctic, including the archipelagos Novaya        depends on physical properties of the glacier ice, such as
Zemlya, Severnaya Zemlya, and Franz Josef Land, is one of         grain size and density, roughness and water content (Wes-
these regions. Despite a glacierized area of ∼ 52 000 km2 ,       sel et al., 2016), and changes between melting and frozen
in situ observations of glacier mass change are sparse. Pre-      conditions. Thus, we apply a regional correction for relative
vious region-wide assessments were mostly limited to the          differences in SAR penetration based on backscatter inten-
early 21st century and based on gravimetry (Gardner et al.,       sity to account for different TanDEM-X acquisition periods
2013; Jacob et al., 2012; Matsuo and Heki, 2013; Wouters et       of the Novaya Zemlya ice cap.
al., 2019) and altimetry (Ciracì et al., 2018; Moholdt et al.,
2012). Most of these studies show mass change rates ranging
from −5 to −10 Gt a−1 . However, both methods have limi-
tations: altimetry requires spatial interpolation, while uncer-

Published by Copernicus Publications on behalf of the European Geosciences Union.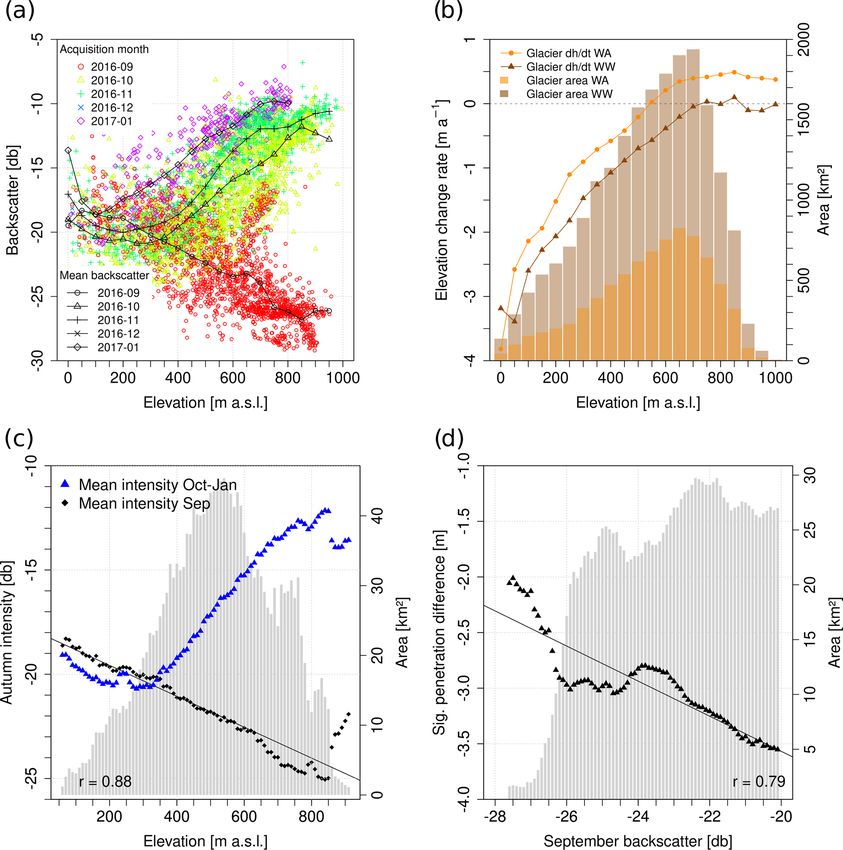
36                                     C. Sommer et al.: Increased glacier mass loss in the Russian High Arctic (2010–2017)

Figure 1. (a) Backscatter intensity of different TanDEM-X DEM acquisition months versus elevation on Novaya Zemlya. Black lines indicate
average backscatter aggregated within 50 m elevation bins. Point icons illustrate a random subset (5000 cells) of the 2016/17 DEM mosaic
of Novaya Zemlya. In December 2016 (blue crosses), only a small glacier area at the northeastern coast was acquired. (b) Mean elevation
change rates of DEM differences between winter 2010/11 and winter 2016/17 (WW; triangles) and winter 2010/11 and September 2016
(WA; dots) of all respective glacier areas. (c) Altitudinal distribution of mean backscatter intensity (aggregated in 10 m elevation bins) of
September and winter 2016/17 SAR data on overlapping glacier areas (i.e., areas which were acquired in September and winter 2016/17).
(d) Differences in estimated signal penetration between September and winter 2016/17 (Sect. S3.1) versus mean backscatter intensity of
September 2016 acquisitions on overlapping glacier areas (aggregated within 0.1 dB backscatter intervals between −20 and −28 dB). The
linear correlations of mean September backscatter intensity and elevation (c) and mean difference in signal penetration depth and September
backscatter intensity (d) are indicated as black solid lines.

2     Data and methods                                                   Center and Airbus Defence and Space. The TanDEM-X
                                                                         DEMs provide an almost complete coverage of the Russian
2.1    SAR data and penetration depth estimation                         Arctic archipelagos but can suffer from differences in SAR
                                                                         signal penetration depth into the glacier volume. When sub-
Interferometric SAR DEMs are acquired by the bistatic                    tracting elevations of SAR DEMs from different seasons,
TerraSAR-X add-on for the digital elevation measurement                  the depth of signal penetration might differ between acqui-
mission (TanDEM-X), operated by the German Aerospace                     sitions due to changing surface conditions and bias the ele-

The Cryosphere, 16, 35–42, 2022                                                                  https://doi.org/10.5194/tc-16-35-2022
C. Sommer et al.: Increased glacier mass loss in the Russian High Arctic (2010–2017) 37
vation change rate. The TanDEM-X data over most of our SAR (∼ 7800 km2 ; Fig. S2a). Eventually, the estimated sur-
study area were acquired during winter 2010/11 (94 % of face penetration lengths are converted back to vertical dif-
total glacier area) and winter 2016/17 (83 %) at tempera- ferences in elevation by rearranging the respective equations
tures well below 0 ◦ C and frozen ice surfaces. It is likely that (Sect. S3.1 and S3.2). The predicted vertical correction val-
for those acquisitions the difference in X-band penetration ues (Fig. S2b) are then added to the September 2016 eleva-
depth is small as the SAR data were acquired in the same tions, and the corrected elevation change rate is calculated.
season, and the presence of surface melt or liquid water is We did not adjust for differences in incidence angle or effec-
very unlikely in the Arctic winter months. However, for some tive baseline because the viewing geometries of the majority
glacier areas of Novaya Zemlya (35 %) and Franz Josef Land of the used SAR acquisitions are rather similar (Table S2).
(6 %), SAR data from September 2016 had to be included For 99 % of the glacierized area of Novaya Zemlya, the dif-
to calculate elevation changes because there were no winter ference in incidence angles is not larger than 2◦ (39.3–41.3◦ ),
scenes available. Using those DEMs without further correc- while for 93 % of the area the average baseline is 91.9 m
tion can bias the measured surface elevation change as sea- (87.8–95.4 m).
sonal changes in snow and ice properties of the glacier sur- For Franz Josef Land and Severnaya Zemlya, the eleva-
face have significant impacts on the SAR penetration depth tion change rate is not corrected as on both archipelagos the
(Abdullahi et al., 2019). Figure 1a shows the hypsometric temporal offset between DEM acquisitions is much smaller
backscatter distribution of TanDEM-X acquisitions between than on Novaya Zemlya. Average backscatter intensity is rel-
September 2016 and January 2017 on Novaya Zemlya. While atively homogeneous for all 2016/17 acquisitions on Sever-
average backscatter intensity of the October–January acqui- naya Zemlya (Fig. S1c), while on Franz Josef Land only a
sitions shows similar patterns, a clear difference is observed very small fraction of September TanDEM-X acquisitions
for the September DEMs. At altitudes above ∼ 400 m a.s.l., (6 %) show significant differences in backscatter intensity
the September data show much lower backscatter values than (Fig. S1a). Therefore, transferring the empirical relationship
the respective winter scenes, indicating different surface con- between differences in surface penetration and September
ditions at the acquisition times. To estimate the difference backscatter intensities on Novaya Zemlya to those archipela-
in penetration depth between the September 2016 and win- gos would rather increase the uncertainty in the elevation
ter 2016/17 DEMs, we derive the measured elevation differ- change measurement.
ence and respective backscatter intensity from overlapping
glacier areas which were covered by the September as well 2.2 Glacier elevation and geodetic mass change
as winter acquisitions. Those reference areas cover a total calculation
glacier area of ∼ 2500 km2 and are equally distributed across
the Novaya Zemlya ice cap (Fig. S2a). The measured abso- Glacier elevation change rates are calculated by differenc-
lute vertical offsets of those glacier areas 1hW −A (Fig. S2c) ing TanDEM-X DEMs of different acquisitions. For the
are then converted to penetration lengths into the glacier vol- Russian Arctic, TanDEM-X acquisitions of winter 2010/11
ume lp (Sect. S3.1 and S3.2 in the Supplement). (December–February, April) and autumn/winter 2016/17
Thereafter, lp is aggregated and compared to altitude (September–February) are available. Elevation models are
and backscatter intensity of the September acquisitions, derived from TanDEM-X co-registered single-look slant
respectively. As shown in Fig. 1c and d, the offset be- range complex (CoSSC) data, closely following the work-
tween the September and winter 2016/17 backscatter in- flow of Braun et al. (2019) and Seehaus et al. (2019). A
tensity increases above elevations of ∼ 400 m a.s.l., while detailed description of the interferometric DEM generation,
the difference in estimated signal penetration increases with co-registration, and uncertainty assessment is provided in
higher backscatter intensities of the September acquisitions. the Supplement. Eventually, the co-registered TanDEM-X
Based on this relationship between penetration difference, DEMs are merged to create two elevation mosaics of win-
backscatter intensity, and altitude, a linear regression model ter 2010/11 and 2016/17 and differenced to derive glacier
can be created to estimate the length of penetration lp (Eq. 1): elevation and volume change rates based on glacier areas of
the Randolph Glacier Inventory (Pfeffer et al., 2014). Glacier
lp = β0 + β1 × Int. (1) volume changes are converted to mass change using two den-
sity scenarios. For (a) a conversion factor of 850±60 kg m−3
“Int” is the backscatter intensity in decibels, and β0 and β1 (Huss, 2013) is applied, and for (b) 900 ± 60 kg m−3 is ap-
are the regression coefficients. To fit lp and Int, the differ- plied as an approximation of the density of ice. For No-
ence between the September and winter TanDEM-X acquisi- vaya Zemlya, the geodetic mass change rate (1M/1t)
tions and backscatter intensity of all overlapping DEM pixels is calculated using the uncorrected elevation change rate
is used. To predict the bias in surface penetration between (1h/1tuncorr. ), as derived from the DEM differencing, as
the September and winter acquisitions 2016/17, the model well as the surface-penetration-corrected elevation change
is then applied to all glacier areas above 400 m a.s.l. on No- (1h/1tcorr. ). Additionally, glacier elevation changes are de-
vaya Zemlya, which were only covered by September 2016 rived specifically for marine- and land-terminating glaciers
https://doi.org/10.5194/tc-16-35-2022 The Cryosphere, 16, 35–42, 202238 C. Sommer et al.: Increased glacier mass loss in the Russian High Arctic (2010–2017)
(Fig. S3) following the glacier terminus classification of the caused by glaciers on Novaya Zemlya, while mass changes
Randolph Glacier Inventory. of Severnaya Zemlya and Franz Josef Land account for about
a quarter each. Table 1 summarizes the uncorrected and cor-
rected change rates for the Russian Arctic.
3 Results
For the DEM acquisitions of 2016/17 on Novaya Zemlya, 4 Discussion
a distinct difference in backscatter intensity is visible be-
tween SAR data acquired in September 2016 and October– Differences in the SAR-derived elevation change rates
January 2016/17 (Fig. 1a). The average vertical difference (Fig. 1b) can be related to either surface penetration of the
in surface elevation on the respective overlapping glacier ar- X-band radar or physical changes in the surface height due
eas (Fig. S2a) is 2.13 m. Also, the elevation change rates de- to accumulation or ablation of snow and ice. The TanDEM-X
rived from all glacier areas which were acquired in Septem- DEM difference on Novaya Zemlya does not fully cover the
ber 2016 (Fig. 1b) show an average difference in surface accumulation period of the last year of the observation period
lowering of 0.4 m a−1 compared to areas acquired in win- as the acquisitions of September 2016 do not or only partially
ter 2016/17. Furthermore, the elevation change rate of the capture the amount of winter accumulation from October to
period winter 2010/11 to winter 2016/17 is consistently more December. This potential bias in measured winter accumula-
negative at all altitudes, while the change rate between win- tion would lead to an overestimation of surface elevation loss
ter 2010/11 and September 2016 indicates elevation gains at between winter 2010/11 and September 2016. However, the
the highest glacierized altitudes. The analyzed vertical eleva- analysis of surface elevation changes derived from Septem-
tion differences in the overlapping glacier areas (Fig. S2a) ber and winter DEMs indicate that the surface measured by
and the respective backscatter intensity of the September TanDEM-X in winter 2016/17 was below the surface heights
datasets (Fig. 1a) indicate altitudinal differences in signal acquired in September 2016. As the occurrence of major sur-
penetration depth between the September and winter SAR face melt within the Arctic winter months is unlikely, the ob-
data. served elevation offset is most likely related to differences in
When transferred to all areas on Novaya Zemlya, the the relative depth of signal penetration of the X-band SAR.
glacier surface acquired by TanDEM-X in September 2016 The analysis of backscatter intensities of different acquisition
was approximately 2.3 m higher than the surface elevations months (Fig. 1a) indicates a change in glacier surface proper-
measured during the winter months 2016/17. The uncor- ties between the acquisitions from September 2016 and win-
rected glacier mass change rate of Novaya Zemlya is there- ter 2016/17. The observed differences in backscatter could be
fore ∼ 20 % lower than the corrected mass change because related to either the occurrence of melt or presence of fresh
the elevation changes derived from DEM acquisitions of snow at the glacier surface, which would decrease the depth
September 2016 are consistently less negative than those of signal penetration as the amount of penetration depends
from the winter months. on the condition of the glacier surface and is close to zero for
Glacier surface elevation changes of the Russian Arc- melting snow surfaces and bare glacier ice. The majority of
tic archipelagos are shown in Fig. 2. High thinning rates SAR data of the 2016/17 time step were acquired at months
are measured at elevations below 600 m a.s.l., while surface with temperatures well below 0 ◦ C, while average tempera-
change rates in the upper accumulation areas are close to zero tures on Novaya Zemlya in September 2016 were close to the
or slightly positive. Average elevation change rates are high- melting point (Fig. S1f). Thus, the differences in backscat-
est on Novaya Zemlya (1h/1tcorr. = −0.64 ± 0.46 m a−1 ), ter intensity could be caused by either accumulation of fresh
mostly due to strong surface thinning close to the termini snow at the glacier surface or days with snowmelt during
of the large outlet and tidewater glaciers (Fig. S3c). Re- September 2016. It is likely that the depth of signal pene-
gional average elevation changes of glaciers in Franz Josef tration in the winter seasons 2010/11 and 2016/17 was rela-
Land (−0.48 ± 0.04 m a−1 ) and Severnaya Zemlya (−0.34 ± tively large, i.e., several meters, as found by previous studies
0.12 m a−1 ) are in general less negative, and strong thinning (Millan et al., 2015; Zhao and Floricioiu, 2017; Abdullahi et
is confined to a smaller number of glaciers. Average eleva- al., 2018; Li et al., 2021), but similar due to comparable dry
tion changes on Severnaya Zemlya are strongly positive be- and frozen surface conditions. For TanDEM-X DEMs of the
low 50 m a.s.l. (Fig. S3b) due to a surge event within the ob- Antarctic Peninsula it was observed that the measured cold-
servation period at the Vavilov ice cap (Zheng et al., 2019). season heights rather referred to the refrozen firn of the pre-
Slight thickening is observed at the highest glacierized al- vious summer than to the actual glacier surface (Rott et al.,
titudes and the Academy of Sciences ice cap (Severnaya 2014). This might also be the case for some of the glacierized
Zemlya), similar to the observations of (Sánchez-Gámez et areas of Novaya Zemlya where the observed bias between
al., 2019). The overall adjusted mass change in the Russian September and winter DEMs is relatively small (e.g., < 2 m).
Arctic is −22.19 ± 6.41 Gt a−1 (density conversion factor: However, for glacier areas with higher differences in signal
850 kg m−3 ). Approximately 50 % of the total mass loss is penetration depth, it is more likely that the measurement is
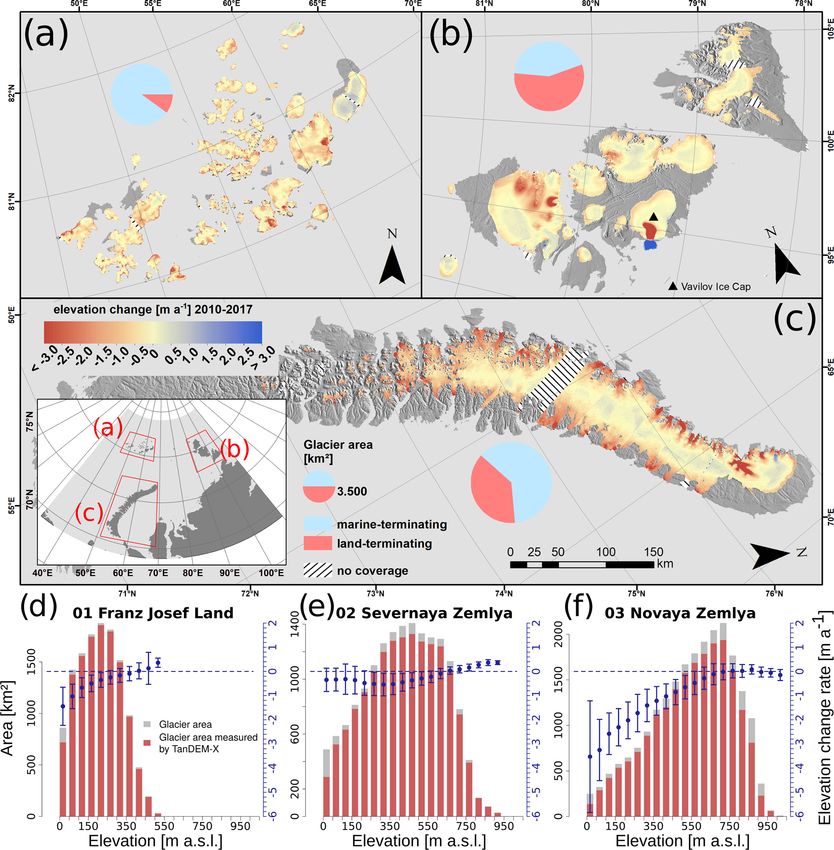
The Cryosphere, 16, 35–42, 2022 https://doi.org/10.5194/tc-16-35-2022C. Sommer et al.: Increased glacier mass loss in the Russian High Arctic (2010–2017) 39 Figure 2. Surface elevation changes of glaciers on Franz Josef Land (a), Severnaya Zemlya (b), and Novaya Zemlya (c) between 2010 and 2017. Hatched areas indicate glaciers without coverage by TanDEM-X. Respective average elevation change rates and total and measured glacier areas within 50 m elevation bins are shown in Fig. 1 (d–f). Blue vertical bars indicate the normalized median absolute deviation of elevation change measurements of each elevation bin. The hypsometric distribution of Severnaya Zemlya does not include the surge of the Vavilov ice cap (RGI60-09.00971). Elevation changes at Novaya Zemlya were corrected for differences in seasonal SAR signal penetration (Fig. S2). biased by penetration beyond the previous late-summer sur- rate of Novaya Zemlya is therefore more negative than the face, by either an older ice layer of a year with widespread uncorrected rate because the effects of different signal pene- melt and refreezing or volume scattering of the X-band SAR tration depths probably outweigh the winter accumulation. It (Dall et al., 2001). Either way, during the September 2016 is noteworthy that the applied regional correction scheme can acquisitions on Novaya Zemlya, the absolute depth of sig- introduce a larger uncertainty at a local glacier scale caused nal penetration was probably smaller and the measured sur- by different surface and backscatter conditions between the face closer to the glacier surface. However, due to the change specific TanDEM-X acquisitions (Fig. S2b). However, due to in surface conditions, the relative difference between pen- the limited extent of overlapping glacier areas (Fig. S2a), it is etration depths of the winter season 2010/11 and Septem- not possible to derive a date-specific intensity correction for ber 2016 increased. The corrected glacier elevation change each DEM strip. Thus, the applied linear model does rather https://doi.org/10.5194/tc-16-35-2022 The Cryosphere, 16, 35–42, 2022
40                                               C. Sommer et al.: Increased glacier mass loss in the Russian High Arctic (2010–2017)

Table 1. Overview of glacier elevation and mass change in the Russian Arctic between 2010/11 and 2016/17. Glacier areas (S) are derived
from the Randolph Glacier Inventory 6.0. Its spatial coverage by elevation change measurements (Smea. ) is stated in percent; 1h/1tuncorr.
shows elevation change rates as measured by TanDEM-X, while 1h/1tcorr. includes the SAR signal-penetration-corrected elevation change
rate of Novaya Zemlya. 1M/1tuncorr. and 1M/1tcorr. are the respective glacier mass change rates using a volume-to-mass conversion
factor of a 850 kg m−3 and b 900 kg m−3 .

  Region                      S        Smea.      1h/1tuncorr.   1h/1tcorr.    1M/1tuncorr.    1M/1tcorr.     1M/1tuncorr.     1M/1tcorr.
                            [km2 ]      [%]         [m a−1 ]      [m a−1 ]      [Gt a−1 ]a      [Gt a−1 ]a     [Gt a−1 ]b       [Gt a−1 ]b
  Franz Josef Land          12 750       96               −0.48 ± 0.04                 −5.14 ± 0.43                    −5.45 ± 0.45
  Severnaya Zemlya          16 529       97               −0.34 ± 0.12                 −4.70 ± 1.31                    −4.98 ± 1.38
  Novaya Zemlya             22 117       91       −0.53 ± 0.23 −0.64 ± 0.46*   −9.95 ± 3.14   −12.06 ± 6.17   −10.54 ± 3.31 −12.76 ± 6.53*
  Russian Arctic            51 707       93       −0.46 ± 0.15 −0.52 ± 0.24*   −20.05 ± 3.47 −22.19 ± 6.41    −21.23 ± 3.66 −23.49 ± 6.78*

* Acquisition date offsets corrected for Novaya Zemlya.

represent an average difference in surface penetration depth                   sured by Strozzi et al. (2017) over the course of the last
between September and winter SAR data.                                         decades. Using a combination of gravimetric and altimet-
   Over the last decades, the High Arctic has been subject                     ric measurements, Ciracì et al. (2018) reported a similar
to ongoing warming (Jansen et al., 2020), and glacier mass                     mass change of −14 ± 4 Gt a−1 for Novaya Zemlya (2010–
budgets have become more negative. Compared to previous                        2016) compared to the corrected mass change rate derived by
studies (Fig. S5), glacier mass loss has increased in the Rus-                 TanDEM-X.
sian High Arctic since 2010. The glacier mass changes mea-                        In contrast to the lower ablation areas, elevation gains of
sured by TanDEM-X are similar or more negative than re-                        up to 0.4 m a−1 are measured for the highest altitudes of
cent gravimetric records (Ciracì et al., 2020; Wouters et al.,                 the Russian Arctic archipelagos, which do not seem to be
2019), supporting their observation of increasing mass loss.                   related to differences in SAR penetration because the re-
Recent large-scale regional studies based on optical elevation                 spective measurements were acquired under similar surface
models (Hugonnet et al., 2021) and altimetry (Tepes et al.,                    conditions. This is particularly noticeable at some parts of
2021) reported less negative mass changes (−10.4 ± 1.9 and                     the large accumulation areas of Novaya Zemlya, Severnaya
−14.0 ± 0.5 Gt a−1 ) since 2000, yet their measurements also                   Zemlya, and Graham Bell Island (Franz Josef Land). Similar
indicate a distinct acceleration in mass loss over the course                  patterns can be also observed in the elevation change maps of
of the 21st century.                                                           altimetry measurements (Ciracì et al., 2018; Moholdt et al.,
   While the regional geodetic mass change derived from                        2012; Sánchez-Gámez et al., 2019; Zheng et al., 2018) and
TanDEM-X data of Franz Josef Land is very similar to re-                       might be related to increased moisture transport and accumu-
cent gravimetric (Ciracì et al., 2020) and altimetric (Zheng et                lation (Box et al., 2019). The ERA5 datasets also indicate a
al., 2018) measurements, the estimate for Severnaya Zemlya                     positive trend in temperature and total column water vapor
is even more negative than the gravimetric measurements                        (Fig. S4a and b) for the Russian Arctic archipelagos. How-
of Ciracì et al. (2020), which might indicate recent accel-                    ever, the latter trend is not statistically significant in most
eration of glacier mass loss also on this archipelago. How-                    regions and less pronounced than the increase in tempera-
ever, the highest mass changes are mostly confined to a                        ture, supporting our observations of an overall amplification
small number of outlet glaciers of the Vavilov and Academy                     of glacier mass loss.
of Sciences ice caps (RGI60-09.00915,919,920,971). For
the remaining glacierized areas of the Severnaya Zemlya
archipelago (∼ 14 000 km2 ), the mass change rate is much                      5   Conclusion
smaller (−2.39 Gt a−1 , 850 kg m−3 ) than for the entire region
                                                                               Glaciers in the Russian High Arctic have shown a contribu-
(−4.70 Gt a−1 ).
                                                                               tion of 0.06 mm a−1 to global sea level rise between 2010 and
   The strongest local surface lowering is observed at some
                                                                               2017 and an increased mass loss compared to the first decade
of the large marine-terminating outlet glaciers, most notably
                                                                               of the 21st century. This observation is in line with glacier
on Novaya Zemlya (northwestern Severny Island ice cap).
                                                                               changes in other Arctic regions, showing an increasing con-
For those glaciers, an increasing retreat in the early 21st cen-
                                                                               tribution to sea level rise in the last decades. While specific
tury was attributed to fjord geometries and changes in sea–ice
                                                                               mass change rates of Arctic glaciers are still less negative
concentrations (Carr et al., 2014). Long-term observations
                                                                               than those of many glaciers outside the polar regions, the ab-
indicate a more rapid thinning during recent years, particu-
                                                                               solute mass loss is higher due to the vast glacierized areas of
larly at the termini of marine-terminating glaciers (Melko-
                                                                               the Arctic.
nian et al., 2016). An acceleration in flow velocities for the
major tidewater glaciers in the Russian Arctic was also mea-

The Cryosphere, 16, 35–42, 2022                                                                      https://doi.org/10.5194/tc-16-35-2022
C. Sommer et al.: Increased glacier mass loss in the Russian High Arctic (2010–2017) 41
The acquisition-date-related differences in elevation References
change on Novaya Zemlya highlight the relevance of simi-
lar surface conditions between SAR acquisitions when using
DEM differencing. Particularly for shorter observation pe- Abdullahi, S., Wessel, B., Leichtle, T., Huber, M., Wohlfart,
C., and Roth, A.: Investigation of Tandem-x Penetration
riods, corrections for temporal offsets between acquisitions
Depth Over the Greenland Ice Sheet, in: IGARSS 2018–
are crucial as the uncorrected elevation change rate can be 2018 IEEE International Geoscience and Remote Sensing
biased by changes in surface conditions. However, acquisi- Symposium, IGARSS 2018–2018 IEEE International Geo-
tions from the same season should be used whenever possi- science and Remote Sensing Symposium, Valencia, 133–1339,
ble as the measurement uncertainty increases depending on https://doi.org/10.1109/IGARSS.2018.8518930, 2018.
the corrected glacier area. Regarding upcoming TanDEM-X Abdullahi, S., Wessel, B., Huber, M., Wendleder, A., Roth, A., and
acquisitions, combined measurements with the new ICESat- Kuenzer, C.: Estimating Penetration-Related X-Band InSAR El-
2 laser altimeter have the potential to much better constrain evation Bias: A Study over the Greenland Ice Sheet, Remote
offsets between different acquisition dates. Sens., 11, 2903, https://doi.org/10.3390/rs11242903, 2019.
Box, J. E., Colgan, W. T., Christensen, T. R., Schmidt, N. M.,
Lund, M., Parmentier, F.-J. W., Brown, R., Bhatt, U. S., Eu-
Data availability. Elevation change maps and raster skirchen, E. S., Romanovsky, V. E., Walsh, J. E., Overland, J.
masks with the specific observation period of each cell E., Wang, M., Corell, R. W., Meier, W. N., Wouters, B., Mernild,
are provided via the World Data Center PANGAEA S., Mård, J., Pawlak, J., and Olsen, M. S.: Key indicators of Arc-
(https://doi.org/10.1594/PANGAEA.939836; Sommer et al., tic climate change: 1971–2017, Environ. Res. Lett., 14, 045010,
2022). https://doi.org/10.1088/1748-9326/aafc1b, 2019.
Braun, M. H., Malz, P., Sommer, C., Farías-Barahona, D., Sauter,
T., Casassa, G., Soruco, A., Skvarca, P., and Seehaus, T. C.: Con-
straining glacier elevation and mass changes in South America,
Supplement. The supplement related to this article is available on-
Nat. Clim. Change, 9, 130–136, https://doi.org/10.1038/s41558-
line at: https://doi.org/10.5194/tc-16-35-2022-supplement.
018-0375-7, 2019.
Carr, J. R., Stokes, C., and Vieli, A.: Recent retreat of major out-
let glaciers on Novaya Zemlya, Russian Arctic, influenced by
Author contributions. CS processed the glacier elevation and mass fjord geometry and sea-ice conditions, J. Glaciol., 60, 155–170,
change data, created the graphs, and wrote the manuscript. The anal- https://doi.org/10.3189/2014JoG13J122, 2014.
ysis code of the DEM creation and coregistration was jointly devel- Ciracì, E., Velicogna, I., and Sutterley, T.: Mass Balance
oped by CS and TS. AG contributed to the comparison and inter- of Novaya Zemlya Archipelago, Russian High Arctic, Us-
pretation of measured glacier changes. MHB initiated and led the ing Time-Variable Gravity from GRACE and Altimetry
study. All authors revised the paper. Data from ICESat and CryoSat-2, Remote Sens., 10, 1817,
https://doi.org/10.3390/rs10111817, 2018.
Ciracì, E., Velicogna, I., and Swenson, S.: Continuity of the Mass
Competing interests. The contact author has declared that neither Loss of the World’s Glaciers and Ice Caps From the GRACE
they nor their co-authors have any competing interests. and GRACE Follow-On Missions, Geophys. Res. Lett., 47, 18,
https://doi.org/10.1029/2019GL086926, 2020.
Dall, J., Madsen, S. N., Keller, K., and Forsberg, R.: Topography
Disclaimer. Publisher’s note: Copernicus Publications remains and penetration of the Greenland Ice Sheet measured with Air-
neutral with regard to jurisdictional claims in published maps and borne SAR Interferometry, Geophys. Res. Lett., 28, 1703–1706,
institutional affiliations. https://doi.org/10.1029/2000GL011787, 2001.
Gardner, A. S., Moholdt, G., Cogley, J. G., Wouters, B., Arendt,
A. A., Wahr, J., Berthier, E., Hock, R., Pfeffer, W. T., Kaser,
Acknowledgements. We thank the Copernicus Climate Change Ser- G., Ligtenberg, S. R. M., Bolch, T., Sharp, M. J., Hagen, J. O.,
vice (C3S), which is implemented by the European Centre for van den Broeke, M. R., and Paul, F.: A Reconciled Estimate of
Medium-Range Weather Forecasts (ECMWF) on behalf of the Eu- Glacier Contributions to Sea Level Rise: 2003 to 2009, Science,
ropean Commission, for free and open data access. TanDEM-X data 340, 852–857, https://doi.org/10.1126/science.1234532, 2013.
were kindly provided free of charge by the German Aerospace Cen- Hugonnet, R., McNabb, R., Berthier, E., Menounos, B., Nuth,
ter (DLR) under AO mabra_XTI_GLAC0264. C., Girod, L., Farinotti, D., Huss, M., Dussaillant, I., Brun,
F., and Kääb, A.: Accelerated global glacier mass loss
in the early twenty-first century, Nature, 592, 726–731,
https://doi.org/10.1038/s41586-021-03436-z, 2021.
Financial support. This research has been supported by the
Huss, M.: Density assumptions for converting geodetic glacier
Deutsche Forschungsgemeinschaft (grant no. BR2105/14-2).
volume change to mass change, The Cryosphere, 7, 877–887,
https://doi.org/10.5194/tc-7-877-2013, 2013.
Jacob, T., Wahr, J., Pfeffer, W. T., and Swenson, S.: Recent con-
Review statement. This paper was edited by Etienne Berthier and tributions of glaciers and ice caps to sea level rise, Nature, 482,
reviewed by two anonymous referees. 514–518, https://doi.org/10.1038/nature10847, 2012.
https://doi.org/10.5194/tc-16-35-2022 The Cryosphere, 16, 35–42, 202242 C. Sommer et al.: Increased glacier mass loss in the Russian High Arctic (2010–2017) Jansen, E., Christensen, J. H., Dokken, T., Nisancioglu, K. H., Sánchez-Gámez, P., Navarro, F. J., Benham, T. J., Glazovsky, A. Vinther, B. M., Capron, E., Guo, C., Jensen, M. F., Langen, P. F., Bassford, R. P., and Dowdeswell, J. A.: Intra- and inter- L., Pedersen, R. A., Yang, S., Bentsen, M., Kjær, H. A., Sadatzki, annual variability in dynamic discharge from the Academy of H., Sessford, E., and Stendel, M.: Past perspectives on the present Sciences Ice Cap, Severnaya Zemlya, Russian Arctic, and its era of abrupt Arctic climate change, Nat. Clim. Change, 10, 714– role in modulating mass balance, J. Glaciol., 65, 780–797, 721, https://doi.org/10.1038/s41558-020-0860-7, 2020. https://doi.org/10.1017/jog.2019.58, 2019. Li, J., Li, Z.-W., Hu, J., Wu, L.-X., Li, X., Guo, L., Liu, Z., Seehaus, T., Malz, P., Sommer, C., Lippl, S., Cochachin, A., and Miao, Z.-L., Wang, W., and Chen, J.-L.: Investigating the Braun, M.: Changes of the tropical glaciers throughout Peru be- bias of TanDEM-X digital elevation models of glaciers on tween 2000 and 2016 – mass balance and area fluctuations, The the Tibetan Plateau: impacting factors and potential effects Cryosphere, 13, 2537–2556, https://doi.org/10.5194/tc-13-2537- on geodetic mass-balance measurements, J. Glaciol., 67, 1–14, 2019, 2019. https://doi.org/10.1017/jog.2021.15, 2021. Sommer, C., Seehaus, T., Glazovsky, A., and Braun, M. Matsuo, K. and Heki, K.: Current Ice Loss in Small Glacier Systems H.: Surface elevation change rates of most glaciers of the Arctic Islands (Iceland, Svalbard, and the Russian High on Franz Josef Land, Severnaya Zemlya and Novaya Arctic) from Satellite Gravimetry, Terr. Atmos. Ocean. Sci., 24, Zemlya between 2010 and 2017, PANGAEA [data set], 657, https://doi.org/10.3319/TAO.2013.02.22.01(TibXS), 2013. https://doi.org/10.1594/PANGAEA.939836, 2022. Melkonian, A. K., Willis, M. J., Pritchard, M. E., and Stew- Strozzi, T., Paul, F., Wiesmann, A., Schellenberger, T., and Kääb, art, A. J.: Recent changes in glacier velocities and thinning A.: Circum-Arctic Changes in the Flow of Glaciers and Ice Caps at Novaya Zemlya, Remote Sens. Environ., 174, 244–257, from Satellite SAR Data between the 1990s and 2017, Remote https://doi.org/10.1016/j.rse.2015.11.001, 2016. Sens., 9, 947, https://doi.org/10.3390/rs9090947, 2017. Millan, R., Dehecq, A., Trouve, E., Gourmelen, N., and Berthier, Tepes, P., Gourmelen, N., Nienow, P., Tsamados, M., Shepherd, A., E.: Elevation changes and X-band ice and snow penetration and Weissgerber, F.: Changes in elevation and mass of Arctic inferred from TanDEM-X data of the Mont-Blanc area, in: glaciers and ice caps, 2010–2017, Remote Sens. Environ., 261, 2015 8th International Workshop on the Analysis of Multi- 112481, https://doi.org/10.1016/j.rse.2021.112481, 2021. temporal Remote Sensing Images (Multi-Temp), 2015 8th In- Wessel, B., Bertram, A., Gruber, A., Bemm, S., and Dech, ternational Workshop on the Analysis of Multitemporal Re- S.: A NEW HIGH-RESOLUTION ELEVATION MODEL mote Sensing Images (Multi-Temp), Annecy, France, 1–4, OF GREENLAND DERIVED FROM TANDEM-X, ISPRS https://doi.org/10.1109/Multi-Temp.2015.7245753, 2015. Ann. Photogramm. Remote Sens. Spat. Inf. Sci., III-7, 9–16, Moholdt, G., Wouters, B., and Gardner, A. S.: Recent mass changes https://doi.org/10.5194/isprsannals-III-7-9-2016, 2016. of glaciers in the Russian High Arctic, Geophys. Res. Lett., 39, Wouters, B., Gardner, A. S., and Moholdt, G.: Global Glacier Mass 55, https://doi.org/10.1029/2012GL051466, 2012. Loss During the GRACE Satellite Mission (2002–2016), Front. Morris, A., Moholdt, G., and Gray, L.: Spread of Sval- Earth Sci., 7, 96, https://doi.org/10.3389/feart.2019.00096, 2019. bard Glacier Mass Loss to Barents Sea Margins Re- Zhao, J. and Floricioiu, D.: The penetration effects on TanDEM-X vealed by CryoSat-2, J. Geophys. Res.-Earth Surf., 125, 14, elevation using the GNSS and laser altimetry measurements in https://doi.org/10.1029/2019JF005357, 2020. Antarctica, ISPRS – Int. Arch. Photogramm. Remote Sens. Spat. Pfeffer, W. T., Arendt, A. A., Bliss, A., Bolch, T., Cogley, J. G., Inf. Sci., XLII-2/W7, 1593–1600, https://doi.org/10.5194/isprs- Gardner, A. S., Hagen, J.-O., Hock, R., Kaser, G., Kienholz, archives-XLII-2-W7-1593-2017, 2017. C., Miles, E. S., Moholdt, G., Mölg, N., Paul, F., Radić, V., Zheng, W., Pritchard, M. E., Willis, M. J., Tepes, P., Gourmelen, N., Rastner, P., Raup, B. H., Rich, J., Sharp, M. J., and The Ran- Benham, T. J., and Dowdeswell, J. A.: Accelerating glacier mass dolph Consortium: The Randolph Glacier Inventory: a glob- loss on Franz Josef Land, Russian Arctic, Remote Sens. Environ., ally complete inventory of glaciers, J. Glaciol., 60, 537–552, 211, 357–375, https://doi.org/10.1016/j.rse.2018.04.004, 2018. https://doi.org/10.3189/2014JoG13J176, 2014. Zheng, W., Pritchard, M. E., Willis, M. J., and Stearns, L. A.: Rott, H., Floricioiu, D., Wuite, J., Scheiblauer, S., Nagler, The Possible Transition From Glacial Surge to Ice Stream T., and Kern, M.: Mass changes of outlet glaciers along on Vavilov Ice Cap, Geophys. Res. Lett., 46, 13892–13902, the Nordensjköld Coast, northern Antarctic Peninsula, based https://doi.org/10.1029/2019GL084948, 2019. on TanDEM-X satellite measurements: TanDEM-X Antarc- tic Peninsula glaciers, Geophys. Res. Lett., 41, 8123–8129, https://doi.org/10.1002/2014GL061613, 2014. The Cryosphere, 16, 35–42, 2022 https://doi.org/10.5194/tc-16-35-2022
You can also read