Long-Term Modelling Reveals Contrasting Population Trends Among North American Hummingbirds
←
→
Page content transcription
If your browser does not render page correctly, please read the page content below
Long-Term Modelling Reveals Contrasting Population Trends Among North American Hummingbirds Simon G. English Environment and Climate Change Canada, Paci c Wildlife Research Centre Christine A. Bishop ( christine.bishop@canada.ca ) Environment and Climate Change Canada, Paci c Wildlife Research Centre Scott Wilson Environment and Climate Change Canada, Paci c Wildlife Research Centre Adam C. Smith Environment and Climate Change Canada, National Wildlife Research Centre Research Article Keywords: Long-term, population, hummingbirds, ecological Posted Date: April 29th, 2021 DOI: https://doi.org/10.21203/rs.3.rs-465047/v1 License: This work is licensed under a Creative Commons Attribution 4.0 International License. Read Full License
1   Long-term modelling reveals contrasting population
 2   trends among North American hummingbirds
 3   Simon G. English1 , Christine A. Bishop1,* , Scott Wilson1 , and Adam C. Smith2

 4
     1 Environment   and Climate Change Canada, Wildlife Research Division, Pacific Wildlife Research Centre, 5421
 5   Robertson Road, Delta, BC,4V4K 3N2, Canada
 6
     2 Environment and Climate Change Canada, Wildlife Research Division, National Wildlife Research Centre, 1125

 7   Colonel By Drive, Ottawa, ON, K1S 5B6, Canada
 8
     * christine.bishop@canada.ca

 9   ABSTRACT

     As pollinators, hummingbirds play a critical role for both the function of ecological communities and in providing ecosystem
     services for people. To examine the conservation status of North American hummingbirds, we analyzed Breeding Bird Survey
     data for 8 species and 3 genera for which there was sufficient survey coverage from 1970 to 2019 (long-term) and from
     2009 to 2019 (short-term, approximately three generations). Among the Selasphorus genus, Allen’s, rufous, and broad-tailed
     hummingbirds have declined since 1970, and the rate of decline increased from 2009 to 2019. In a reversal of the trends
10   from the past half-century, ruby-throated hummingbirds of Eastern North America have declined since approximately 2004
     throughout most of the species’ breeding range. In contrast, Anna’s hummingbird populations have increased dramatically
     since 1970 in their range in western North America. This increase is most exaggerated in Canada, related to a northern range
     expansion. Our results highlight contrasting population trends across species and provide an important first step to address
     declines, most notably among species in the Selasphorus and Archilochus genera. Our geographic modelling also emphasizes
     the need to prioritize regions of conservation interest in the breeding and wintering ranges of hummingbirds.

11   Introduction
12   We have reached a turning point in the modern era for biodiversity loss1 . Human disturbance to habitat and climate change are
13   the two greatest threats to biodiversity of our time2, 3 . Nearly 60 % of all bird species in North America are in decline, with
14   a loss of almost 30 % of birds since 19704 and others projected to become extinct within the next 30 years5 . Evidently, the
15   widespread risk of diversity loss is substantial, although resources allocated to conservation are not. Here we report on an
16   underrepresented family of birds in the literature that may be at the forefront of these declines: the hummingbirds (Trochilidae).
17       Hummingbirds are an ecologically important family of birds in North America, pollinating at least 184 known plant species
18   through co-evolution with the plants that provide nectar to fuel their high-energy flight6–8 . Hummingbirds are among the most
19   rapidly diversifying clades of birds in the world, due in part to the diversity of ecological niches they exploit9 . As such, they
20   possess diverse phenological and life-history characteristics. For instance, many of the North American hummingbirds are
21   migratory10 , a characteristic that makes them especially vulnerable to the impacts of climate change and human disturbance
22   to habitat11 . In contrast, urbanization and changing climate may have relieved environmental pressures for other species,
23   particularly non-migratory hummingbirds that benefit from year-round access to introduced plant species and supplemental
24   feeders12, 13 . Therefore, as human activity and climate change alter ecoregions differently14, 15 , hummingbird species may also
25   be impacted at different rates.
26       Among the 14 species of North American hummingbirds that commonly occur north of Mexico16 , some have experienced
27   range transformations, while others have shown population declines since the 1970s when continental monitoring began with
28   programs such as the North American Breeding Bird Survey (BBS)10, 13 . The family as a whole has experienced significant
29   population declines4 , although species including the ruby-throated hummingbird (A. colubris) and the Anna’s hummingbird (C.
30   anna) have previously shown periods of population growth over the last 50 years10, 12 . We analyzed Breeding Bird Survey (BBS)
31   data to examine range-wide and regional population trends for 8 species in 3 genera: Allen’s hummingbirds (Selasphorus sasin),
32   rufous hummingbirds (Selasphorus rufus), broad-tailed hummingbirds (Selasphorus platycercus), calliope hummingbirds
33   (Selasphorus calliope), black-chinned hummingbirds (Archilochus alexandri), ruby-throated hummingbirds (Archilochus
34   colubris), Anna’s hummingbirds (Calypte anna), and Costa’s hummingbirds (Calypte costae). Species in the Archilochus and
35   Selasphorus genera are medium-to-long-distance migrants with a resident subspecies of the Allen’s hummingbird expanding its
36   range13 . Both Calypte species are resident to short-distance migrants.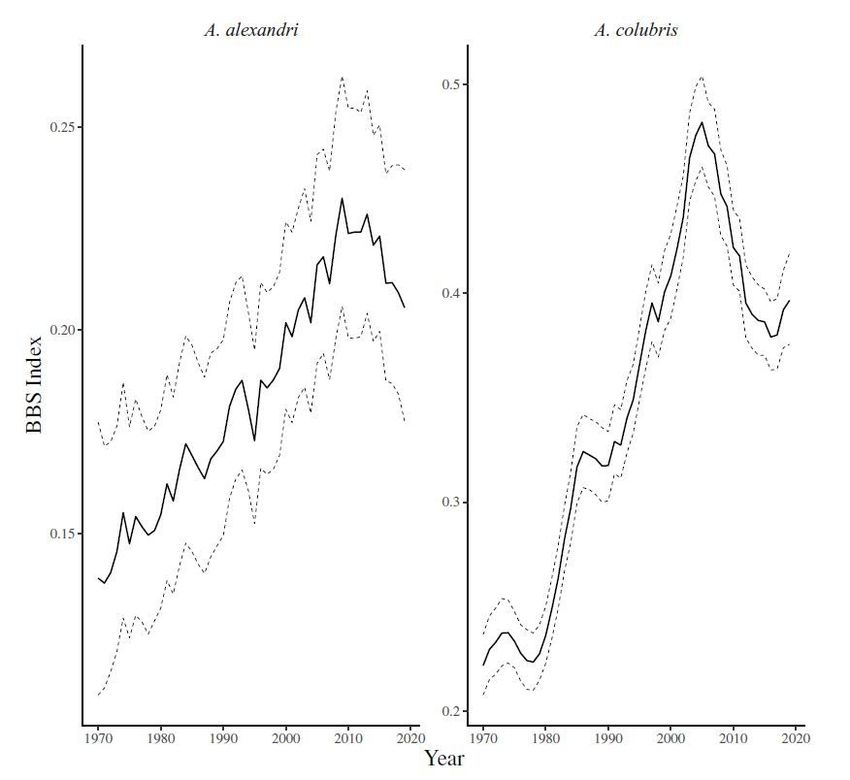
37 We analyzed the period from 1970 to 2019 and contrast these results with short-term analyses for the period from 2009
38 to 2019 to gain insight into population changes occurring over approximately three generations. We also focus on regional
39 trends of each species to examine spatial variation in trends across the range of each species. Among the hummingbirds we
40 analyzed, diverse life-history characteristics are represented, from resident species to long-distance migrants, urbanized species
41 and species whose habitat is largely limited to shrubsteppe or forested landscapes, as well as species with diverse breeding
42 phenologies. We consider how these different characteristics may relate to the population trends observed in our dataset.
43 Results
44 We modelled hummingbird populations in North America from BBS data from 1970–2019 for long-term population trends
45 and from 2009–2019 for short-term trends (Figure 1). We analyzed 8 species in 3 genera for which there was sufficient BBS
46 coverage, where nlt is the number of BBS routes included in long-term analyses and nst is the number of BBS routes included
47 in short-term analyses: calliope hummingbirds (Selasphorus calliope; nlt = 223; nst = 193), broad-tailed hummingbirds
48 (Selasphorus platycercus; nlt = 303; nst = 267), rufous hummingbirds (Selasphorus rufus; nlt = 408; nst = 348), and Allen’s
49 hummingbirds (Selasphorus sasin; nlt = 59; nst = 50), black-chinned hummingbirds (Archilochus alexandri; nlt = 471;
50 nst = 399), ruby-throated hummingbirds (Archilochus colubris; nlt = 2469; nst = 2123), Anna’s hummingbirds (Calypte anna;
51 nlt = 266; nst = 223), Costa’s hummingbirds (Calypte costae; nlt = 97; nst = 73).
52 Three of the four species in the Selasphorus genus have declined since 1970, while the fourth species, the calliope
53 hummingbird, has remained relatively stable (Figure 2). From 1970 to 2019, Allen’s hummingbirds declined by −88 % (CI:
54 −95 % to −76 %) at an average annual rate of −4.3 % yr−1 (CI: −5.8 % yr−1 to −2.8 % yr−1 ) (Figure 1). Allen’s hummingbirds
55 suffered a dramatically steepened short-term decline at nearly a two-fold greater rate than over the past 50 years (−7.9 % yr−1 ;
56 CI: −12.4 % yr−1 to −3.6 % yr−1 ) throughout regions of their range with sufficient coverage to estimate trends (Figure
57 S1). From 1970 to 2019, rufous hummingbird populations declined by −65 % (CI: −72 % to −56 %) at −2.1 % yr−1 (CI:
58 −2.6 % yr−1 to −1.7 % yr−1 ) and this rate of change has also accelerated by nearly two-fold to −4.1 % yr−1 (CI: −5.5 % yr−1
59 to −2.7 % yr−1 ) (Figure 1). These trends appear to be most dramatic on the Pacific Coast of the rufous hummingbird’s range
60 (Figure S2). Trend analyses of broad-tailed hummingbirds revealed a population loss of −37 % (CI: −52 % to −19 %) at
61 −0.95 % yr−1 (CI: −1.5 % yr−1 to −0.42 % yr−1 ) in the long-term, and −2.4 % yr−1 (CI: −3.4 % yr−1 to −1.3 % yr−1 ) in the
62 short-term (Figure 1). Declines appear most significant in the southern extent of their range (Figure S3). Calliope populations
63 are not changing significantly, either in the long-term (−0.057 % yr−1 ; CI: −0.87 % yr−1 to 0.80 % yr−1 ) or the short-term
64 (−0.82 % yr−1 ; CI: −3.1 % yr−1 to 1.6 % yr−1 ) (Figure S4).
65 Continent-wide populations of both species in the Archilochus genus show increases over the long-term but declines from
66 2009 to 2019. From 1970 to 2019, the continent-wide black-chinned hummingbird population increased by 52 % (CI: 16 % to
67 98 %) at a rate of 0.86 % yr−1 (CI: 0.31 % yr−1 to 1.40 % yr−1 ). Ruby-throated hummingbird population increased by 79 % (CI:
68 65 % to 95 %) at a rate of 1.2 % yr−1 (CI: 1.0 % yr−1 to 1.4 % yr−1 ) since 1970 (Figure 1). The short-term population trends
69 from 2009 to 2019 were relatively stable for black-chinned hummingbirds (−0.75 % yr−1 ; CI: −2.5 % yr−1 to 1.0 % yr−1 )
70 although there appears to be a signal of moderate declines throughout most of the species range (Figure S5). Trends also
71 reversed for ruby-throated hummingbirds, where over a 10-year period, the continent-wide population decreased by −9.5 %
72 (CI: −15 % to −3.6 %) at an average rate of −0.99 % yr−1 (CI: −1.6 % yr−1 to −0.36 % yr−1 ) throughout the breeding range
73 (Figure 3, S6). This trend is more dramatic when estimated over the full 15-year period of decline. The average annual rate
74 of decline from 2004 to 2019, ruby-throated hummingbirds in North American declined by an estimated 17 % (CI: −22 % to
75 −10 %) at an average annual rate of −1.20 % yr−1 (CI: −1.7 % yr−1 to −0.73 % yr−1 .
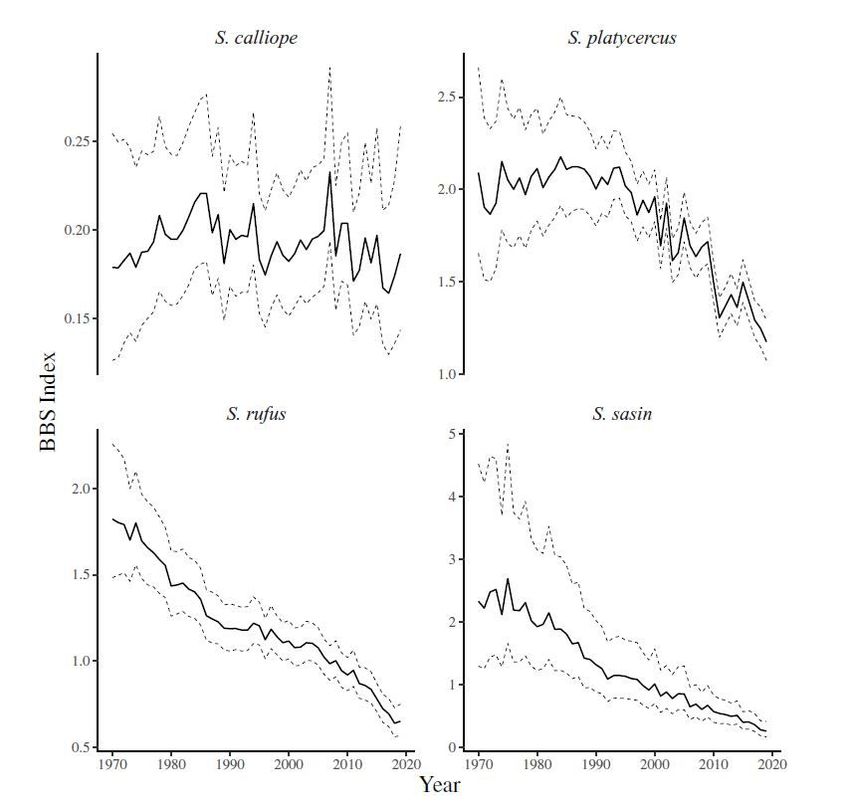
76 Continent-wide population levels of the Calypte genus have increased in the case of Anna’s Hummingbird or remained
77 relatively stable in the case of Costa’s hummingbirds (Figure 4). Anna’s hummingbirds increased from 1970 to 2019 at a rate
78 of 2.7 % yr−1 (CI: 2.1 % yr−1 to 3.3 % yr−1 ). This trend steepened in the short-term (3.5 % yr−1 ; CI: 1.5 % yr−1 to 5.5 % yr−1 ),
79 and was most dramatic in the northern and western extent of the species’ current range (Figure S7). Continent-wide Costa’s
80 hummingbird populations did not change significantly in our long-term (0.30 % yr−1 ; CI: −1.1 % yr−1 to 1.9 % yr−1 ) or short-
81 term (−1.0 % yr−1 ; CI: −4.9 % yr−1 to 3.9 % yr−1 ) trend analyses. Uncertainty on Costa’s hummingbird trend analyses are
82 relatively large (Figure 1), and may impact our ability to detect a significant signal of population decline reflected across the
83 majority of their range (Figure S8).
2/10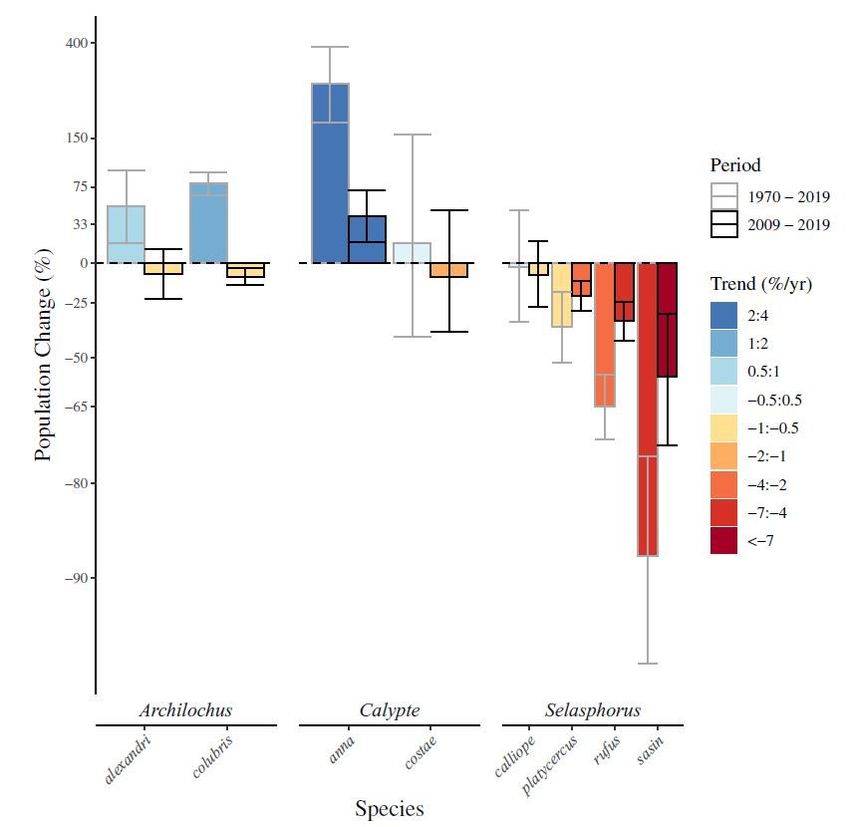
400

                         150
                                                                                                          Period
                          75
                                                                                                                1970 − 2019
                          33                                                                                    2009 − 2019
 Population Change (%)

                           0
                                                                                                          Trend (%/yr)
                         −25
                                                                                                                2:4
                                                                                                                1:2
                         −50
                                                                                                                0.5:1

                         −65                                                                                    −0.5:0.5
                                                                                                                −1:−0.5
                                                                                                                −2:−1
                         −80                                                                                    −4:−2
                                                                                                                −7:−4
S. calliope S. platycercus
2.5
0.25
2.0
0.20
1.5
0.15
BBS Index
1.0
S. rufus S. sasin
5
2.0
4
3
1.5
2
1.0
1
0.5 0
1970 1980 1990 2000 2010 2020 1970 1980 1990 2000 2010 2020
Year
Figure 2. Breeding Bird Survey indices for North American hummingbirds in the Selasphorus genus from 1970 to 2019.
Dashed lines represent upper and lower bounds of the 90 % credible-interval.
4/10A. alexandri A. colubris
0.5
0.25
0.4
0.20
BBS Index
0.3
0.15
0.2
1970 1980 1990 2000 2010 2020 1970 1980 1990 2000 2010 2020
Year
Figure 3. Breeding Bird Survey indices for North American hummingbirds in the Archilochus genus from 1970 to 2019.
Dashed lines represent upper and lower bounds of the 90 % credible-interval.
5/10C. anna C. costae
2.5
0.9 2.0
BBS Index
1.5
0.6
1.0
0.3 0.5
1970 1980 1990 2000 2010 2020 1970 1980 1990 2000 2010 2020
Year
Figure 4. Breeding Bird Survey indices for North American hummingbirds in the Calypte genus from 1970 to 2019. Dashed
lines represent upper and lower bounds of the 90 % credible-interval.
84 Discussion
85 By conducting a family-level assessment of long-and short-term population trends we show the contrasting population
86 trajectories among North American hummingbirds in a critical step towards understanding threats and potential conservation
87 approaches for this ecological group. Our analyses revealed alarming population declines in the Selasphorus genus. Allen’s,
88 Rufous, and broad-tailed hummingbird declines have all accelerated over the last three generations to nearly double the rate of
89 decline over the previous half-century. We also report previously undocumented declines of Eastern North America’s most
90 common hummingbird: the ruby-throated hummingbird (Figure 3), where over a 15-year period, the continent-wide population
91 decreased by 17 % (Figure 1). This short-term decline contrasts the species’ average population growth rate from 1970 to 2019
92 (Figure 1). In contrast, the Anna’s hummingbird, a resident hummingbird in Western North America, has experienced dramatic
6/1093 population growth at an accelerating rate in the last decade (Figure 1). Anna’s hummingbird populations have increased
94 significantly in the USA but most extremely in the expanding northern edge of their range in Canada (Figure S7), where the
95 population increased at a rate of 20 % yr−1 . The species was formerly rare in southern Canada even in the late 2000s but is now
96 an abundant year-round resident in the Georgia Basin Ecosystem and commonly occurs as far north as southern Alaska.
97 The Selasphorus genus comprises medium-to-long distance migrants, including a resident population of Allen’s humming-
98 birds in residential parts of California with a reportedly stable or perhaps growing population13 . The cause of population
99 decline for migratory Allen’s, rufous and broad-tailed hummingbirds are still largely unknown. For migratory hummingbirds,
100 plant phenology may provide cues on the quality of stopover sites17 . A mismatch between hummingbird migration and plant
101 phenology could contribute to decline in hummingbird populations, which are exacerbated among migratory species18 . This
102 kind of phenological mismatch is thought to occur for migratory rufous hummingbirds19 . Furthermore, as natural habitats are
103 converted into urban environments, invasive species may impact the quality of stopover sites and breeding grounds in remaining
104 non-urban environments. An overabundance of deer can impact ecosystems through sustained overbrowsing of herbaceous
105 cover and flowers20 , thus precipitating detrimental changes to the woodlot and meadow habitats21, 22 . High-density white-tailed
106 deer populations in wooded habitats in North America significantly reduced species richness and abundance of intermediate
107 canopy nesting songbirds22 , where most hummingbirds build their nests.
108 On the wintering grounds, the rufous hummingbird has reportedly experienced an expansion of wintering distribution,
109 perhaps attributable to an increase in resources provided in gardens and genetic reprogramming of migratory orientation23 ;
110 however, these hypotheses and the data on which they are based have not been updated or tested rigorously since their
111 publication over 2 decades ago. Furthermore, the authors acknowledge the potential for a substantial observer bias, wherein
112 more resources for identification of rufous hummingbirds promotes more frequent reporting as well as an unknown increase
113 in supplemental resource provisioning23 . Our data collected during the breeding season indicate similar declines in Canada
114 and the USA for species which exist in both regions, both in the long-term and the short-term. While there is potential for
115 a mismatch in breeding phenology, and thus detection, and surveying efforts24, 25 , an advancement of mean arrival date of
116 several days is not likely to fully account for the drastic declines observed from northern and southern range limits even in our
117 short-term analyses (Figure S2B), where Allen’s hummingbirds lost 56 % (CI: 31 % to 73 %) of their population, while rufous
118 hummingbirds lost 35 % (CI: 24 % to 43 %) since 2009 (Figure 1). Observation of declines for disparate populations in North
119 America might also reflect threats on their non-breeding grounds26 . For example, the wintering range of rufous, broad-tailed,
120 and migratory Allen’s populations all include montane forests in central Mexico where there is both recent and future projected
121 habitat loss27 . Threats to Selasphorus hummingbirds are still poorly known and future research to identify those threats and
122 where they are most impactful should be considered a high priority.
123 The Archilochus hummingbird genus of medium-to-long distance migrants generally found at low elevation experienced
124 population growth until approximately 2004. Trend maps for black-chinned hummingbirds from 2009 to 2019 reveal relatively
125 stable or declining populations throughout most of the mapped region (Figure S5B). Ruby-throated hummingbirds show this
126 same pattern, though with stronger declines over the last three generations (Figure S6B). Although data in the wintering range
127 for these birds is largely unavailable, ruby-throated hummingbirds are arriving to breeding grounds up to 18 d earlier than they
128 did historically in the northern parts of their range28 . The considerable changes to the breeding phenology of ruby-throated
129 hummingbirds during which the population increased and then declined suggests that a phenological mismatch with breeding
130 surveys is unlikely, although this mechanism has been proposed to underlie the declines for Allen’s and rufous hummingbirds13 .
131 Two possibilities for the recent reversal in population trends among black-chinned and ruby-throated hummingbirds that should
132 be considered for further research include the impacts of wintering habitat loss26 and the impacts of widespread agrochemical
133 exposure29–31 .
134 In contrast to the general declines observed in the Selasphorus genus, Anna’s Hummingbirds have experienced an ecological
135 release putatively associated with climate change and supplemental resource provisioning by humans12, 32 . The increase in
136 carrying capacity for Anna’s hummingbirds in some Northern parts of their range are thought to be a result of increased nectar
137 availability from feeders and eucalyptus trees, which bloom from October to April33 , although eucalyptus availability would
138 not apply in Canada. These additional resources alleviate the pressure of constricted nectar availability in winter months,
139 when Anna’s hummingbirds begin their breeding season, therefore increasing the potential for a second brood12, 34 . Anna’s
140 Hummingbirds may also possess physiological and behavioural adaptations not yet examined or quantified that allow them to
141 tolerate the extreme cold weather in Canada. Moreover, the relatively early breeding season of Anna’s hummingbirds gives
142 them a considerable advantage over migratory species.
143 Estimating species population trends and population sizes using BBS data has drawn criticism because surveys along
144 routes could potentially fail to transect productive habitats, or underestimate populations13, 35, 36 . Still, the current and rapidly
145 developing Bayesian statistical methods used to analyze these data have matured considerably in the past half-century to
146 extract ecologically important information from species in regions with low survey coverage37–40 . Furthermore, these are the
147 most rigorous methods available because it is possible to quantify uncertainties in trend estimates41 and BBS monitoring still
7/10148 provides an unbiased estimate of the population trend in the location where the survey was conducted. The population declines
149 observed in our BBS data show fairly symmetrical declines in the northern extent of the range of rufous and ruby-throated
150 hummingbirds. This symmetrical decline throughout the range across long and short time periods would not be reflective of a
151 phenological shift, as was suggested in a recent study using eBird data13 . Understanding of the current limitations of these tools
152 is essential for developing accurate trend estimates. Advances in other broad-scale monitoring programs such as eBird will
153 soon allow for a comparative data set on hummingbird population trends. Monitoring programs combining citizen-science and
154 BBS surveys have good potential to complement one another to identify and prioritize regions of conservation interest42, 43 and
155 provide more robust estimates over a broader region including the non-breeding grounds.
156 Hummingbird species across North America are clearly undergoing significant population changes. The strong declines
157 reported here among species in the Selasphorus genus are of particular concern to biodiversity conservation efforts. Furthermore,
158 the previously unreported declines of ruby-throated hummingbirds carry potentially important ecosystem-level consequences if
159 left unaddressed, since this pollinator species alone fills it’s ecological niche in Eastern North America. We propose future
160 studies using citizen-science data collection to target regions of high conservation priority for ruby-throated hummingbirds
161 and species in the Selasphorus genus, followed by BBS analyses to monitor population trends in ongoing efforts to conserve
162 these essential pollinators of North America. More detailed studies are also needed to investigate potential drivers of decline,
163 particularly the impacts of agrochemicals throughout the annual cycle and habitat loss on the non-breeding grounds.
164 Methods
165 Breeding Bird Surveys
166 BBS surveys have been conducted since 1966 and involve ~40 km long transects consisting of 50 road-side point counts
167 separated by ~0.8 km10 . Each route is surveyed by an expert once per year between late May and early July on fair weather
168 days with the survey commencing approximately 0.5 h before sunrise. All species and individuals detected within a 400 m
169 radius are recorded at each point count. For most analyses, abundance data is summed across all 50 points on each route to
170 provide a single estimate of abundance per species per year. Our long-term trend analyses included data from 12–2469 routes,
171 and short-term trend analyses included data from 12–2123 routes. BBS route coverage was sufficient for analysis of 8 of the 14
172 commonly occurring hummingbird species in the USA and Canada16 . The species that were excluded have ranges that fall
173 primarily in Mexico with only small peripheral populations in southern regions of California, Arizona and Texas where there
174 was insufficient BBS coverage.
175 Statistical analyses
176 Population trends and trajectories were estimated using a Bayesian hierarchical Generalized Additive Model with Year Effects
177 (GAMYE)40 in R44 . The survey-wide analyses were run during the annual analysis of the BBS data conducted by the Canadian
178 Wildlife Service45 , and additional summaries and maps were created with the R-package bbsBayes46 . Point estimates for
179 trends are calculated as the median of the posterior distribution generated from Markov-chain Monte-Carlo methods. Credible
180 intervals (CI) for parameter estimates are computed as percentiles of the posterior distribution of parameters. CIs are reported
181 for the interval spanning 90% of the posterior distribution, unless otherwise stated. Trends described for long-term data include
182 the period from 1970 to 2019. Trends described for short-term data include the period from 2009 to 2019.
183 Acknowledgements
184 We thank the many volunteer surveyors who have contributed time and bird-identification expertise to the Breeding Bird
185 Surveys. We also thank the BBS coordinators in Canada and the USA.
186 Competing interests
187 The authors declare no competing interests.
188 Availability of materials and data
189 BBS data and R scripts to analyze these data are provided by ACS on GitHub.
190 References
191 1. United Nations Environment Programme. Making Peace With Nature. Tech. Rep., United Nations Environment Programme
192 (2021).
8/10193 2. Newbold, T. et al. Global effects of land use on local terrestrial biodiversity. Nature 520, 45–50, DOI: 10.1038/nature14324
194 (2015).
195 3. Urban, M. C. Accelerating extinction risk from climate change. Sci. (80-. ). 348, 571–573, DOI: 10.1126/science.aaa4984
196 (2015).
197 4. Rosenberg, K. V. et al. Decline of the North American avifauna. Sci. (80-. ). 366, 120–124, DOI: 10.1126/science.aaw1313
198 (2019).
199 5. Jetz, W., Wilcove, D. S. & Dobson, A. P. Projected impacts of climate and land-use change on the global diversity of birds.
200 PLoS Biol. 5, 1211–1219, DOI: 10.1371/journal.pbio.0050157 (2007).
201 6. Abrahamczyk, S. & Renner, S. S. The temporal build-up of hummingbird/plant mutualisms in North America and temperate
202 South America. BMC Evol. Biol. 15, DOI: 10.1186/s12862-015-0388-z (2015).
203 7. Grant, V. & Grant, K. A. A Hummingbird-Pollinated Species of Boraginaceae in the Arizona Flora. Proc. Natl. Acad. Sci.
204 66, 917–919, DOI: 10.1073/pnas.66.3.917 (1970).
205 8. Ratto, F. et al. Global importance of vertebrate pollinators for plant reproductive success: a meta-analysis. Front. Ecol.
206 Environ. 16, 82–90, DOI: 10.1002/fee.1763 (2018).
207 9. McGuire, J. A. et al. Molecular phylogenetics and the diversification of hummingbirds. Curr. Biol. 24, 910–916, DOI:
208 10.1016/j.cub.2014.03.016 (2014).
209 10. Sauer, J. R., Link, W. A., Fallon, J. E., Pardieck, K. L. & Ziolkowski, D. J. The North American Breeding Bird Survey
210 1966–2011: Summary Analysis and Species Accounts. North Am. Fauna 79, 1–32, DOI: 10.3996/nafa.79.0001 (2013).
211 11. Bairlein, F. Migratory birds under threat. Sci. (80-. ). 354, 547–548, DOI: 10.1126/science.aah6647 (2016).
212 12. Battey, C. J. Ecological Release of the Anna’s Hummingbird during a Northern Range Expansion. Am. Nat. 194, 306–315,
213 DOI: 10.1086/704249 (2019).
214 13. Clark, C. J. EBird records show substantial growth of the Allen’s Hummingbird (Selasphorus sasin sedentarius) population
215 in urban Southern California. Condor 119, 122–130, DOI: 10.1650/CONDOR-16-153.1 (2017).
216 14. Sleeter, B. M. et al. Land-cover change in the conterminous United States from 1973 to 2000. Glob. Environ. Chang. 23,
217 733–748, DOI: 10.1016/j.gloenvcha.2013.03.006 (2013).
218 15. Gallant, A. L., Loveland, T. R., Sohl, T. L. & Napton, D. E. Using an ecoregion framework to analyze land-cover and
219 land-use dynamics. Environ. Manag. 34 Suppl 1, DOI: 10.1007/s00267-003-0145-3 (2004).
220 16. Williamson, S. L. A Field Guide to Hummingbirds of North America (Peterson Field Guide Series) (Houghton Mifflin
221 Company, Boston, 2002).
222 17. McGrath, L. J., van Riper III, C. & Fontaine, J. J. Flower power: tree flowering phenology as a settlement cue for migrating
223 birds. J. Anim. Ecol. 78, 22–30, DOI: 10.1111/j.1365-2656.2008.01464.x (2009).
224 18. Jones, T. & Cresswell, W. The phenology mismatch hypothesis: are declines of migrant birds linked to uneven global
225 climate change? J. Anim. Ecol. 79, 98–108, DOI: 10.1111/j.1365-2656.2009.01610.x (2010).
226 19. Courter, J. R. Changes In Spring Arrival Dates of Rufous Hummingbirds ( Selasphorus rufus ) In Western North
227 America In the Past Century. Wilson J. Ornithol. 129, 535–544, DOI: 10.1676/16-133.1 (2017).
228 20. Rooney, T. Deer impacts on forest ecosystems: a North American perspective. Forestry 74, 201–208, DOI: 10.1093/
229 forestry/74.3.201 (2001).
230 21. Côté, S. D., Rooney, T. P., Tremblay, J.-P., Dussault, C. & Waller, D. M. Ecological Impacts of Deer Overabundance. Annu.
231 Rev. Ecol. Evol. Syst. 35, 113–147, DOI: 10.2307/annurev.ecolsys.35.021103.30000006 (2004).
232 22. Decalesta, D. S. Effect of White-Tailed Deer on Songbirds within Managed Forests in Pennsylvania. J. Wildl. Manag. 58,
233 711–718 (1994).
234 23. Hill, G. E., Sargent, R. R. & Sargent, M. B. Recent change in the winter distribution of Rufous Hummingbirds. Auk 115,
235 240–245, DOI: 10.2307/4089135 (1998).
236 24. Lehikoinen, A. Climate change, phenology and species detectability in a monitoring scheme. Popul. Ecol. 55, 315–323,
237 DOI: 10.1007/s10144-012-0359-9 (2013).
238 25. Massimino, D., Harris, S. J. & Gillings, S. Phenological mismatch between breeding birds and their surveyors and
239 implications for estimating population trends. J. Ornithol. 162, 143–154, DOI: 10.1007/s10336-020-01821-5 (2021).
9/10240 26. Wilson, S. et al. Prioritize diversity or declining species? Trade-offs and synergies in spatial planning for the conservation
241 of migratory birds in the face of land cover change. Biol. Conserv. 239, 108285, DOI: 10.1016/j.biocon.2019.108285
242 (2019).
243 27. Toledo-Aceves, T., Meave, J. A., González-Espinosa, M. & Ramírez-Marcial, N. Tropical montane cloud forests: Current
244 threats and opportunities for their conservation and sustainable management in Mexico. J. Environ. Manag. 92, 974–981,
245 DOI: 10.1016/j.jenvman.2010.11.007 (2011).
246 28. Courter, J. R., Johnson, R. J., Bridges, W. C. & Hubbard, K. G. Assessing migration of Ruby-throated Hummingbirds (
247 Archilochus colubris ) at broad spatial and temporal scales. Auk 130, 107–117, DOI: 10.1525/auk.2012.12058
248 (2013).
249 29. English, S. G. et al. Neonicotinoid pesticides exert metabolic effects on avian pollinators. Sci. Rep. 11, 2914, DOI:
250 10.1038/s41598-021-82470-3 (2021).
251 30. Bishop, C. A. et al. Determination of neonicotinoids and butenolide residues in avian and insect pollinators and their ambient
252 environment in Western Canada (2017, 2018). Sci. Total. Environ. 737, 139386, DOI: 10.1016/j.scitotenv.2020.139386
253 (2020).
254 31. Graves, E. E. et al. Analysis of insecticide exposure in California hummingbirds using liquid chromatography-mass
255 spectrometry. Environ. Sci. Pollut. Res. 26, 15458–15466, DOI: 10.1007/s11356-019-04903-x (2019).
256 32. Greig, E. I., Wood, E. M. & Bonter, D. N. Winter range expansion of a hummingbird is associated with urbanization and
257 supplementary feeding. Proc. R. Soc. B Biol. Sci. 284, DOI: 10.1098/rspb.2017.0256 (2017).
258 33. Jepson, W. L. & Hickman, J. C. The Jepson Manual: Higher Plants of California (University of California Press, Berkeley,
259 1993).
260 34. Scarfe, A. & Finlay, J. C. Rapid second nesting by Anna’s Hummingbird near its Northern breeding limit. West. Birds 32,
261 131–133 (2001).
262 35. Bibby, C. J., Burgess, N. D. & Hill, D. A. Bird census techniques (Academic Press, London, 1992).
263 36. Thogmartin, W. E. et al. A Review of the Population Estimation Approach of the North American Landbird Conservation
264 Plan. Auk 123, 892–904, DOI: 10.1093/auk/123.3.892 (2006).
265 37. Carter, M. F., Hunter, W. C., Pashley, D. N. & Rosenberg, K. V. Setting Conservation Priorities for Landbirds in the United
266 States: The Partners in Flight Approach. Auk 117, 541–548, DOI: 10.1093/auk/117.2.541 (2000).
267 38. Sauer, J. R. & Link, W. A. Analysis of the North American Breeding Bird Survey Using Hierarchical Models. Auk 128,
268 87–98, DOI: 10.1525/auk.2010.09220 (2011).
269 39. Sauer, J. R., Niven, D. K., Pardieck, K. L., Ziolkowski, D. J. & Link, W. A. Expanding the North American Breeding
270 Bird Survey analysis to include additional species and regions. J. Fish Wildl. Manag. 8, 154–172, DOI: 10.3996/
271 102015-JFWM-109 (2017).
272 40. Smith, A. C. & Edwards, B. P. M. North American Breeding Bird Survey status and trend estimates to inform a wide
273 range of conservation needs, using a flexible Bayesian hierarchical generalized additive model. Condor 123, 1–16, DOI:
274 10.1093/ornithapp/duaa065 (2021).
275 41. Stanton, J. C., Blancher, P., Rosenberg, K. V., Panjabi, A. O. & Thogmartin, W. E. Estimating uncertainty of north american
276 landbird population sizes. Avian Conserv. Ecol. 14, DOI: 10.5751/ACE-01331-140104 (2019).
277 42. Schuster, R. et al. Optimizing the conservation of migratory species over their full annual cycle. Nat. Commun. 10, DOI:
278 10.1038/s41467-019-09723-8 (2019).
279 43. Johnston, A. et al. Abundance models improve spatial and temporal prioritization of conservation resources. Ecol. Appl.
280 25, 1749–1756, DOI: 10.1890/14-1826.1 (2015).
281 44. R Core Team. R: A language and environment for statistical computing (Version 4.0.3) (2020).
282 45. Smith, A. C., Hudson, M.-A., Aponte, V. & Francis, C. North American Breeding Bird Survey - Canadian Trends Website,
283 Data-version 2017 (2019).
284 46. Edwards, B. P. & Smith, A. C. BbsBayes: An R package for hierarchical bayesian analysis of North American Breeding
285 bird survey data. bioRxiv DOI: 10.1101/2020.05.27.118901 (2020).
10/10Figures Figure 1 Percent change in hummingbird populations across North America. Vertical axes scale to symmetry on the log-scale to accurately represent the percent change necessary for a population to recover to initial size at the beginning of the period. Column colours scaled to rate of change where darker hues re ect a greater rate of change. Errors shown are the upper and lower bounds of 90% credible-intervals.
Figure 2

Breeding Bird Survey indices for North American hummingbirds in the Selasphorus genus from 1970 to
2019. Dashed lines represent upper and lower bounds of the 90% credible-interval.
Figure 3

Breeding Bird Survey indices for North American hummingbirds in the Archilochus genus from 1970 to
2019. Dashed lines represent upper and lower bounds of the 90% credible-interval.
Figure 4

Breeding Bird Survey indices for North American hummingbirds in the Calypte genus from 1970 to 2019.
Dashed lines represent upper and lower bounds of the 90% credible-interval.

Supplementary Files
This is a list of supplementary les associated with this preprint. Click to download.
HummingbirdPopulationTrendssupp.pdf
You can also read