Calibration of residual aberrations in exoplanet imagers with large numbers of degrees of freedom - Astronomy & Astrophysics
←
→
Page content transcription
If your browser does not render page correctly, please read the page content below
A&A 649, A170 (2021)
https://doi.org/10.1051/0004-6361/202040157                                                                                                               Astronomy
c R. Pourcelot et al. 2021                                                                                                                                 &
                                                                                                                                                          Astrophysics

Calibration of residual aberrations in exoplanet imagers with large
                  numbers of degrees of freedom
   R. Pourcelot1,2 , A. Vigan1 , K. Dohlen1 , B. Rouzé1,3 , J.-F. Sauvage1,4 , M. El Morsy1 , M. Lopez1 , M. N’Diaye2 ,
        A. Caillat1 , E. Choquet1 , G. P. P. L. Otten1 , A. Abbinanti1 , P. Balard1 , M. Carbillet2 , P. Blanchard1 ,
                                                 J. Hulin1 , and É. Robert1

      1
          Aix Marseille Univ, CNRS, CNES, LAM, Marseille, France
      2
          Université Côte d’Azur, Observatoire de la Côte d’Azur, CNRS, Laboratoire Lagrange, France
          e-mail: raphael.pourcelot@oca.eu
      3
          École Centrale Marseille, Marseille, France
      4
          ONERA, The French Aerospace Lab, BP72, 29 avenue de la Division Leclerc, 92322 Châtillon Cedex, France

     Received 17 December 2020 / Accepted 18 March 2021

                                                                                     ABSTRACT

     Imaging faint objects, such as exoplanets or disks, around nearby stars is extremely challenging because host star images are domi-
     nated by the telescope diffraction pattern. Using a coronagraph is an efficient solution for removing diffraction but requires an incom-
     ing wavefront with good quality to maximize starlight rejection. On the ground, the most advanced exoplanet imagers use extreme
     adaptive optics (ExAO) systems that are based on a deformable mirror (DM) with a large number of actuators to efficiently com-
     pensate for high-order aberrations and provide diffraction-limited images. While several exoplanet imagers with DMs using ∼1500
     actuators are now routinely operating on large telescopes to observe gas giant planets, future systems may require a tenfold increase in
     the number of degrees of freedom to look for rocky planets. In this paper, we explore wavefront correction with a secondary adaptive
     optics system that controls a very large number of degrees of freedom that are not corrected by the primary ExAO system. Using
     Marseille Imaging Testbed for High Contrast (MITHiC), we implement a second stage of adaptive optics with ZELDA, a Zernike
     wavefront sensor, and a spatial light modulator to compensate for the phase aberrations of the bench downstream residual aberrations
     from adaptive optics. We demonstrate that their correction up to 137 cycles per pupil with nanometric accuracy is possible, provided
     there is a simple distortion calibration of the pupil and a moderate wavefront low-pass filtering. We also use ZELDA for a fast com-
     pensation of ExAO residuals, showing its promising implementation as a second-stage correction for the observation of rocky planets
     around nearby stars. Finally, we present images with a classical Lyot coronagraph on MITHiC and validate our ability to reach its
     theoretical performance with our calibration.
     Key words. instrumentation: adaptive optics – instrumentation: high angular resolution – techniques: high angular resolution

1. Introduction                                                                                  (WFS) and a deformable mirror (DM) to measure and compen-
                                                                                                 sate for the aberrations introduced by the atmosphere in real
Imaging extrasolar planets is one of the most demanding endeav-                                  time, leading to images at nearly the theoretical resolution limit
ors in astronomy today. Collecting photons from these planets                                    (e.g., Beuzit et al. 1997; Herriot et al. 1998; Rousset et al. 2003;
will yield precious astrophysical information on their nature,                                   Roddier 2004). The accurate calibration of AO systems relies on
leading to knowledge of their orbital and rotational param-                                      the computation of the interaction matrix, a numerical tool relat-
eters (Galicher et al. 2014; Vigan et al. 2016a; Chilcote et al.                                 ing the response of WFS subapertures to DM actuations.
2015; Maire et al. 2016; Zurlo et al. 2016), clues on their loca-                                    The latest generation of high-contrast imaging instruments,
tion and formation history (Crepp et al. 2012; Öberg et al. 2011;                                such as the Very Large Telescope (VLT) Spectro-Polarimetric
Piso et al. 2016), and constraints on the chemistry at stake in                                  High-contrast Exoplanet REsearch (SPHERE; Beuzit et al.
their atmosphere (Knutson 2007; Phillips et al. 2020). However,                                  2019), Gemini Planet Image (GPI; Macintosh et al. 2014), and
imaging an exoplanet, and in particular an Earth analog, is                                      the Subaru Coronagraphic Extreme Adaptive Optics (SCExAO;
extremely challenging because of the flux ratio (also referred                                   Jovanovic et al. 2015), include novel extreme adaptive optics
to as the contrast) of at least 10−8 with its host star at angu-                                 (ExAO). These systems are characterized by a wavefront cor-
lar separations shorter than 50 mas (Traub et al. 2010). Using a                                 rection with a high temporal frequency, up to 3.5 kHz, and a
coronagraph on a large telescope is a compelling approach for                                    DM with a large number of actuators, up to 40 across the
attenuating the light of an observed star image and providing the                                telescope pupil diameter. While allowing for correction in a
sensitivity to collect sufficient photons from the planet at high                                field of view up to ∼100 × 100 , ExAO enables the production
angular resolution.                                                                              of images with Strehl ratios up to 95% in the near infrared
    For large telescopes on the ground, angular resolution does                                  (e.g., Sauvage et al. 2016). Such image quality translates into an
not scale with the telescope’s primary mirror diameter as Earth’s                                increase in the amount of light gathered in the core of the point
atmospheric turbulence blurs the observations. Adaptive optics                                   spread function (PSF) of the planet and, therefore, in the signal-
(AO) systems have been developed with a wavefront sensor                                         to-noise ratio (S/N). In addition, the high image quality allows

                                                                                                                                                                         A170, page 1 of 14

                Open Access article, published by EDP Sciences, under the terms of the Creative Commons Attribution License (https://creativecommons.org/licenses/by/4.0),
                                 which permits unrestricted use, distribution, and reproduction in any medium, provided the original work is properly cited.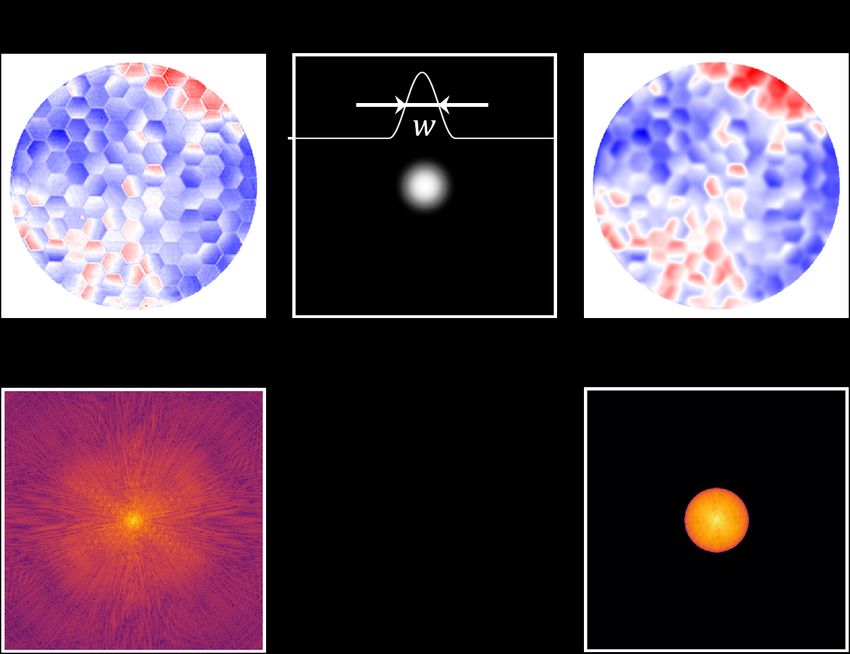
A&A 649, A170 (2021)
for efficient starlight suppression at large separations to observe composed of several independent primary mirrors and associ-
faint structures, such as protoplanetary and debris disks, around ated deformable secondary mirrors, the Giant Magellan Tele-
an observed bright star. scope (Johns et al. 2012) will provide a pitch of ∼20 cm at first
These instruments have proven to be remarkably efficient, light with close to 120 actuators across the pupil diameter. The
with contrasts down to 10−6 at 0.300 angular separations, lead- number of actuators also tends to increase for space applica-
ing to several new young substellar mass companion discover- tions. For example, Ruane et al. (2020) performs phase conju-
ies (Macintosh et al. 2015; Perrin et al. 2015; Konopacky et al. gation with two DMs from Boston Micromachines, yielding 50
2016; Chauvin et al. 2017; Keppler et al. 2018; Cheetham et al. actuators across the diameter of the active area for each device.
2018), many newly imaged disks (e.g., Avenhaus et al. 2018; It is therefore crucial to investigate the wavefront correction pos-
Ginski et al. 2016; Stolker et al. 2016; de Boer et al. 2016), and sibilities that are offered with a very large number of degrees of
studies of other astrophysical objects at unprecedented resolu- freedom.
tions (e.g., Kervella et al. 2015; Schmid et al. 2017). Extensive To handle this new range of high-order spatial frequencies,
surveys such as the Gemini Planet Imager Exoplanet Survey we explore the use of a second-stage AO system, including a
(GPIES) with Gemini/GPI (Nielsen et al. 2019) or the SpHere ZWFS and a spatial light modulator (SLM) implemented down-
INfrared survey for Exoplanets (SHINE) with VLT/SPHERE stream from the first ExAO system. To make the most of the
(Vigan et al. 2021) have brought new constraints on the popu- ZWFS formalism developed by N’Diaye et al. (2013), we pro-
lation of young giant planets. pose the use of a phase conjugation technique with a calibration
Their success has also shed light on the limiting factors that procedure that uses probes that are performed in a two-frame
prevent observations at even deeper contrasts and smaller sepa- acquisition sequence. We thus do not compute any standard
rations. One of the main limitations for coronagraphy are non- interaction matrix: Each iteration implies solving a second-order
common path aberrations (NCPAs), which are optical distortions polynomial equation per phase measurement bin.
on the instrument science path that are unseen by the AO system In Sect. 2, we present the Marseille Imaging Testbed for High
on its WFS path. As they slowly vary with time (Soummer et al. Contrast (MITHiC) with its 2019 upgrade and a ZELDA proto-
2007), these quasi-static aberrations do not average over time type to test the measurement and correction on a very large num-
and cannot simply be calibrated as a bias. Over the past few ber of degrees of freedom. We also describe the closed-loop tests
years, several strategies have been proposed to calibrate these using ZELDA as a WFS. In Sect. 3, the experimental procedure
residual errors (see, for example, the review by Jovanovic et al. is detailed with the ZELDA formalism, the Fourier filtering pro-
2018). cess, and the two-frame calibration of pupil distortion. In Sect. 4,
Among these methods, the Zernike wavefront sensor we present the test results for static phase error correction and
(ZWFS; Zernike 1934; Bloemhof & Wallace 2003; Dohlen et al. for an on-bench simulation of real-time SPHERE residual turbu-
2004; Wallace et al. 2011) is one of the leading approaches for lence. Under certain assumptions, we show that it is possible to
NCPA correction in exoplanet imagers. Based on this approach, measure and compensate for aberrations down to a few nanome-
the Zernike sensor for Extremely Low-level Differential Aber- ters in standard deviation in the optical path difference (OPD)
ration (ZELDA; N’Diaye et al. 2013) was developed, installed, with various input phase errors.
and tested on VLT/SPHERE, showing promise as a calibra-
tion tool (N’Diaye et al. 2016; Vigan et al. 2019). This device
allowed for diagnosing the low-wind effect, which has been crip-
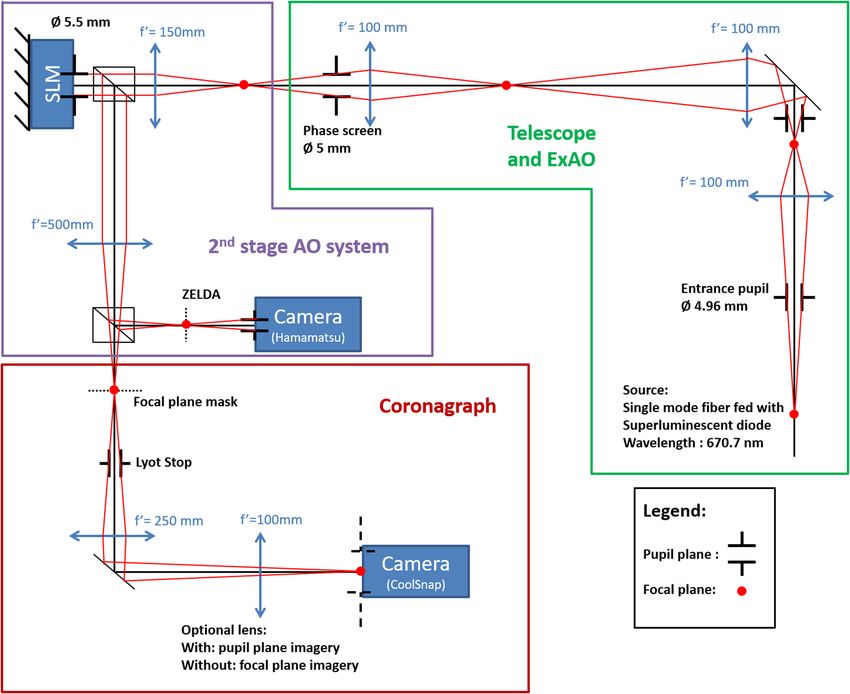
pling early SPHERE observations (Sauvage et al. 2015). It has 2. The MITHiC test bed
also been explored in simulations for alternative applications, MITHiC was initiated in 2010 to develop and test technolo-
such as fine telescope segment co-phasing (Janin-Potiron et al. gies for exoplanet high-contrast imaging (N’Diaye et al. 2012a,
2017). The ZWFS is set to be implemented on the Nancy Grace 2014). It was used as a test bed for wavefront sensing techniques
Roman Space Telescope (RST) a future NASA flagship mission such as ZELDA (N’Diaye et al. 2013) or COronagraphic Focal-
(Shi et al. 2016) with high-contrast capabilities for exoplanet plane wave-Front Estimation for Exoplanet detection (COFFEE;
observations, as well as in future ground-based extremely large Paul et al. 2013), coronagraphic concepts such as the apodized
telescope (ELT) instruments (e.g., Carlotti et al. 2018). pupil Roddier & Roddier or the dual-zone phase mask coron-
When looking at the instrumentation requirements for the agraphs (Soummer et al. 2003a,b; N’Diaye et al. 2010, 2012a),
ELTs currently being built, there is a clear trend for larger num- and dark hole algorithms (Herscovici-Schiller 2018; Leboulleux
bers of actuators. For example, the M4 mirror in the European 2018), as well as other science, such as detector characterization
Southern Observatory (ESO) ELT1 will have approximately 80 (Gach et al. 2019). Figure 1 presents the current optical setup of
actuators across the pupil diameter (Vernet et al. 2012). This DM the bench. It is divided into three major parts, which are briefly
will provide an actuator pitch of ∼50 cm and run at a maxi- described here and in much greater detail in Appendix A.
mum rate of 1 kHz, which will be sufficient to provide images The telescope part goes from the light source to a dedicated
with a ∼70% Strehl ratio in the K band for the first light phase screen and simulates a telescope observing an unresolved
instruments (Thatte et al. 2016; Davies et al. 2016) in single- star. The light source is a fiber-coupled superluminescent diode,
conjugated AO mode. While this will enable detection capabili- which has a central wavelength λ = 670.7 nm and a spectral
ties for studying warm or massive gaseous planets (Carlotti et al. bandwidth of 10 nm. The source is linearly polarized to match
2018; Houllé et al. 2021), it will not be sufficient to provide the SLM requirements precisely. A phase screen manufactured
ExAO performance for observing cold and light rocky plan- by SILIOS Technologies is then used to introduce various types
ets (Kasper et al. 2010). For such a challenging task, an actu- of aberration patterns that are typically encountered in large opti-
ator pitch of ∼20 cm and an AO loop running at 2–3 kHz is cal telescopes. It includes both static patterns and two continuous
required (Kasper et al. 2011, 2013), resulting in nearly 200 actu- rings of simulated residual turbulence for VLT/SPHERE and the
ators across the pupil diameter. Similarly, and although it is ELT High Angular Resolution – Monolithic – Optical and Near-
infrared – Integral field spectrograph (HARMONI; Vigan et al.
1
https://www.eso.org/sci/facilities/eelt/ 2016b).
A170, page 2 of 14R. Pourcelot et al.: Calibration of residual aberrations in exoplanet imagers with large numbers of degrees of freedom
Fig. 1. Schematic view of the MITHiC test bed. Focal planes are marked with red dots, and pupil planes are marked with black apertures with the
corresponding pupil diameters. Beam splitter cubes are drawn in black. The telescope, WFS, and coronagraph parts are detailed in Appendices
A.1–A.3, respectively. In addition, a control computer (not represented) is used to control the bench; some details are provided in Appendix A.4.
The following part is the second-stage AO system that is (RMS) on the wavefront and is mainly due to the spherical aber-
based on an SLM for the phase correction and a ZELDA WFS. ration from cumulative wavefront errors from the lenses. Using
The pupil of the system is reimaged on an SLM that mimics the phase error compensation described in Sect. 3, the level of
a DM to apply phase corrections. Our implementation allows residual phase aberrations can ultimately be reduced down to
for a particularly large number of subapertures on the WFS and ∼2 nm RMS, which is close to the theoretical quantization limit
a very high density of correction elements on the SLM, with, of the SLM at 0.76 nm RMS (see details in Appendix A).
respectively, 418 measurement points and 274 pixels across the Finally, the last part of the bench corresponds to the corona-
pupil diameter, D. As a downside, using an SLM as a wavefront graph and associated science imaging channel. The test bed cur-
corrector imposes the use of linearly polarized monochromatic rently implements a classical Lyot coronagraph (CLC) based on
light. The ZELDA WFS is implemented using a phase mask an opaque focal plane mask (FPM) and an associated Lyot stop.
with a depth of 350 nm, corresponding to nearly λ/4 in opti- In the final focal plane, the science imaging camera provides a
cal depth at 670.7 nm, and a diameter of 64 µm, corresponding fast readout with low noise to obtain high-contrast images. The
to a relative size of 1λ/D (N’Diaye et al. 2013). It is mounted camera can be used to image the coronagraphic signal either in
on a three-axis mount that enables its positioning with 1 µm the focal plane or in the pupil plane with an optional lens.
accuracy. The pupil is then reimaged with a diameter of 418
pixels on the detector of ZELDA, which provides more than 3. Principle of wavefront correction in a closed loop
130 000 single-resolution elements for wavefront sensing. The
acquisition procedure and the associated formalism for wave- We used the bench to perform closed-loop corrections of vari-
front measurements are detailed in Sect. 3. The WFS can be ous types of phase errors. The phase measurements were per-
operated for single wavefront measurements, but it is best used formed with ZELDA, whose principle is recalled in Sect. 3.1.
in a closed loop with the SLM, as presented in the following sec- As this sensor naturally provides phase error maps, we worked
tions. Without any correction from the SLM, the total amount of with an interaction-matrix-free correction by applying the oppo-
aberrations is approximately equal to 35.5 nm root mean square site measured phase map to the SLM. The algorithm is described
A170, page 3 of 14A&A 649, A170 (2021)
in Sect. 3.2. To overcome distortion in pupil conjugation, which For phase errors larger than 40 nm RMS, the ZELDA wave-
is automatically dealt with in a classical system relying on an front reconstruction is outside the sensor linearity range and the
interaction matrix, we performed an additional calibration step, error is underestimated (N’Diaye et al. 2016). Therefore, a sin-
detailed in Sect. 3.3. We finally performed an additional low- gle correction step will, in general, not be sufficient to fully com-
pass spatial filtering to avoid aliasing propagation and calibra- pensate for the phase errors of the bench. Repeating the previous
tion errors (see Sect. 3.4). procedure in a closed-loop fashion allows for convergence in a
small number of iterations.
3.1. Phase computation with ZELDA
3.3. Compensation for the geometrical distortions
ZELDA uses a focal plane phase mask on the point source image
to produce interferences between the light going through and In the absence of a classical interaction matrix, we calibrated
surrounding the mask in a downstream pupil plane. This results the system to compensate for geometric pupil distortion between
in pupil intensity variations, Ic , that are related to the phase aber- the WFS camera and the SLM. The calibration step was per-
rations, ϕ, upstream from the phase mask. In the regime of small formed by introducing a grid of N × N Gaussian phase spots on
aberrations (ϕ
1 rad) and assuming a second-order Taylor the SLM, for which we know the exact theoretical position. The
expansion for ϕ, the intensity–phase relation from N’Diaye et al. input coordinates, xi , yi , of each spot, i, can be represented by
(2013) yields a column vector, Vi . In the OPD map measured with ZELDA,
we then retrieve the output position vector of the spots, V 0 i . If
h i we consider an affine distortion, there exists a 2 × 2 matrix, M,
Ic = P2 + 2b2 (1 − cos θ) + 2Pb ϕ sin θ − (1 − ϕ2 /2)(1 − cos θ) ,
and a 2 × 1 column vector, C, such that, for all spots i, the Vi
(1) coordinates satisfy:
where θ is the phase shift introduced by the mask, P denotes Vi = M V 0 i + C. (2)
the amplitude profile in the entrance pupil (a top-hat function in We fit this transformation using a least-square algorithm to
our case), and b represents the real amplitude profile, which only determine the M and C coefficients to solve the following opti-
depends on the size of the ZELDA mask and can be calculated mization problem:
once and for all. Retrieving the phase map is obtained by solving
a second-degree polynomial equation for each pixel in the detec- N
X
Vi − M V 0 i + C 2 .
tor pupil plane. The OPD map is simply derived by inverting the min (3)
M,C
relation ϕ = 2πOPD/λ. This formalism is cost-efficient in terms i=1
of computation.
Finally, using the estimated M̂ and Ĉ from the fit, we applied
the inverse transform to each spot of our OPD maps to derive V 0 i :
3.2. Aberration compensation on MITHiC −1
V 0 i = M̂ Vi − Ĉ . (4)
On MITHiC, the pupil is sampled with 145 000 subapertures in
the pupil on the WFS camera and more than 60 000 DM-like Figure 2 illustrates this process with a 7 × 7 grid. This square
actuators on the SLM. With such large numbers of degrees of grid does not probe all of the surface of the pupil disk but only an
freedom, we implemented the direct correction of the aberrations inscribed square centered in the pupil. Nevertheless, the 49 intro-
without the requirement for a full-fledged interaction matrix; it duced dots already ensure the convergence of the determination
would be extremely time-consuming to compute on MITHiC, of the six parameters of M and C. A more complete sampling
which is not optimized for high-speed operations. would have to be tested even if it might not yield increased pre-
The first step is to acquire an initial OPD map, which cision. The computing cost of this calibration sums up to: two
requires two acquisitions on the WFS camera: one with the frame acquisitions, 7 × 7 Gaussian fits on 32 × 32 pixel subar-
ZELDA mask and one without it for flux normalization, as rays, and a linear regression to fit a six-parameter function on 49
described in N’Diaye et al. (2013). Both images are dark- points, which is performed within a few tens of seconds. Despite
corrected and re-centered. The OPD map is then computed using the fact that the bench is not stabilized in temperature or humid-
Eq. (1). In practice, we use the pyZELDA2 package for the phase ity, we found that performing the calibration once per day is
reconstruction (Vigan & N’Diaye 2018). With 418 pixels across sufficient for our usage. Figure 2 (left) shows a clear difference
the pupil diameter, the wavefront measurement with ZELDA between the introduced calibration spots (arrow ends) and the
allows us to retrieve extremely fine phase information with spa- measured calibration spots (arrow tips). The error shows not only
tial frequencies up to 209 cycles per pupil (c/p). a shift to the left, which can be seen as a misalignment, but also
Since the pupil is sampled with 1.5 times more pixels by the an additional, more complex distortion pattern. When removing
ZELDA camera than the SLM, we first tried to directly apply the pure shift component, as in Fig. 2 (center), the maximum
the negative of a resampled phase map onto the SLM to com- distance between the introduced and measured spot positions
pensate for the measured aberrations. However, as we will see is 6.96 pixels on the ZELDA camera, with an average of 4.27
in Sect. 4, this leads to a poor wavefront correction in a closed pixels. In terms of pupil percentage, this average displacement
loop due to the geometrical distortion of the pupil. We therefore writes as 0.01D, which is a sub-actuator displacement for a
perform an additional calibration, as well as a spatial filtering VLT/SPHERE-like DM. The affine approximation to compen-
of the computed OPD. Once these calibrations are applied, the sate for this error provides accurate results as the position of the
processed OPD map is downscaled using spline interpolation to spots after correction closely matches the expected position. The
get a pupil diameter of 274 pixels to match the pupil size on the maximum distance between the introduced and corrected spots
SLM, converted into phase, and displayed on the SLM. is shorter than 0.6 pixels, which corresponds to less than 0.002D.
The final displacements are presented in Fig. 2 (right). The aver-
2
https://github.com/avigan/pyZELDA age distance between an introduced point and a corrected point
A170, page 4 of 14R. Pourcelot et al.: Calibration of residual aberrations in exoplanet imagers with large numbers of degrees of freedom
Initial displacement - 4x Shift component removed - 4x Residuals - 40x
Fig. 2. Geometrical distortion of the pupil between the SLM and the ZELDA WFS. Left plot: full pixel displacement between the introduced
Gaussian spots and their measured positions, with a scale multiplied by four. Center plot: displacement after subtracting the C component, again
with a scale multiplied by four. Right plot: final residual displacement after correction of the measured positions, this time with a scale multiplied
by 40. The black circles represent the pupil footprint.
Normalized profile
1.0
0.5
0.0
0.10 0.05 0.00 0.05 0.10
Pupil radius
Fig. 4. Illustration of the radial profile of an influence function corre-
sponding to a Hann filter with w = 52 c/p, the equivalent of a DM with
104 actuators across.
2016) or alternatively projected onto the controllable modes of
the ExAO system (Vigan et al. 2019) before being applied on the
Fig. 3. Detailed steps of Fourier filtering. A Fourier transform (FT) is DM. In the present case, we implemented an optional low-pass
first applied to the initial OPD. The array in Fourier space is multi- filtering procedure by multiplying the Fourier transform of the
plied by the Hann window of total width 2w λ/D. Finally, an inverse OPD map by a Hann window of a specific width, as illustrated
FT, denoted FT-1 , is applied to retrieve the filtered OPD. in Fig. 3. We adapted the window width, w, to match the desired
cutoff frequency. As a definition of the filter value, we set w to be
the spatial frequency value at which the Hann window reaches
zero. Therefore, a low-pass filter at w c/p yields a Hann window
is 0.15 pixels, which shows an efficient correction. Different grid
diameter of 2wλ/D.
sizes were tested, but N larger than 7 do not provide any quanti-
Using this method of filtering is analogous to choosing the
tative improvements of the distortion correction; as such, we use
number of actuators and the influence function of the equiva-
this value from here on out. This calibration method can be easily
lent DM. With a filter cutoff frequency at w c/p, we modeled a
implemented on any instrument already hosting a Zernike WFS,
DM with 2w actuators. With a Hann window, the full width at
such as VLT/SPHERE (Beuzit et al. 2019) and the RST Coron-
half maximum of the corresponding actuators’ influence func-
agraphic Instrument (CGI; Kasdin et al. 2020), or on test beds,
tion is D/2w. Figure 4 highlights the radial profile of the corre-
such as the High Contrast Imaging Testbed (HCIT; Ruane et al.
sponding influence function, computed by a Fourier transform
2020). This calibration is, in fact, applicable to any wavefront
of the filtering window. The influence function is Gaussian-like
sensor that provides measurements in the pupil plane, such as the
and is therefore a good approximation of the influence function
pyramid WFS (Ragazzoni 1996), or more generally with most of
of classical DMs based on either piezo-stack actuators or micro-
the class of Fourier-based WFSs (Fauvarque et al. 2016).
electro-mechanical systems (MEMS). We could have chosen dif-
ferent filter functions for more realistic simulations of specific
3.4. Low-pass filtering DM architectures.
Aliasing effects will appear when a wavefront measurement at
very high spatial frequency is applied on a much lower-order DM 4. Results
(or equivalent). This was previously highlighted for NCPA cor-
rection with ZELDA in VLT/SPHERE, where the OPD maps had In this section we present our results in different configurations.
to be either low-pass filtered in the Fourier space (N’Diaye et al. We demonstrate first a static configuration that corresponds to
A170, page 5 of 14A&A 649, A170 (2021)
the compensation for various static phase maps, and second, ter can be optional for up to five iterations, for example to record
a dynamic configuration where we introduce residual atmo- a flat position to perform other science later. However, the loop is
spheric aberrations representative of the on-sky performance of no longer stable and diverges after about seven iterations when
the SPHERE ExAO (SAXO) system. In this configuration we no filter is applied and after 15–20 iterations for w = 200 c/p.
tried to correct for the ExAO residual aberrations in pseudo-real We note that, even though the w = 200 c/p filter maintains all the
time by using the tools developed in the static case. Finally, we spatial frequencies measured by ZELDA, the attenuation of the
looked at the improvement in MITHiC coronagraphic images highest frequencies by the apodization of the filtering window
following a fine residual aberration compensation. allows for a significant stabilization of the loop. We attribute this
For all the results hereafter, the tip and tilt aberrations have effect to a misestimation or mis-correction of the highest spatial
been removed. While ZELDA is highly sensitive to these modes, frequencies – which originate from pupil edge effects aliasing
in most AO systems they are managed by a dedicated tip and tilt since the correction maximum frequency is at 137 c/p – as well
sensor and/or a dedicated mirror that runs at a very high fre- as higher-order distortion residuals since we only calibrate for
quency. Furthermore, MITHiC is affected by a small amount of linear transformations.
thermal turbulence inside its enclosure, which induces tip and To emphasize the need for the pupil distortion calibration
tilt variations of typically 2–3 nm RMS in the 5–10 Hz frequency detailed in Sect. 3.3, we present the convergence results with-
range. These variations appear at a higher frequency than our out the distortion correction in Fig. 6. In these tests, the mea-
correction loop (currently ∼1 Hz), so we do not address them sured OPD map is simply filtered, scaled down, and applied
directly in the present work. to the SLM. For the two smallest w (5 and 20 c/p), the results
are strictly identical to the previous test. For larger w, how-
ever, the behavior is very different: After reaching a minimum
4.1. Static aberrations
around 5 nm RMS, the standard deviation quickly diverges and
We addressed the correction of the quasi-static aberrations on converges to values larger than 20 nm RMS after ten iterations.
MITHiC, which are illustrated in Fig. 5 (top left). The stan- The divergence is caused by the apparition of high-spatial-
dard deviation in the OPD inside the pupil, σOPD , is typically frequency wrinkles that slowly degrade the wavefront quality.
35 nm RMS at the beginning of the correction step. With the The issue remains insignificant for w = 20 c/p, corresponding
application of the closed-loop correction procedure, including to a VLT/SPHERE-like case, but becomes critical for w larger
the geometrical distortion correction and for various values of than 75 c/p. If the computation of an interaction matrix can be
w, we obtained the results shown in Fig. 5. The top plot shows performed to get rid of these ripples, new adaptive ELTs might
the OPD maps from ZELDA at three representative iterations of struggle to construct them due to the absence of an appropriate
the procedure with w = 115 c/p. The bottom plot displays the calibration source (Heritier et al. 2018). Our calibration there-
evolution of σOPD at different iterations. fore shows another way of sensing the distortion modes and
The general behavior is identical for most values of w, with improving the correction with on-sky measurements with a sim-
a steady decrease in σOPD during the first two or three itera- ple implementation as long as the phase errors are not too large.
tions followed by a stabilization during the following iterations. In systems with large phase errors, such as a system without a
This is due to the limited linearity range of ZELDA, which is first step of AO correction, further strategies would have to be
reduced compared to other classical WFSs, such as the Shack- explored. For example, to measure the distortion, the position
Hartmann WFS. As highlighted in N’Diaye et al. (2013), the lin- of the introduced Gaussian spots could be estimated through the
ear behavior of ZELDA is typically limited to ±0.03λ (±20 nm turbulence by averaging turbulence with long exposures. Further
here), and larger absolute values of phase error will always be studies would have to be performed to assess the precision of
underestimated by the second-order reconstruction. As long as such measurements.
there is no phase wrapping, the estimation will always favor a Based on the successful implementation of our wavefront
decrease in the wavefront error, which means that a correction correction procedure, we highlight one emblematic case of
in a closed loop will eventually converge. The same behavior quasi-static aberrations where a very large number of degrees
is used for co-phasing techniques proposed in multi-wavelength of freedom for wavefront correction would be particularly inter-
approaches with the ZWFS (Vigan et al. 2011; Cheffot et al. esting for future applications: the compensation for residual co-
2020). Ultimately, the usable capture range of ZELDA in a phasing errors for telescopes with segmented primary mirrors.
closed loop depends on the phase shift imposed by the mask and To test ZELDA in this practical case, we selected a pattern that
ranges between −0.14λ and +0.36λ for the MITHiC prototype combines typical NCPAs and a segmented pupil with random tip,
(N’Diaye et al. 2016). tilt, and piston on individual segments on the MITHiC SILIOS
For w between 75 and 137 c/p, σOPD stabilizes around phase screen. The results of the correction procedure with w =
∼1.9 nm RMS, which is above the theoretical limit of 115 c/p are illustrated in Fig. 7. The 3 nm RMS residual wave-
0.76 nm RMS. Most of the residual aberrations can be attributed front error after a few iterations shows the ability of ZELDA to
to low-order aberrations from the internal turbulence on measure fine differential piston errors. The high 115 c/p cutoff
MITHiC, vibrations of the bench, and dust particles on opti- value for w ensures a good correction for the segment disconti-
cal surfaces that create small errors in the ZELDA reconstruc- nuities.
tion. For w = 20 c/p, the convergence is slower than for The use of ZELDA for fine segment co-phasing was pro-
higher filtering values and it does not quite reach this low value posed by Janin-Potiron et al. (2017); in their approach, they
of 1.9 nm RMS, which indicates that there is a non-negligible measure the residual piston, tip, and tilt of individuals segments
amount of aberrations with spatial frequencies between 20 and and then apply the correction directly on the segments using their
75 c/p. The w = 5 c/p case is even more extreme, with an even control actuators. In our case, as we benefit from a large number
slower decrease in σOPD and a convergence toward a larger value of subapertures and actuators, we go one step further and correct
of ∼14 nm RMS after 15 iterations. not only for the piston, tip, and tilt, but also for higher-order
The w = 200 c/p and the no-filter curves show the same phase errors such as low-order aberrations on individual seg-
steady decrease during the first iterations, showing that the fil- ments. On a pupil with 30 segments across the diameter, such
A170, page 6 of 14R. Pourcelot et al.: Calibration of residual aberrations in exoplanet imagers with large numbers of degrees of freedom
After 0 iterations After 3 iterations After 7 iterations 30
20
10
OPD [nm]
0
10
20
30
40 w = 5c/p w = 137c/p
35 w = 20c/p
w = 75c/p
w = 200c/p
No filter
w = 115c/p SLM resolution limit
30
[nm RMS]
25
20
15
OPD
10
5
00 5 10 15
Iteration #
Fig. 5. Bench residual aberration compensation in a closed loop with the pupil distortion correction and a filter of 115 c/p. Top row: wavefront
measurements obtained with ZELDA at iterations 0 (initial aberration), 3, and 7. Bottom plot: OPD standard deviation in the pupil as a function
of iteration number and for various values of filtering. A filter value of 20 c/p (orange) simulates a VLT/SPHERE-like DM cutoff filter. For each
measurement, the global tip and tilt are subtracted.
as the ELT, 120 actuators across the pupil diameter will yield To explore several simple, yet realistic, AO systems, we
roughly 4 × 4 actuators per segment, which would allow for sub- included a delay, d, expressed in numbers of frames. The tur-
segment aberration correction. The curve in Fig. 7 that is the bulence starting point on the phase screen was identical for
closest to this case is the orange curve, simulating a case with 40 each experiment. At each time step, k, the following steps were
actuators for 11 segments. This sort of possibility could prove performed: (i) acquire a phase measurement, ϕk ; (ii) compute
extremely valuable for exoplanet imagers on future ELTs. the corresponding correction, Ψk , using the procedure from
Sect. 3.2; (iii) move the phase screen by a step of δ, simulating
the wind-induced motion of the atmosphere in a 1/1500 s inter-
4.2. Temporal error analysis with residual ExAO aberrations
val on an eight-meter-size telescope (a lateral shift of a×δ is also
When using ZELDA, it is also worth considering the compen- applied, a denoting a random number in the range [−1 : 1]); and
sation for turbulence residuals in real time, for example down- (iv) apply the correction, Ψk−d , on the SLM with a gain of 0.5.
stream an ExAO system that provides first-stage correction. Figure 8 presents σOPD for the standard deviation as seen by
Similarly to the co-phasing case, this approach could potentially ZELDA in the OPD as a function of iterations for three differ-
provide a second-stage WFS to increase the ExAO correction ent cases. While the starting standard deviation in the OPD is
level in extremely demanding cases. between 21 and 23.5 nm RMS for all the configurations, there is
The phase screen installed on MITHiC provides an exter- a clear reduction in the wavefront error after fewer than ten itera-
nal ring of engraved turbulence that simulates residuals from the tions. However, the mean level reached for each curve that repre-
VLT/SAXO system (Fusco et al. 2006) in median seeing condi- sents a filtered OPD is different. The highest threshold at 16.9 nm
tions at the Paranal Observatory. This ring can be rotated at a RMS is reached with the two-frame delay configuration with
controlled speed to emulate the wind speed. To overcome the the lowest filter at 44 c/p (in red): The controllable modes are
bench limitation in terms of temporal frequency (∼1 Hz), we restricted by the low-pass filter. As a result, the contribution to
discretized the steps to simulate a VLT/SPHERE residual tur- wavefront error coming from uncontrolled high spatial frequen-
bulence for an ExAO system, which, in practice, means that the cies, or fitting error, is higher. By increasing the filter frequency
screen rotates very slowly and in discrete steps that are synchro- cutoff to 55 c/p (in blue) while maintaining the two-frame delay,
nized with the ZELDA measurements. The delay associated with we reduced this fitting error and therefore improved the final
one-frame processing is therefore 0.67 ms. correction quality to 15.6 nm RMS. We finally considered the
A170, page 7 of 14A&A 649, A170 (2021)
After 0 iterations After 3 iterations After 7 iterations 20
15
10
5
OPD [nm]
0
5
10
15
20
40
w = 5c/p w = 137c/p
35 w = 20c/p w = 200c/p
w = 75c/p No filter
30 w = 115c/p SLM resolution limit
[nm RMS]
25
20
15
OPD
10
5
00 5 10 15
Iteration #
Fig. 6. Bench residual aberration compensation in a closed loop without any correction of the pupil distortion and with a filter of 115 c/p. Top row:
wavefront measurements with ZELDA at iterations 0 (initial aberration), 3, and 7. Bottom plot: OPD standard deviation in the pupil as a function
of iteration number and for various values of filtering. The filter value of 20 c/p (orange) simulates a VLT/SPHERE-like DM cutoff filter. For each
measurement, the global tip and tilt are subtracted.
hypothetic case where the lag error could have been reduced to the best correction is provided by the reduced lag simulation
one frame (in green) with the filter at 44 c/p. This lag reduction (in green). The peak close to 20 c/p corresponds to the cutoff
provides a clear improvement in the correction quality, which frequency of the VLT/SAXO system that was simulated by the
reduces to 14.6 nm RMS, yielding a gain of 2.3 nm RMS, on rotating phase screen.
average, with respect to its two-frame lag counterpart. The final In this experiment we performed two camera acquisitions
threshold in all three configurations is noticeably higher than for each phase measurement: one without the ZELDA mask to
what was achievable in Sect. 4.1 due, in large part, to the fitting obtain a clear pupil image and one with the mask. This approach
error of approximately 10 nm. Furthermore, we used a loop gain is not really suitable for an on-sky system as moving a mask at
of 0.5, which will undeniably limit the ultimate performances in this cadence would be difficult. Furthermore, it would need to
a dynamic case. We did not identify the exact origin of the peri- work solely based on the ZELDA image to maximize efficiency.
odic pattern shown in Fig. 8. Nevertheless, the fact it is identical Relying on a clear pupil measurement made at the beginning
for each realization when the same turbulence is used leads us for the rest of the sequence has been investigated on MITHiC;
to conclude that it is inherent to the phase screen rather than a unfortunately, it causes the correction to diverge, due to Fres-
result of our analysis. nel propagation effects that modify the pupil intensity distribu-
Figure 9 provides an additional description of the distribu- tion, and biases the phase reconstruction. Based on the work of
tion of aberrations with spatial frequency in these three different Vigan et al. (2019), we expect this effect to not be present in
cases after 40 ms of simulated time, which is equivalent to 60 VLT/SPHERE data. In Fig. C.1 of that paper, the authors show
iterations. The plateaus reached in Fig. 8 show that other itera- the on-sky clear pupil image that they use for their correction
tion values would yield the same power density spectrum (PSD) sequence, which shows no sign of the turbulent phase. Although
behavior. The gain with respect to the initial phase step (in blue) it is not directly reported in their work, they confirm that the
is clear for the three PSD curves in the low- and mid-spatial fre- clear pupil image is highly stable over time (private communi-
quencies, between 0 and 20 c/p. Between 10 and 40 c/p are the cation). However, MITHiC has not been designed to minimize
differences in terms of the OPD of Fig. 8: For the two-frame these amplitude effects, and the test bed is very sensitive to mis-
delay curves, the stronger apodization of the filter at 44 c/p trans- alignment or to phase errors along the optical axis because we
lates into a higher PSD around the 20–40 c/p area. Except for scale down the eight-meter-class telescope turbulence on the 5
the low frequencies that are crippled by the bench turbulence, mm test bed pupil.
A170, page 8 of 14R. Pourcelot et al.: Calibration of residual aberrations in exoplanet imagers with large numbers of degrees of freedom
After 0 iterations After 3 iterations After 7 iterations 30
20
10
OPD [nm]
0
10
20
30
30
w = 5 c/p w = 137 c/p
25 w = 20 c/p w = 200 c/p
w = 75 c/p No filter
w = 115 c/p SLM resolution limit
20
[nm RMS]
15
OPD
10
5
00 5 10 15
Iteration #
Fig. 7. Compensation in a closed loop of a pattern simulating co-phasing errors of a segmented mirror using a low-pass filter value of 115 c/p.
The pattern is one of the static configurations of the MITHiC phase screen (see Appendix A.1). Top row: wavefront measurements obtained with
ZELDA at iterations 0, 2, and 6. Bottom plot: OPD standard deviation in the pupil as a function of iteration number.
4.3. Impact on coronagraphic images correction results in a substantial improvement of the diffrac-
tion attenuation of the coronagraph, with a visible decrease in
The contrast performance of coronagraphs is crucially depen- the amount of light scattered in speckles all over the field of
dent on the quality of the incoming wavefront at the level of view. Before calibration, the focal plane shows diffraction rings,
the FPM. Our bench calibration procedure allows for an accu- speckles, and pinned speckles (Sivaramakrishnan et al. 2002)
rate compensation for the MITHiC aberrations down to a few up to 15λ/D. After calibration, the brightness of the speckles
nanometer RMS. With such a high level of wavefront correction, and residual diffraction appears largely attenuated, indicating an
MITHiC becomes diffraction-limited and should offer a signifi- improvement in the CLC performance. Apart from the four ghost
cant attenuation of the diffraction with the CLC. While the CLC images, some irregular speckle patterns are visible at larger sepa-
provides a moderate contrast (compared with the apodized-pupil rations in the coronagraphic images. This indicates the presence
Lyot coronagraph; Soummer 2005), and a moderate inner work- of residual high-spatial-frequency aberrations that could origi-
ing angle (compared with the vortex coronagraph; Mawet et al. nate from NCPAs between the ZELDA arm and the coronagraph
2005), it remains a user-friendly coronagraph for simple coro- arm.
nagraphic imaging in a monochromatic light system that works The gain in contrast performance of the CLC is confirmed
with a circular pupil, such as MITHiC. by the PSF and coronagraphic image profiles in Fig. 11, which
We performed coronagraphic measurements in the initial show a clear distinction before and after residual aberration com-
configuration of MITHiC (i.e., without aberration compensa- pensation. This is particularly visible for the coronagraphic pro-
tion and after five iterations of the compensation procedure with files, with a mean gain of a factor of five between 3 and 15λ/D.
w = 125 c/p), which means that most of the controllable spa- We compare the aberration-corrected coronagraphic profile to
tial frequencies with the SLM are corrected. Figure 10 shows a CLC simulation that takes a residual OPD map measured
the coronagraphic images before and after the aberration com- with ZELDA prior to the coronagraphic measurement as input.
pensation. Due to the use of a beam splitter to send part of Between 3 and 7λ/D, our measurements are clearly at the theo-
the beam to ZELDA, the left part of the images is dominated retical limit of the CLC implemented on MITHiC. At larger sep-
by relatively bright ghosts, which are circled in blue. The two arations, there is a slow departure between the theoretical and
symmetric ghosts circled in white on either side of the PSF are experimental profiles, which can be explained by some residual
induced by the other beam splitter located in the collimated beam aberrations and by the readout noise floor of the camera above
that hits the SLM. Ignoring the ghosts, the residual aberration ∼12λ/D.
A170, page 9 of 14A&A 649, A170 (2021)
25
20
[nm RMS]
15
10
OPD
1-frame lag; 44 c/p
2-frames lag; 44 c/p
5 2-frames lag; 55 c/p
SLM resolution limit
0 0.0 0.1 0.2 0.3 0.4 0.5 0.6
Elapsed simulated time [s]
Fig. 8. Evolution of the standard deviation in the OPD as a function of iteration when correcting VLT/SPHERE residual atmospheric turbulence
with a wind speed of 10 m s−1 and an iteration lag of 0.67 ms for 0.6 s (1000 iterations). The green curve shows the case with a filter at 44 c/p and a
one-frame lag, the red curve with a filter at 44 c/p and a two-frame lag, and the blue curve with a filter at 55 c/p and a two-frame lag. The correction
loop starts at time 0.
102 obtained with ZELDA and complemented by a simple and fast
Iteration 0 distortion calibration procedure. Our results demonstrate that
101 1-frame lag; 44 c/p
Power spectrum (nm/cycles/pupil)2
this procedure is very efficient at compensating for the static
2-frames lag; 44 c/p
2-frames lag; 55 c/p phase patterns of the bench and remaining stable once a mini-
100 mum has been reached. With the current procedure, the correc-
10 1 tion for the wavefront errors in a static case reaches a level of
∼2.6 nm RMS.
10 2 The pupil distortion calibration is a crucial step. While such
effects are naturally taken into account in systems relying on a
10 3 classical interaction matrix, this is not the case here. We instead
used a two-frame calibration where Gaussian reference spots
10 4
are introduced on the SLM. Based on their known input posi-
tion, we were able to easily calibrate the distortions in the sys-
10 5
100 101 102 tem and subsequently correct for them when applying the phase
Spatial frequency (cycles/pupil) corrections on the SLM. Without this calibration, the wavefront
Fig. 9. PSD of the OPD maps at simulated times of 0 ms (cyan) and errors quickly diverge in the phase compensation procedure due
40 ms for the two-frame delay with w = 55 c/p (blue) and w = 44 c/p to the apparition of high-spatial-frequency ripples induced by the
(red) and the one-frame delay with w = 44 c/p (green). The vertical distortion.
black line represents the cutoff frequency at 55 c/p. We also demonstrate a dynamic “fast-ZELDA” mode with a
more dynamic case where the sensor is used to compensate for
the residuals of a VLT/SPHERE-like ExAO system. This setup
5. Conclusion acts as a second-stage correction that could possibly be used in
very demanding science cases. For this demonstration, we used
The wavefront quality is a driving parameter in the performance the MITHiC phase screen, which allows for the simulation of
of high-contrast imaging systems that use coronagraphy to atten- VLT/SPHERE-like turbulence residuals. We simulated a system
uate telescope diffraction on an observed star image. ZELDA has running at 1.5 kHz with a delay of one or two frames in the
already been demonstrated to be a powerful secondary WFS that correction of the residuals. The results show an efficient wave-
can calibrate aberrations unseen by an ExAO system. front correction that is stable over a thousand iterations. While
In the present work, we demonstrated the ability of ZELDA the simulated residual aberrations present a wavefront error of
to work in a closed loop with an SLM to perform a second-stage around 20–25 nm RMS, the closed-loop correction, dominated
AO correction, controlling a very large number of degrees of by the uncontrollable fitting errors and the bench internal turbu-
freedom. Thanks to the use of a high-density SLM, the MITHiC lence, reduces this to approximately 15 nm RMS.
test bed offers tens of thousands of DM-like actuators for wave- Our setup on MITHiC presents some shortcomings. Firstly,
front correction. While these numbers appear large by today’s we work with an SLM in monochromatic light. From the
standards, they are in line with the expectations for high-contrast WFS point of view, similar results could certainly be obtained
imaging of Earth-like planets with future ground-based ELTs. with a reasonable broadband since ZELDA has been shown to
Rather than building a large interaction matrix, we instead imple- accommodate bandwidths of 20% well (N’Diaye et al. 2013,
mented a direct wavefront correction based on the OPD maps 2016). However, the SLM is chromatic and cannot be used in
A170, page 10 of 14R. Pourcelot et al.: Calibration of residual aberrations in exoplanet imagers with large numbers of degrees of freedom
Aberrations not corrected Aberrations corrected 10
15 2
10
10 3
5
10 4
Separation [ /D]
Contrast
0
10 5
5
10 6
10
15 10 7
15 10 5 0 5 10 15 15 10 5 0 5 10 15
Separation [ /D] Separation [ /D]
Fig. 10. Coronagraphic images obtained before (left) and after (right) compensation of the bench aberrations. The compensation is performed with
a low-pass filtering value of 125 c/p. The CLC FPM has a radius of 2.7λ/D, the footprint of which is circled in black. The left part of the images
is contaminated by several ghosts, circled in blue, which were introduced by the beam splitter located between the SLM and the coronagraphic
FPM, which is used to send part of the beam to ZELDA. The speckles circled in white are created by ghost reflections in the cubic beam splitter
in front of the SLM.
100 the amplitude in the pupil, as well as on whether or not taking
PSF - with aberr. the acquisition without the mask is mandatory. Nevertheless, we
PSF - without aberr.
10 1
CLC - with aberr.
could foresee a fast synchronized tip and tilt mirror that would
temporally switch the beam from one configuration to the other
CLC - without aberr. or a setup with a beam splitter to perform the two simultaneous
10 2 CLC - simulation measurements. Such an idea has been developed with the vector
ZWFS, which splits the beam into the two circular polarizations,
10 3
which face respectively a +π/2 and −π/2 Zernike phase mask.
Contrast
(Doelman et al. 2019).
10 4 The coronagraphic measurements with the CLC on MITHiC
confirm the extreme efficiency of our residual aberration com-
10 5 pensation. Despite its simple design, the CLC becomes an effi-
cient solution for diffraction attenuation in monochromatic light
10 6 and with an unobstructed circular pupil. Combined with ZELDA
for the fine phase correction, this setup is now the baseline for the
10 7 forthcoming studies with MITHiC, which are centered on labo-
ratory investigations of fiber injection procedures for the High-
Resolution Imaging and Spectroscopy of Exoplanets (HiRISE)
10 8
0 5 10 15 project (Vigan et al. 2018; Otten et al. 2021). These investiga-
Separation [ /D] tions will advance wavefront control techniques for future exo-
planet imagers.
Fig. 11. PSF and coronagraphic profiles before (black) and after (red)
compensation of the bench aberrations. The profiles for the PSF and
coronagraphic data are obtained with the azimuthal average and stan- Acknowledgements. AV acknowledges support from Région Provence-Alpes-
dard deviation of the images, respectively. The profiles are compared Côte d’Azur, under grant agreement 2014-02976, for the ASOREX project. AV,
ME, GO and ML acknowledge funding from the European Research Council
to the theoretical simulated profile (blue) obtained using as input an (ERC) under the European Union’s Horizon 2020 research and innovation pro-
OPD map measurement with the bench aberration compensation prior gramme (grant agreement No. 757561). ER and JH have benefited from the
to the coronagraphic measurement. The ghosts visible in Fig. 10 are support of the A*MIDEX university foundation while following the Erasmus
masked when computing the profiles. The grayed out part of the plot Mundus Europhotonics Master program of the European Union.
corresponds to the area masked by the FPM in the coronagraphic
images.
References
Avenhaus, H., Quanz, S. P., Garufi, A., et al. 2018, ApJ, 863, 44
a broadband setup. Broadband demonstration would require the Beuzit, J. L., Demailly, L., Gendron, E., et al. 1997, Exp. Astron., 7, 285
implementation of a classical high-density DM. Secondly, our Beuzit, J. L., Vigan, A., Mouillet, D., et al. 2019, A&A, 631, A155
measurement procedure requires two camera acquisitions for Bloemhof, E. E., & Wallace, J. K. 2003, in Proc. SPIE, eds. R. K. Tyson, & M.
Lloyd-Hart, SPIE Conf. Ser., 5169, 309
one OPD measurement: with and without the ZELDA mask. Caillat, A., Pascal, S., Tisserand, S., et al. 2014, in Advances in Optical and
This would be an issue when running a system at several kilo- Mechanical Technologies for Telescopes and Instrumentation, SPIE Conf.
hertz. Further studies need to be performed on the stability of Ser., 9151, 91511F
A170, page 11 of 14A&A 649, A170 (2021) Carlotti, A., Hénault, F., Dohlen, K., et al. 2018, in Ground-based and Airborne N’Diaye, M., Dohlen, K., Fusco, T., & Paul, B. 2013, A&A, 555, A94 Instrumentation for Astronomy VII, SPIE Conf. Ser., 10702, 107029N N’Diaye, M., Dohlen, K., Caillat, A., et al. 2014, in Adaptive Optics Systems IV, Chauvin, G., Desidera, S., Lagrange, A. M., et al. 2017, A&A, 605, L9 eds. E. Marchetti, L. M. Close, & J. P. Vran, SPIE Conf. Ser., 9148, 91485H Cheetham, A., Bonnefoy, M., Desidera, S., et al. 2018, A&A, 615, A160 N’Diaye, M., Vigan, A., Dohlen, K., et al. 2016, A&A, 592, A79 Cheffot, A.-L., Vigan, A., Leveque, S., & Hugot, E. 2020, Opt. Exp., 28, Nielsen, E. L., De Rosa, R. J., Macintosh, B., et al. 2019, AJ, 158, 13 12566 Öberg, K. I., Murray-Clay, R., & Bergin, E. A. 2011, ApJ, 743, L16 Chilcote, J., Barman, T., Fitzgerald, M. P., et al. 2015, ApJ, 798, L3 Otten, G. P. P. L., Vigan, A., Muslimov, E., et al. 2021, A&A, 646, A150 Crepp, J. R., Johnson, J. A., Fischer, D. A., et al. 2012, ApJ, 751, 97 Paul, B., Mugnier, L. M., Sauvage, J. F., Ferrari, M., & Dohlen, K. 2013, Opt. Davies, R., Schubert, J., Hartl, M., et al. 2016, in Ground-based and Airborne Exp., 21, 31751 Instrumentation for Astronomy VI, SPIE Conf. Ser., 9908, 99081Z Perrin, M. D., Duchene, G., Millar-Blanchaer, M., et al. 2015, ApJ, 799, 182 de Boer, J., Salter, G., Benisty, M., et al. 2016, A&A, 595, A114 Phillips, M. W., Tremblin, P., Baraffe, I., et al. 2020, A&A, 637, A38 Doelman, D. S., Fagginger Auer, F., Escuti, M. J., & Snik, F. 2019, Opt. Lett., Piso, A.-M. A., Pegues, J., & Öberg, K. I. 2016, ApJ, 833, 203 44, 17 Ragazzoni, R. 1996, J. Mod. Opt., 43, 289 Dohlen, K. 2004, in EAS Publications Series, eds. C. Aime, & R. Soummer, EAS Roddier, F. 2004, Adaptive Optics in Astronomy Publ. Ser., 12, 33 Roddier, F., & Roddier, C. 1997, PASP, 109, 815 Fauvarque, O., Neichel, B., Fusco, T., Sauvage, J.-F., & Girault, O. 2016, Optica, Ronzitti, E., Guillon, M., de Sars, V., & Emiliani, V. 2012, Opt. Exp., 20, 17843 3, 1440 Rousset, G., Lacombe, F., Puget, P., et al. 2003, in Adaptive Optical System Fusco, T., Rousset, G., Sauvage, J.-F., et al. 2006, Opt. Exp., 14, 7515 Technologies II, eds. P. L. Wizinowich, & D. Bonaccini, SPIE Conf. Ser., Gach, J. L., Boutolleau, D., Caillat, A., et al. 2019, ArXiv e-prints 4839, 140 [arXiv:1910.00374] Ruane, G., Wallace, J. K., Steeves, J., et al. 2020, J. Astron. Telesc. Instrum. Galicher, R., Rameau, J., Bonnefoy, M., et al. 2014, A&A, 565, L4 Syst., 6, 045005 Ginski, C., Stolker, T., Pinilla, P., et al. 2016, A&A, 595, A112 Sauvage, J.-F., Fusco, T., Guesalaga, A., et al. 2015, Adaptive Optics for Heritier, C. T., Esposito, S., Fusco, T., et al. 2018, MNRAS, 481, 2829 Extremely Large Telescopes IV (AO4ELT4), E9 Herriot, G., Morris, S., Roberts, S., et al. 1998, in Adaptive Optical System Sauvage, J.-F., Fusco, T., Petit, C., et al. 2016, J. Astron. Telescopes Instrum. Technologies, eds. D. Bonaccini, & R. K. Tyson, SPIE Conf. Ser., 3353, 488 Syst., 2, 025003 Herscovici-Schiller, O. 2018, Theses, Observatoire de Paris; PSL Research Schmid, H. M., Bazzon, A., Milli, J., et al. 2017, A&A, 602, A53 University; ONERA, France Shi, F., Balasubramanian, K., Hein, R., et al. 2016, J. Astron. Telescopes Instrum. Houllé, M., Vigan, A., Carlotti, A., Choquet, E., & Cantalloube, F. 2021, A&A, Syst., 2, 011021 accepted [arXiv:2104.11251] Sivaramakrishnan, A., Lloyd, J. P., Hodge, P. E., & Macintosh, B. A. 2002, ApJ, Janin-Potiron, P., N’Diaye, M., Martinez, P., et al. 2017, A&A, 603, A23 581, L59 Johns, M., McCarthy, P., Raybould, K., et al. 2012, in Ground-based and Soummer, R. 2005, ApJ, 618, L161 Airborne Telescopes IV, SPIE Conf. Ser., 8444, 84441H Soummer, R., Aime, C., & Falloon, P. E. 2003a, A&A, 397, 1161 Jovanovic, N., Martinache, F., Guyon, O., et al. 2015, PASP, 127, 890 Soummer, R., Dohlen, K., & Aime, C. 2003b, A&A, 403, 369 Jovanovic, N., Absil, O., Baudoz, P., et al. 2018, in Adaptive Optics Systems Soummer, R., Ferrari, A., Aime, C., & Jolissaint, L. 2007, ApJ, 669, 642 VI, eds. L. M. Close, L. Schreiber, & D. Schmidt, SPIE Conf. Ser., 10703, Stolker, T., Dominik, C., Avenhaus, H., et al. 2016, A&A, 595, A113 107031U Strauß, J., Häfner, T., Dobler, M., Heberle, J., & Schmidt, M. 2016, Physics Kasdin, N. J., Bailey, V. P., Mennesson, B., et al. 2020, SPIE Conf. Ser., 11443, Procedia, 83, 1160, Laser Assisted Net Shape Engineering 9 International 114431U Conference on Photonic Technologies Proceedings of the LANE 2016 Kasper, M., Beuzit, J. L., Verinaud, C., et al. 2010, in Ground-based and Airborne September 19-22, 2016 Fürth, Germany Instrumentation for Astronomy III, SPIE Conf. Ser., 7735, 77352E Thatte, N. A., Clarke, F., Bryson, I., et al. 2016, in Ground-based and Airborne Kasper, M., Gratton, R., Verinaud, C., et al. 2011, Second International Instrumentation for Astronomy VI, SPIE Conf. Ser., 9908, 99081X Conference on Adaptive Optics for Extremely Large Telescopes, 12, Online Traub, W. A., & Oppenheimer, B. R. 2010, in Direct Imaging of Exoplanets, ed. at http://ao4elt2.lesia.obspm.fr S. Seager, 111 Kasper, M., Verinaud, C., & Mawet, D. 2013, in Proceedings of the Third Vernet, E., Cayrel, M., Hubin, N., et al. 2012, in Adaptive Optics Systems III, AO4ELT Conference, eds. S. Esposito, & L. Fini, 8 SPIE Conf. Ser., 8447, 844761 Keppler, M., Benisty, M., Müller, A., et al. 2018, A&A, 617, A44 Vigan, A., & N’Diaye, M. 2018, Astrophysics Source Code Library [record Kervella, P., Montargès, M., Lagadec, E., et al. 2015, A&A, 578, A77 ascl:1806.003] Knutson, H. A. 2007, Nature, 448, 143 Vigan, A., Dohlen, K., & Mazzanti, S. 2011, Appl. Opt., 50, 2708 Konopacky, Q. M., Rameau, J., Duchêne, G., et al. 2016, ApJ, 829, L4 Vigan, A., Bonnefoy, M., Ginski, C., et al. 2016a, A&A, 587, A55 Leboulleux, L. 2018, Theses, Aix-Marseille Universite, France Vigan, A., Postnikova, M., Caillat, A., et al. 2016b, SPIE Conf. Ser., 9909, Lyot, B. 1932, Z. Astrophys., 5, 73 99093F Macintosh, B., Graham, J. R., Ingraham, P., et al. 2014, Proc. Nat. Acad. Sci., Vigan, A., Otten, G. P. P. L., Muslimov, E., et al. 2018, in Ground-based and 111, 12661 Airborne Instrumentation for Astronomy VII, eds. C. J. Evans, L. Simard, H. Macintosh, B., Graham, J. R., Barman, T., et al. 2015, Science, 350, 64 Takami, et al., SPIE Conf. Ser., 10702, 1070236 Maire, A. L., Bonnefoy, M., Ginski, C., et al. 2016, A&A, 587, A56 Vigan, A., N’Diaye, M., Dohlen, K., et al. 2019, A&A, 629, A11 Mawet, D., Riaud, P., Absil, O., & Surdej, J. 2005, ApJ, 633, 1191 Vigan, A., Fontanive, C., Meyer, M., et al. 2021, A&A, in press, https://doi. N’Diaye, M., Dohlen, K., Cuevas, S., et al. 2010, A&A, 509, A8 org/10.1051/0004-6361/202038107 N’Diaye, M., Dohlen, K., Fusco, T., et al. 2012a, in Lab Results of the Circular Wallace, J. K., Rao, S., Jensen-Clem, R. M., & Serabyn, G. 2011, Proc. SPIE, Phase Mask Concepts for High-contrast Imaging of Exoplanets, SPIE Conf. 8126, 81260F Ser., 8450, 84500N Zernike, F. 1934, MNRAS, 94, 377 N’Diaye, M., Dohlen, K., Cuevas, S., et al. 2012b, A&A, 538, A55 Zurlo, A., Vigan, A., Galicher, R., et al. 2016, A&A, 587, A57 A170, page 12 of 14
You can also read