Canopy Extraction and Height Estimation of Trees in a Shelter Forest Based on Fusion of an Airborne Multispectral Image and Photogrammetric Point ...
←
→
Page content transcription
If your browser does not render page correctly, please read the page content below

Hindawi
Journal of Sensors
Volume 2021, Article ID 5519629, 13 pages
https://doi.org/10.1155/2021/5519629

Research Article
Canopy Extraction and Height Estimation of Trees in a Shelter
Forest Based on Fusion of an Airborne Multispectral Image and
Photogrammetric Point Cloud

          Xuewen Wang ,1,2,3 Qingzhan Zhao ,1,2,3 Feng Han,1,2 Jianxin Zhang,4 and Ping Jiang3,5
          1
            College of Information Science & Technology, Shihezi University, Shihezi, China
          2
            Geospatial Information Engineering Research Center, Xinjiang Production and Construction Corps, Shihezi, China
          3
            Industrial Technology Research Institute, Xinjiang Production and Construction Corps, Shihezi, China
          4
            Agricultural Development Service Center of 150 Regiments, Shihezi, China
          5
            College of Mechanical and Electrical Engineering, Shihezi University, Shihezi, China

          Correspondence should be addressed to Qingzhan Zhao; zqz_inf@shzu.edu.cn

          Received 27 January 2021; Revised 25 April 2021; Accepted 19 May 2021; Published 28 June 2021

          Academic Editor: Bahareh Kalantar

          Copyright © 2021 Xuewen Wang et al. This is an open access article distributed under the Creative Commons Attribution License,
          which permits unrestricted use, distribution, and reproduction in any medium, provided the original work is properly cited.

          To reduce data acquisition cost, this study proposed a novel method of individual tree height estimation and canopy extraction
          based on fusion of an airborne multispectral image and photogrammetric point cloud. A fixed-wing drone was deployed to
          acquire the true color and multispectral images of a shelter forest. The Structure-from-Motion (SfM) algorithm was used to
          reconstruct the 3D point cloud of the canopy. The 3D point cloud was filtered to acquire the ground point cloud and then
          interpolated to a Digital Elevation Model (DEM) using the Radial Basis Function Neural Network (RBFNN). The DEM was
          subtracted from the Digital Surface Model (DSM) generated from the original point cloud to get the canopy height model
          (CHM). The CHM was processed for the crown extraction using local maximum filters and watershed segmentation. Then,
          object-oriented methods were employed in the combination of 12 bands and CHM for image segmentation. To extract the tree
          crown, the Support Vector Machine (SVM) algorithm was used. The result of the object-oriented method was vectorized and
          superimposed on the CHM to estimate the tree height. Experimental results demonstrated that it is efficient to employ point
          cloud and the proposed approach has great potential in the tree height estimation. The proposed object-oriented method based
          on fusion of a multispectral image and CHM effectively reduced the oversegmentation and undersegmentation, with an increase
          in the F-score by 0.12–0.17. Our findings provided a reference for the health and change monitoring of shelter forests as well.

1. Introduction                                                       venting land desertification, such as the Three-North Shelter-
                                                                      belt Project (TNSP) and the Grain to Green Program (GGP)
Shelter forests are considered the green barriers at the edge of      [2, 3]. Therefore, monitoring the growth parameters of shel-
deserts, which are able to prevent land desertification and            ter forests has become crucial. Among these parameters, tree
provide wind proofing and sand fixation. Thus, they play                height is an important indicator of shelter forest structural
an indispensable role in enhancing the self-regulation ability        characteristics and is essential in the estimation of canopy
of the ecosystem and slowing down the expansion of land               density and aboveground biomass [4, 5]. The rapid and accu-
desertification. With the degradation of shelter forests due           rate extraction of tree heights of shelter forests is of great
to man-made destruction and climate change, the prevention            significance to maintain desert ecosystems.
of land desertification has become more urgent [1]. To                      For the estimation of tree height, manual measurement
improve the ecological environment and reduce natural                 and satellite remote sensing methods cannot cater to the
disasters, the Chinese government has also successively               needs of forestry management departments for monitoring
implemented ecological restoration projects aimed at pre-             products, such as thematic maps of tree height. Traditionally,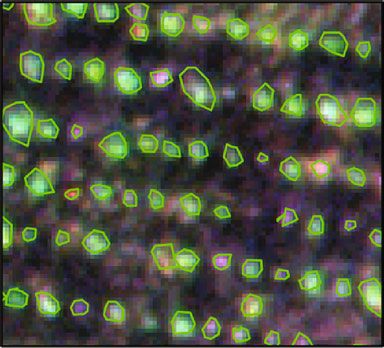
2                                                                                                             Journal of Sensors

heights of individual trees are obtained using the ground        focuses on the applicability of generating DEM only based
measurement method, in which the tree height is measured         on photogrammetric point clouds.
with a laser range finder and other measuring equipment,              To date, many scholars have conducted researches on
allowing higher accuracy of tree height measurement results      individual tree height estimation methods under different
to be obtained, but consuming significant manpower and            woodland scenarios based on the CHM generated by point
material resources [6]. The rapid development of high-           cloud data. Brieger et al. [21] used UAV photogrammetric
resolution remote sensing technology not only improves           point cloud data to generate a CHM, selecting three types
the efficiency of the tree height estimation but also provides     of stand data about sparse deciduous forest, dense deciduous
a wider range of data sources, including WorldView-2 [7]         forest, and dense mixed forest, and used local maximum fil-
and GF-2 [8], which have been used to prove the potential        ters (LMF) in variable window size for the tree height estima-
of spaceborne satellite imagery in the estimation of tree        tion. Huang et al. [22] used photogrammetric point clouds to
height. For satellite data, researchers use a high-precision     generate the DEM and Digital Surface Model (DSM) through
Digital Elevation Model (DEM) to assist in generating a can-     Triangulated Irregular Network (TIN) interpolation to
opy height model (CHM) [8–10]. But the drawbacks of DEM          obtain the CHM and estimated tree height with LMF. In leaf-
are obvious: low data accuracy, the highest of which is only     less and sparse forest areas, it is found to be difficult to recon-
30 m [11], low resolution, and limited ability to display the    struct the three-dimensional (3D) structure of the forest
subtle changes in the topography and generate the CHM in         areas, resulting in low accuracy of the tree height estimation.
the forest area of the complex terrain. Xu et al. [12] built a   In contrast, in forest areas with sufficient leaves, the accuracy
high-precision DEM from the point cloud generated by Light       of tree height estimation is greatly improved, confirming the
Detection and Ranging (LiDAR) and then subtracted the            significant potential of photogrammetric point clouds in the
DEM from the DSM generated from the photogrammetric              estimation of individual tree heights of shelter forests. These
point cloud to obtain CHM. LiDAR can penetrate the shelter       studies are based on the CHM generated by the point cloud
forest canopy to the interior and the ground through laser       for individual tree height estimation, for which, irrespective
echoes, thereby obtaining vertical forest structure informa-     of the algorithm used, individual trees will be subject to over-
tion, which is beneficial to generate a high-precision DEM.       segmentation and undersegmentation [21, 23]. This is more
However, the approach is neither economically optimal,           obvious in broad-leaved forests, in which the canopy of an
which is because the LiDAR data is more expensive and not        individual tree has multiple vertices and multiple maximum
applicable in large-scale shelter forest monitoring. Further-    values, which will cause oversegmentation.
more, when there exist several influential factors, such as            Therefore, high accuracy of tree crown extraction is a
clouds covering, the satellite data is difficult to deliver for-   prerequisite for the high-precision tree height estimation.
estry monitoring products necessary for forestry manage-         The Object-Based Image Analysis (OBIA) uses the segmented
ment at a specific time.                                          object as the basic classification unit, and makes full use of the
    Unmanned aerial vehicle (UAV) images with a high             object’s spectrum and texture. Compared with the traditional
overlap rate can generate photogrammetric point clouds with      pixel-based classification method, it can effectively improve
lower cost and higher economic benefits. The image data of        the classification accuracy. Franklin [24] achieved the result
the shelter forest is updated in real time to guarantee large-   that overall classification accuracy of approximately 50%,
scale flight operations as planned. The CHM generated by a        60%, and 80%, respectively, for nine commercial coniferous
UAV photogrammetric point cloud shows good perfor-               trees by employing pixel-based unsupervised clustering,
mance in the tree height estimation [13–15]. However, the        supervised maximum likelihood classifications, and OBIA of
photogrammetric point cloud is generated by image match-         UAV-based multispectral imagery. No matter which classifi-
ing, and the forest structure is allowed to be reconstructed     cation method is used, the accuracy of near-infrared spectros-
only when the distance between trees is far enough to identify   copy is better than using RGB band alone, which confirms that
the ground between and below the canopy. Moreover, the           multispectral data has an unique advantage over RGB in
CHM generated from a UAV photogrammetric point cloud             describing the canopy. Thus, it is theoretically possible to com-
usually underestimates tree height [16, 17]. To meet eco-        bine point clouds with multi/hyperspectral remote sensing
nomic benefits and data requirements, obtaining high-             images to extract tree canopy to reduce the oversegmentation
precision DEM through photogrammetric point clouds has           and undersegmentation of individual trees.
become a key issue. In the meantime, Radial Basis Function            In view of the above problems, our research objectives are
Neural Network (RBFNN) with excellent spatial interpola-         to solve the problem of low DEM accuracy due to tree canopy
tion ability provides the possibility for this. RBFNN has been   occlusion by using RBFNN interpolation prediction, and to
applied in hydrological data spatial interpolation prediction    combine point cloud with multispectral data by using OBIA
[18], soil element interpolation [19], point cloud interpola-    to reduce oversegmentation and undersegmentation of the
tion [20], etc. Zhao et al. [20] used RBFNN to interpolate       canopy. Three areas are selected for experimental verifica-
the point cloud of LiDAR, and obtained the results that the      tion, and the main contributions of this work are listed as
point cloud elevation prediction coefficient (R2 ) was 0.887,      follows:
and the root mean square error (RMSE) was 0.168 m. The
RBFNN has a high prediction accuracy for spatial data, but           (1) We have solved the problem of low DEM accuracy of
few studies applied it into the prediction of the elevation in           the current point cloud data of the photographic
the photogrammetric point cloud. Therefore, this study                   point cloud in the forest with high canopy coverage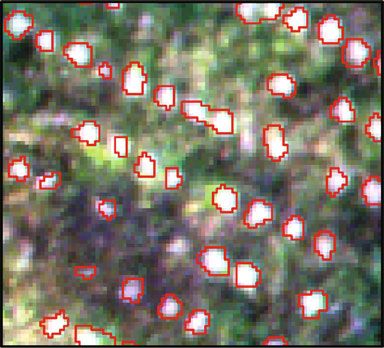
Journal of Sensors                                                                                                               3

    (2) Compared with the tree crown extraction method              flight height of 400 m and the flight coverage area of the study
        based on CHM alone, extracting the tree crown from          area as 8.48 square kilometers, which was to meet the
        the multispectral images fusing DEM has obvious             requirements of the high-precision photogrammetry point
        advantages                                                  cloud, according to the suggestion of a previous study in
                                                                    [25]. The lateral direction and route overlap rate was set to
2. Study Area and Materials                                         be 80% for the SONY-A7RII visible light camera, and the
                                                                    spatial resolution was 0.05 m. 1716 images were acquired to
2.1. Study Area. We selected the Three North Shelter forest         create a point cloud. To meet stitching requirements, the
area (45°10 ′ N, 85°56 ′ E) of 150 regiments in the north of        Micro MCA12 Snap multispectral cameras (Micro MCA12
the Mosuowan reclamation area as the study area, which is           Snap sensor band parameters are shown in Table 1) were at
approximately 150 km north of Shihezi City, Xinjiang Uygur          the settings: line overlap rate of 60%, side overlap rate of
Autonomous Region, China (Figure 1). The regiments are              70%, relative flight height of 400 m, and spatial resolution
located at the northern foot of the Tianshan Mountain and           of 0.2 m. In addition, we set four radiation targets on the
the south edge of Gurbantunggut Desert in the Junggar Basin         ground, with reflectivity of 3%, 22%, 48%, and 64% for future
and are surrounded by sand to the east, west, and north. The        radiation correction.
shelter forest is planted in a wedge shape around the edge of
the desert, dominated mainly by deciduous broad-leaved for-         2.3. Field Measurements. The field measurements were made
ests such as Ulmus pumila, Populus bolleana, Populus                on October 7, 2019. The location (including latitude and lon-
euphratica, Elaeagnus angustifolia, and Haloxylon ammoden-          gitude coordinates) of individual trees was recorded using the
dron, all of which are known for their drought tolerance. In        geolocation function of the Aowei software which is based on
addition, their strong windproof and sand fixation ability           Google Maps. The health (good or bad condition) of each
make these tree species provide excellent sand fixation and          tree was recorded, and multifunction laser distance measure-
afforestation effects in arid desert areas. Furthermore, char-        ment instrument (BAOSHIAN-CS600VH) was used to mea-
acteristics of Ulmus pumila and Elaeagnus angustifolia, such        sure the height of individual tree whose sampling situation is
as large and dense canopy, diverse growth conditions, uneven        shown in Figures 1(b)–1(d) and sampling number is shown
spatial distribution, and presence of additional green plants       in Table 2. Besides, canopy sampling numbers (number of
(such as weeds) at the tree base, provide an opportunity to         manually delineated tree crowns in the study area) are shown
test the accuracy of tree height estimation against a complex       in Table 2.
background.                                                             The recorded geographic location was imported into
     We selected three areas as the research area, and the char-    ArcGIS 10.6 software and any deviations were corrected.
acteristics of the three areas of the shelterbelt are as follows:   According to the similarity of species and the overall similar-
(1) study area 1—mixed artificial forest consisting of Ulmus         ity between the forest stand structure of field data, including
pumila, Populus bolleana, Populus euphratica, and Elaeagnus         tree cover, density, and planting type, three areas were
angustifolia, where the smaller spacing between the canopies        selected, so that the data would not be affected by the growth
is dense forest, as shown in Figure 1(b); (2) study area            of the shelter forest. All the field measurements of the shelter
2—sparse pure forest consisting of Populus bolleana which           forest for the three areas were collected within one week with
is mostly in good health, where the gap between the canopy          UAV data acquisition.
is large, as shown in Figure 1(c); and (3) study area 3—sparse
pure forest consisting of Populus bolleana which is mostly          3. Methods
not in good condition, where the gap between the canopy is
large, as shown in Figure 1(d).                                     The technical workflow of this research is shown in Figure 2,
                                                                    which includes the following steps.
2.2. Remote Sensing Data Acquisition. The UAV platform
used in this study was a fixed-wing UAV CW-20 produced               3.1. Data Preprocessing. After the flight mission was com-
by JOUAV Company. It was equipped with a SONY-A7RII                 pleted, the Position and Orientation System (POS) data in
visible light camera and a Micro MCA12 Snap multispectral           the base station was sorted and imported into Pix4Dmapper
camera, which acquire visible light images and multispectral        4.4.10 software for processing. After feature extraction, image
images taken as the data sources of our study. The UAV has          matching, bundle adjustment, automatic triangulation, cam-
the advantages of fully autonomous takeoff and rapid instal-         era self-checking, and optimize external parameters, the
lation. It was a professional-level aerial survey UAV at a          image was preliminarily processed. A dense point cloud
cruising speed of 26–40 m/s and with a battery life of 3 h. It      based on Structure-from-Motion (SfM) was generated by
was operated by a GCS-202 ground station and CWCom-                 selecting the following parameters: the image scale was half
mander software and used Real-Time Kinematic/Post Proc-             (the default value) with the multiscale option selected, point
essed Kinematic (RTK/PPK) positioning technology. The               density was set to be optimal, and the minimum number of
location information of the remote sensing images obtained          matches was 3. This operation resulted in a photogrammetric
could reach centimeter-level accuracy, and such devices have        point cloud data in LAS format and generated orthophotos
been widely used in the acquisition of remote sensing data for      with a spatial resolution of 0.05 m. Photogrammetric point
large-scale agriculture and forestry in China. We selected          cloud was imported into Terrasolid software to go through
October 9, 2019 as the data acquisition date, and set a relative    such processes: first, noise was removed from the point cloud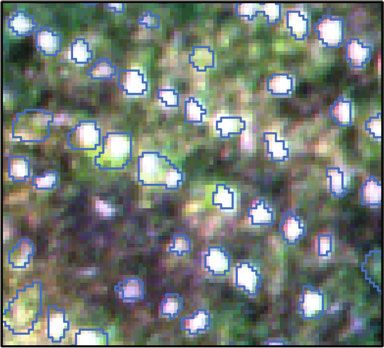
4                                                                                                                                                                 Journal of Sensors

                             85°55'20"E    85°55'40"E         85°56'0"E       85°56'20"E        85°56'40"E        85°57'0"E   85°57'20"E      85°57'40"E         85°58'0"E

            45°10'40"N

                                                                                                                                                                          45°10'40"N
            45°10'20"N

                                                                                                                                                                          45°10'20"N
            45°10'0"N

                                                                                                                                                                          45°10'0"N
                                                                                                                                                                   N
                                                                                                                                       0 125 250         500
                                                                                                                                                           m

                             85°55'20"E    85°55'40"E        85°56'0"E        85°56'20"E        85°56'40"E      85°57'0"E     85°57'20"E   85°57'40"E            85°58'0"E
                                                                                                 (a)

                         0    15   30      60       Legend                       0   15    30       60   Legend                     0 10 20      40     Legend
                                                m                                                    m                                            m
                                                     Sampling point                                          Sampling point                              Sampling point

                                          (b)                                                      (c)                                            (d)

Figure 1: Schematic diagram of the study area: (a) the area acquired by the unmanned aerial vehicle (UAV) visible light camera; (b) study area
1 and its sampling locations; (c) study area 2 and its sampling locations; (d) study area 3 and its sampling locations.

                                          Table 1: The band feature parameters of the Micro MCA12 Snap sensor [26].

Band                     Wavelength (nm)                       Wavewidth (nm)                                                    Band characteristics
1                                  470                                   10                                     Distinguish vegetation and soil rock surface
2                                  515                                   10                                    Green wave peaks in the visible light spectrum
3                                  550                                   10                                         Sensitive to changes in water quality
4                                  610                                   10                          Initial band of red light in the vegetation spectral reflection curve
5                                  656                                   10                                            Renormalized vegetation index
6                                  710                                   10                               Red edge band of the vegetation spectral reflection curve
7                                  760                                   10                               Red edge band of the vegetation spectral reflection curve
8                                  800                                   10                                             Normalized vegetation index
9                                  830                                   10                                             Different types of vegetation
10                                 860                                   10                             Significantly correlated with plant total chlorophyll content
11                                 900                                   20                                Calculation of the specific crop water sensitivity index
12                                 950                                   40                                            Calculate the water band index

data, and then the point cloud filtering was performed using                                             The acquired original multispectral images were exported
the TIN densification filtering method built into the Terrasolid                                      in RAW format, and Tetracam PixelWrench2 software was
software to derive the ground point cloud. Using the generated                                      used to convert them into standard TIFF format raster image
original photogrammetric point cloud, through Inverse Dis-                                          data. The one-to-one correspondence between the POS and
tance Weighted (IDW) interpolation operation of ArcGIS                                              the image was performed in the Pix4Dmapper 4.4.10 soft-
10.6 software, a DSM of 0.2 m resolution was generated.                                             ware to obtain multispectral image data with 0.2 m spatial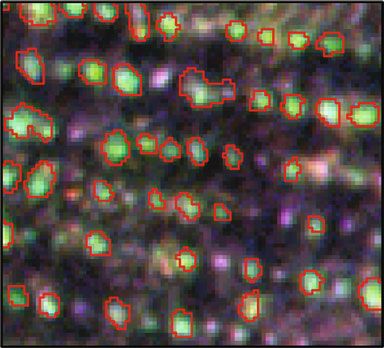
Journal of Sensors                                                                                                                            5

                                                   Table 2: Sampling statistics in the study area.

Study      Tree height sampling       Average tree height        Maximum tree            Minimum tree       Number of manually delineated tree
area             number                      (m)                  height (m)              height (m)                    crowns
1                    19                        8.02                   12.40                   4.00                          457
2                    20                        4.01                   6.40                    2.70                          694
3                    21                        5.77                   9.50                    2.60                          315

resolution. Radiometric correction was performed on ortho-                        The DEM with a resolution of 0.2 m was generated from
photos that had been stitched together, and the relationship                  the ground point cloud which was produced by RBFNN
between the actual digital quantization value (DN) of the                     interpolation, and the CHM was obtained by subtracting it
UAV multispectral image and the ground reflectance (Ref ) is                   from the DSM (Figure 4).

                      Ref = DN × a + b,                             ð1Þ       3.3. Multispectral Image Combined with CHM Canopy
                                                                              Extraction. The selected three areas had a variety of features
where a is the scaling gain coefficient and b is the offset value.               such as bare soil, shadows, and weeds around the canopy,
    According to the calibration equation, the DN values of                   which made it difficult to extract the canopy. In order to
the four target images on the ground were calculated by                       describe the canopies of individual shelter forests, this study
drawing the area of interest, corresponding to the standard                   proposed an OBIA method based on fusion of multisource
reflectance values of the four targets. The least square method                data (FMSD-OBIA) to identify the canopy. The traditional
was used to fit the empirical linear model. This operation                     pixel-based supervised classification method is based on statis-
provided the coefficients a and b of the UAV Micro                              tical spectral features, in which the selected sample feature
MCA12 Snap multispectrometer radiation calibration. Based                     values were clustered to obtain pixel-level classification results.
on the visible light image, 30–40 control points were selected,               The improvement of image resolution resulted in the spectral
and the corrected multispectral image data was geographi-                     feature of a single pixel and the reduced texture information.
cally registered in ArcGIS 10.6 software for subsequent can-                  The OBIA method was based on the characteristics of spectral,
opy segmentation.                                                             texture, shape, etc., divided into regions or sets, which was
                                                                              more applicable to high-resolution image data. In this paper,
3.2. RBFNN Predictive Interpolation Generates DEM.                            we used the multispectral sensor Micro MCA12 Snap
RBFNN [27, 28] can usually be used for classification or spa-                  equipped with two bands of red edges. The red edges had a
tial data interpolation. Due to its advantages of simple struc-               high sensitivity to vegetation, which could reflect the spectral
ture, fast learning speed, and not easily falling into a local                characteristics of vegetation better, and had certain advantages
minimum, it was often used in spatial data interpolation pre-                 in the classification of vegetation. Twelve original bands and
diction [29]. RBFNN has been applied to generate DEM                          the CHM were selected for combination, and the tree crown
through the interpolation of airborne LiDAR point cloud,                      was extracted based on the FMSD-OBIA method.
which is also trying to generate DEM in the photogrammetric                       Segmentation and classification operations of FMSD-
point cloud [30]. Therefore, we used the network to take the                  OBIA were carried out in ENVI 5.3, including three main
ground point cloud obtained by filtering as an input and                       steps: segmentation, merging, and supervised classification.
interpolated each point to generate the height value. RBFNN                   Reasonable segmentation and merging scales are very impor-
is usually composed of an input layer, a hidden layer, and an                 tant in FMSD-OBIA methods. If the scales of segmentation
output layer (Figure 3).                                                      are too large, results of the method will be subject to merge
     The output formula is                                                    and recognize smaller tree crowns, otherwise, results of the
                                                                              methods will be subject to divide larger tree crowns into con-
                                m
                                                                              siderable multiple parts and broken patches. In ENVI 5.3, the
                      f ðI Þ = 〠 W i D i ð I Þ :                    ð2Þ       edge algorithm was selected for segmentation, the full
                               i=1
                                                                              lambda schedule algorithm was selected for merging, and
                                                                              through repeated experiments, FMSD-OBIA parameters
    We usually describe Di ðIÞ as
                                                                              were selected (Table 3). K-Nearest Neighbor (KNN) and
                                                                            Support Vector Machine (SVM), the supervised versions of
                                 kI − Ci k2                                   the algorithms, were typically used in the following FMSD-
                 Di ðI Þ = exp −              ,                     ð3Þ
                                    2r 2i                                     OBIA segmentation. SVM is an excellent small sample learn-
                                                                              ing algorithm, which has shown good robustness in remote
where f ðIÞ is the output layer function of RBFNN, W i is the                 sensing image classification. In this study, tree canopy and
weight of the sample i hidden neuron to the neuron of the                     other object (considered as background) were classified into
output layer, Di ðIÞ uses the Gaussian function, Ci is the cen-               two categories, and the training samples (70% of all manually
ter of the basis function in the sample i hidden layer neuron,                delineated canopies) were selected by using the sigmoid ker-
and r i is the width of the cell of the sample i hidden layer                 nel function. The SVM algorithm performed the supervised
neuron.                                                                       classification and obtained the crown vector image.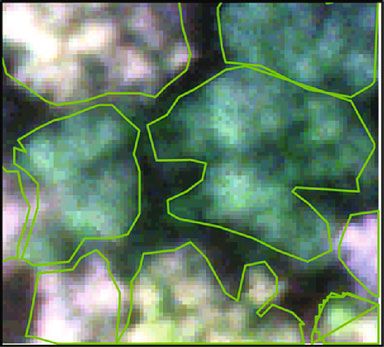
6                                                                                                                          Journal of Sensors

        Visible light image                                                  Multispectral data
                                                                                                                  Radiation correction
            acquisition                             CHM calculation            acquisition

       CW-20 equipped with                          Photogrammetric        CW-20 equipped with                      3%, 22%, 48%, 64%
         SONY-A7RII                                   point cloud           Micro MCA12 Snap                         Radiation target

                                                       Point cloud          Single -band image
         RGB image & POS                                filtering
                                                                            multi-band image                      Empirical linear model
                                                                                TIFF & POS
                                                       Ground point
                                   Terrasolid             cloud
                                    software
         Photogrammetric                                  RBFNN
           technology                                                                      Crown extraction model         ENVI software
                                                       interpolation
          Pix4D software                                                     Original 12 band +               Edge segmentation + full
                                                       DEM       DSM               CHM                           lambda-schedule
         Feature extraction

          Image matching                                  CHM                Canopy extraction               SVM algorithm supervised
                                                                                 results                          classification

        Bundle adjustment
                                                    Crown extraction
                                                                                                        Tree height estimation model
                                                          LMF                 Canopy
          Structure from                                                      optimal
                                                                                                  LMF       Tree height
              motion                                                         extraction
                                                         MCWS                                               estimation         Accuracy
                                    R software                              results (SHP
                                                                                                                               evaluation
         Optimize external                                                 vector image)                    Field
           parameters                              Canopy extraction          + CHM
                                                       results                                          measurements

    Figure 2: Workflow of the height estimation of the shelter forest based on the UAV photogrammetry fusion multispectral image.

        Input layer     Hidden layer             Output layer
                                                                       search radius of the study area was selected, as shown in
             x1               D1                                       Table 4.
                                                                            Then, the marker-controlled Inverse Watershed Segmen-
                                        W1                             tation (MCWS) method was used to explore the tree crown
             x2               D2        W2         ∑            f(I)   size based on the detected tree crown vertices. The watershed
                                                                       algorithm [33] was proposed by Vincent, whose basic idea
                                        Wm                             was to treat the image as a topographic map, in which each
                                                                       gray value in the image represented the altitude of the point,
             xn               Dm                                       each local minimum value and its affected area represented
                                                                       the water catchment basin, and the boundary formed a
             Figure 3: Architecture of the RBFNN.
                                                                       watershed. However, images with irregular noise and gradi-
                                                                       ents were prone to oversegmentation, so that a watershed
                                                                       algorithm that incorporates prior labels was devised to
3.4. Canopy Extraction Based on CHM and Tree Height                    address this problem. The algorithm reversed the CHM, used
Estimation. Based on the CHM, R-package ForestTools                    the crown vertex as the seed point, calculated the gradient of
(https://github.com/AndyPL22/ ForestTools, Plowright,                  each grid cell to the neighborhood, determined the contour
2020) [31] was used to complete the position detection and             of the crown area, and set the minimum height of the single
canopy area division of individual shelter forests. We used            tree minHeight parameter to 2 m. Through the above opera-
Variable Window Filter (VWF), a single-tree detection                  tions, the tree crown extraction results were received.
function that is an LMF based on a dynamic circular mov-                    The results obtained by the FMSD-OBIA method were
ing window [32]. Since the crown size of different trees                vectorized, and the vector image was superimposed on CHM
was different, various linear functions were needed to be               to get the acquired data (CHM + tree crown extraction
used. The height value of pixels was used to estimate the              results). The LMF algorithm was applied to the numerical sta-
radius of the search window. According to the suggestion               tistics of each polygon (tree crown), whose maximum value
of a previous study in [21], when the crown of trees was               was the tree height.
narrow, a smaller search radius was suggested to be used,
while when the crown of trees was larger, a larger search              3.5. Accuracy Evaluation of Tree Crown and Tree Height. In
radius was suggested. Through repeated experiments, the                order to further evaluate the generated crown maps, the
Journal of Sensors                                                                                                                      7

                                                                                                               Legend
                                                                                                               value
                                                                                                                        High: 15.11

                                                                                                                        Low: 0
                              (a)                               (b)                         (c)

Figure 4: Canopy height models of three study areas: (a) canopy height model of study area 1; (b) canopy height model of study area 2; (c)
                                                                 canopy height model of study area 3.

    Table 3: Parameter selection of object-oriented classification.     merged are considered to be omission errors and recorded
                                                                       as False Negative (FN); and crown split corresponds to com-
Study area      Segmentation scale (pixel)    Merging scale (pixel)    mission errors and is recorded as False Positive (FP). Then,
1                           10                          60             the crown extraction recall rate (recall), accuracy rate (preci-
2                           20                          40             sion), and F-score are defined as follows [36]:
3                           20                          40
                                                                                                        TP
                                                                                          recall =            × 100%,                 ð4Þ
                                                                                                      TP + FN
multispectral images of the three areas were manually delin-
eated by an experienced researcher and then the resulting                                                  TP
                                                                                        precision =              × 100%,              ð5Þ
manually delineated crown maps were used for space com-                                                  TP + FP
parison with the model-generated crown maps. For the sake
                                                                                                   recall × precision
of simplicity, the map automatically drawn by the extraction                    F − score = 2 ×                       × 100%:         ð6Þ
model and the map drawn manually were called the target                                            recall + precision
map and the reference map, respectively. The reference
                                                                           To estimate the tree height, the linear regression was
crowns near the image boundary had been removed and only
                                                                       applied to analyze the estimation results of models and the
the remained crowns were used in the following evaluation.
                                                                       collected field measurements, and the coefficients of determi-
According to the spatial relationship between all remaining
                                                                       nation (R2 ) and Root Mean Square Error (RMSE) were
reference crowns and target segments, they were divided into
                                                                       employed to quantitatively evaluate the accuracy of the esti-
the following five categories [34, 35]:
                                                                       mation. The value of R2 ranges between 0 and 1, a larger
     (a) Crown matched: the target canopy map (canopy                  value of which indicates that a good fitting effect is obtained.
         extraction results of the model) and the reference            The RMSE was used to measure the deviation between the
         canopy map exceed 50% of each other, which was                predicted value and the measured value, a smaller value of
         regarded as a crown matched                                   which indicates that the error is small and the prediction
                                                                       effect is good. The calculation formulae of R2 and RMSE
     (b) Crown nearly matched: the target canopy map and               are as follows:
         the reference canopy map only exceed 50% of one
         of them, which was regarded as a crown nearly                                                  ∑ni=1 ðyi − y∧i Þ2
         matched                                                                           R2 = 1 −                        ,          ð7Þ
                                                                                                         ∑ni=1 ðyi − yÞ2
     (c) Crown missed: Both the target canopy map and the
         reference canopy map were not within 50% of each                                      rffiffiffiffiffiffiffiffiffiffiffiffiffiffiffiffiffiffiffiffiffiffiffiffiffiffiffiffiffiffi
                                                                                                ∑ni=1 ðy∧i − yi Þ2                    ð8Þ
         other, which was regarded to be a crown missed                                 RMSE =                               ,
                                                                                                             n
     (d) Crown merged: if there were multiple reference
                                                                       where ̂yi is the predicted value of the sample i of the tree
         crowns with more than half the area covered by a tar-
         get canopy, the multiple reference crown maps were            height estimation model, yi is the measured value of the sam-
         taken as crowns merged in the automatic delineation           ple i of the shelter forest, y is the mean value of the measured
                                                                       sample, and n is the total number of samples.
     (e) Crown split: if there were multiple target segments
         with more than half the area covered by a reference           4. Results
         crown, the reference crown map was considered a
         crown split in the automatic delineation                      4.1. Analysis of the Results of Extracting the Crown of the
                                                                       Individual Shelterbelt. The results of different methods for
    Crown matched and crown nearly matched are consid-                 extracting the canopy of three selected areas are shown in
ered to be the correct crown width extraction results and              Figure 5, which can be seen through the combination of field
recorded as True Positive (TP); crown missed and crown                 sampling, photos, and visual observation. From the method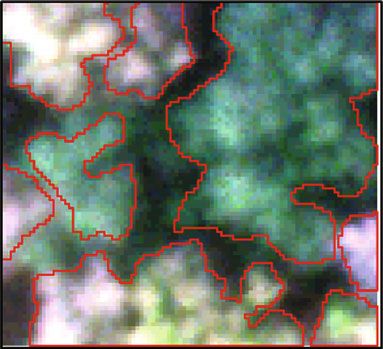
8                                                                                                                     Journal of Sensors

                                  Table 4: Search radius r of linear function for single tree detection.

Study area                             r ðxÞ (m)                                                  Canopy characteristics
1                                     0:08x + 1:5                                      Mixed forests with inconsistent crown sizes
2                                     0:04x + 0:6                              Sparse forest with small crown, tall trees, and good growth
3                                     0:04x + 0:6                                 Sparse forest with small crown and mostly dead trees

of combination of LMF and MCWS in study area 1, a split-               the method of combining LMF and MCWS, and the F
ting of one tree crown into two (oversegmentation phenom-              -score were increased by 0.09 and 0.16, respectively, which
enon) appeared and two tree crowns were merged into one                demonstrated that the FMSD-OBIA method effectively
(undersegmentation phenomenon). Oversegmentation phe-                  avoided the missing and merging of the trees.
nomena also appeared in study areas 2 and 3, and there were                There were more dead trees than healthy trees in study
also many crowns missed. The canopy extracted by the                   area 3, which also had numerous shrubs under the trees. It
FMSD-OBIA method effectively solved the problems of over-               was difficult to distinguish trees using height information
segmentation and undersegmentation phenomena in study                  alone. Multispectral images combined with height informa-
area 1, although undersegmentation phenomena in study                  tion were used to extract crowns based on objects, effectively
areas 2 and 3 still appeared, which had been reduced. Fur-             removing shrubs from the crown images. The adhesion and
thermore, incidences of the crown omission phenomenon                  merging improved the recall and precision values, which
also decreased. Overall, the FMSD-OBIA method was better               increased by 0.23 and 0.07, respectively, indicating that the
than the traditional method of the combination of LMF and              spectral information played a key role in extracting the
MCWS, and the crown extraction performance is also                     canopy.
improved.
    In order to qualitatively evaluate the results of different         4.2. The Accuracy Evaluation of the Tree Height Estimation
canopy extraction methods on the extraction accuracy of                Model. Individual tree height was extracted using the method
individual canopies of the shelter forests in study area, we cal-      proposed in this paper and compared to the field-based tree
culated relevant evaluation indexes, as shown in Table 5. The          height measurements with linear fitting in study areas 1 to
FMSD-OBIA method achieved good results in the three                    3 (Table 6). The RMSE values of the three types of the shelter
study areas: the average F-score was above 0.89, while the             forest study area were different as shown in Table 6. It can be
average F-score of the combination method of LMF and                   noticed that the value of study area 3 was the highest, in
MCWS did not exceed 0.8, with values between 0.75 and                  which there were the dead trees, with an RMSE of 1.03 m.
0.79, indicating that the crown result of the FMSD-OBIA                The value of the mixed forest in study area 1 was the second
method was more consistent with the actual shelter forest              highest, which contained multiple tree species and a denser
crown result.                                                          shelter forest, with an RMSE of 0.68 m. And the RMSE of
    For study area 1, the sizes of the individual tree crowns in       study area 2 was the lowest with a value of 0.30 m, indicating
the dense forest area were inconsistent, which posed a signif-         that the dead tree area without leaves resulted in a larger
icant challenge to the method of combining LMF and                     error. We also analyzed the average value of the samples in
MCWS, and resulted in some individual trees with small                 each study area and the estimated tree height. The results
crowns missed or merged, with the healthy tree recall value            are described as follows. The measured average tree height
of 0.74 and the dead tree recall value of 0.70. Furthermore,           in study area 1 was 8.02 m and the estimated average tree
there were multiple local maxima in broad-leaved forests               height was 7.6 m. The average measured tree height in study
(such as Ulmus pumila and Elaeagnus angustifolia), causing             area 2 was 4.01 m and the estimated average tree height was
individual trees to be divided into multiple trees. A total of         3.7 m. And the average measured tree height in research area
40 healthy trees and 19 dead trees were subject to overseg-            3 was 5.77 m and the estimated average tree height was 5.1 m.
mentation, with precision values of 0.83 and 0.84, respec-             The results can explain the overall underestimation of the
tively. The FMSD-OBIA method effectively reduced the                    estimated tree height using the CHM. The underestimation
occurrence of these two phenomena: the recall values                   situation presented above had a difference in various types
increased by 0.12 and 0.16, and the oversegmentation phe-              of shelter forests, and the best estimation was acquired in a
nomenon decreased by 16 and 13 trees, respectively, hence              vigorous and sparse forest (R2 = 0:93), with a high correla-
resulting in increases in the precision values by 0.08 and 0.11.       tion, nearly as great as the one acquired in mixed forest
    The healthy trees in study area 2 were compact but                 (R2 = 0:91). The weakest correlation was obtained in a sparse
sparse, comprised mostly of Populus bolleana. In addition,             forest with many dead trees (R2 = 0:88), which showed the
the canopy area was small: the multispectral images with               difference in the ability of photogrammetric point clouds to
0.2 m spatial resolution were mostly 20–50 pixels, and the             rebuild the canopies of different shelter forests.
canopy area was 0.8–2 m2. The oversegmentation of all                      Because we did not collect ground points, this study used
methods was obviously reduced, and the precision value of              the original point cloud without the RBFNN interpolation.
healthy trees was above 0.93. The recall values of the healthy         And the DEM was directly generated from Pix4D software
tree and the dead tree increased by 0.13 and 0.20 relative to          to estimate the tree height for comparison, verifying the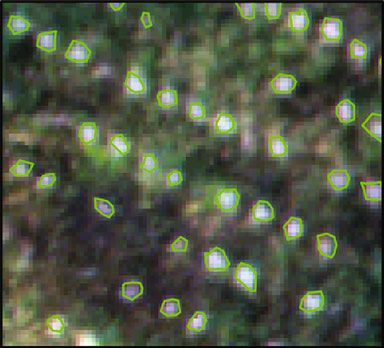
Journal of Sensors                                                                                                                         9

                                        (a)                          (b)                          (c)

                                        (d)                          (e)                          (f)

                                        (g)                          (h)                          (i)

Figure 5: The performance of different extraction methods on the crown of individual trees in the study area: (a–c) multispectral raw image
data for study areas 1-3 (the green polygonal area represents a reference drawing of the tree canopy drawn by experienced researchers); (d–f)
the red polygonal area is the crown extracted results using the method of combining LMF with MCWS in study areas 1-3; (g–i) the blue
polygonal area is the crown extracted results using the FMSD-OBIA method in study areas 1-3.

feasibility and scientificity of RBFNN interpolation. It can be             crown, which considered the object the basic unit, is a better
seen from Table 6 that the accuracy of the tree height estima-             approach than the traditional methods for the extraction of
tion results after RBFNN interpolation was overall higher                  the crown of a shelter forest. It effectively reduces the mis-
than those of the other two methods. The error of the results              classification of the pixels of shelter forest crowns as other
without RBFNN interpolation increased, and the correlation                 feature categories. Thus, with more corrected information
of those decreased, which demonstrated the effectiveness of                 (such as spectrum and height) related to the canopy extrac-
RBFNN interpolation prediction. RBFNN interpolation can                    tion, the accuracy of the proposed model is improved, which
be used to address the problem of low DEM accuracy of the                  is consistent with the research results in [37].
photogrammetric point cloud caused by the large canopy.                        The method based on combining LMF and MCWS had a
The canopy coverages of study areas 2 and 3 were small. After              large difference in the crown extraction results in the three
RBFNN interpolation, R2 and RMSE were higher than the                      study areas. The accuracy of the canopy extraction of the
other two methods (DEM generated without RBFNN inter-                      sparse forest (in study area 2) was better than that of the
polation and DEM directly generated by Pix4D software),                    mixed dense forest (in study area 1), but the sparse forest in
which proved that RBFNN was effective and feasible in pho-                  study area 3 resulted in the worst extraction effect. The main
togrammetric point cloud. On the whole, the tree height esti-              reason for the difference is the large difference in the charac-
mation results of RBFNN interpolation were more accurate                   teristics of the three types of shelter forest. In study area 3,
and efficient.                                                               there were many withered (dead) trees, and the coverage area
                                                                           was small; thus, the canopy vegetation features were not
5. Discussion                                                              obvious. In addition, the protection forest had large row
                                                                           spacing and small density, which also made it difficult to
5.1. Analysis of the Results of Extracting the Crown of the                extract the canopy. If the canopy is too small to extract, the
Individual Shelterbelt. Due to the discontinuous change of                 phenomenon of omission error is more serious. Relatively,
the gray level of the pixels in the CHM, the segmentation                  the sparse forest in study area 2 had large line spacing and
process will generate smaller segmentation units, and over-                low density, but the area of the crown width was appropriate,
segmentation and undersegmentation often occur. The                        which could be more easy to well distinguish the crown from
method based on combining spectral information with the                    the background and thus result in a better extraction
CHM and using an FMSD-OBIA method to extract the                           accuracy.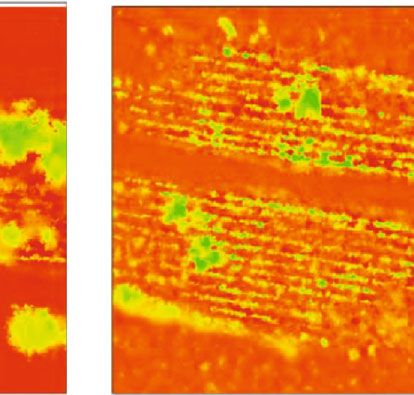
10                                                                                                                     Journal of Sensors

                          Table 5: Evaluation of the accuracy of different extraction methods in the study areas.

                  Crown
Study area                          Shelter forest         Crown     Crown nearly   Crown     Crown      Crown                      F
                 extraction                                                                                     Recall Precision
number                             health situation        matched     matched      missed    merged      split                  -score
                  method
                                      Healthy                158         31           20         45        40      0.74     0.83     0.78
                      a
                                       Dead                   60         41           22         21        19      0.70     0.84     0.77
1
                                      Healthy                194         39            8         29        24      0.86     0.91     0.88
                      b
                                       Dead                   83         51           13          9         7      0.86     0.95     0.90
                                      Healthy                323         25           60         46        27      0.77     0.93     0.84
                      a
                                       Dead                   97         28           36         29        23      0.66     0.84     0.74
2
                                      Healthy                389         31           27         19        15      0.90     0.97     0.93
                      b
                                       Dead                  144         32           17         11        9       0.86     0.95     0.90
                                      Healthy                19           4            7          5         4      0.66     0.85     0.74
                      a
                                       Dead                  139         25           54         31        27      0.66     0.86     0.75
3
                                      Healthy                27           6            1          2         3      0.92     0.92     0.92
                      b
                                       Dead                  189         38           15         18        16      0.87     0.93     0.90

a: the method of combination of LMF and MCWS; b: the method of FMSD-OBIA.

Table 6: Comparison of linear fitting accuracy evaluation of              tain difference between the dead tree and the surrounding
different methods for estimating tree height.                             environment spectrum, which could be effectively distin-
                                                                         guished. However, the best results cannot be obtained using
Study                                                        RMSE
                          Method                      R2                 spectral information alone, which is 11%–14% lower than
area                                                          (m)
                                                                         the canopy extraction results of the study in [38].
             DEM (after RBFNN interpolation) 0.91             0.68           In general, the FMSD-OBIA method for crown extrac-
                DEM (without RBFNN                                       tion can effectively solve the problems of oversegmentation
1                                            0.47             1.48
                      interpolation)                                     and undersegmentation. However, the study still has some
                 DEM (Pix4D software)        0.50             1.93       limitations. Although the object-oriented method had high
             DEM (after RBFNN interpolation) 0.93             0.30       precision, the degree of automation was not ideal, as the
                DEM (without RBFNN                                       threshold needed to be set manually which were usually
2                                            0.84             0.41       obtained requiring a number of attempts Different parame-
                      interpolation)
                 DEM (Pix4D software)        0.64             1.52       ters also needed to be set as for different types of shelter forest
                                                                         and especially in mixed forests, it was almost impossible to
             DEM (after RBFNN interpolation) 0.88             1.03
                                                                         define different canopy areas to get accurate boundary infor-
                DEM (without RBFNN                                       mation, contributing to the difference between the results of
3                                            0.60             1.68
                      interpolation)
                                                                         the extraction of different canopy areas and the actual edges.
                 DEM (Pix4D software)        0.45             2.01       Therefore, a single optimal segmentation scale was not suit-
                                                                         able for extracting tree crowns with large differences in crown
                                                                         areas in the same image.
    In the mixed forest in study area 1, the large differences of
the crown size made it difficult to determine the search radius            5.2. Analysis of Differences in the Tree Height Estimation of
of the VWF function into the procedure of individual tree                Different Shelter Forest Types. In the study of using the
detection, causing the oversegmentation and omission error               UAV photogrammetric point cloud to estimate the height
of the extreme trees that were too large or too small. The               of individual trees for different types of shelter forest, the
accuracy of the sample-based object-oriented method in all               availability of the DEM generated based on RBFNN interpo-
three research areas was higher than that of the method of               lation was confirmed. This approach has high estimation
the combination of LMF and MCWS. The canopy extraction                   accuracy and can be implemented economically. The method
results were ideal, meaning that the canopy edges were better            would be replaced the point cloud data with the one obtained
identified and the tree crown information was completely                  by LiDAR or laser scanner. Existing studies have shown that
described. Regardless of whether it was a sparse forest or a             DEM accuracy will be affected by vegetation coverage, slope,
mixed forest, the emergence of the oversegmentation and                  and interpolation algorithms [39]. The shelterbelt was
undersegmentation was reduced, and the overall accuracy                  located on the edge of a desert, where the terrain was rela-
of the sparse forest with the FMSD-OBIA method was higher                tively flat and the vegetation coverage was not large. The data
than that of the mixed dense forest. Dead trees with smaller             acquisition time was during the transition between autumn
crown areas had higher accuracy than the mixed dense forest              and winter seasons. Studies in [40, 41] have shown that the
because, after adding spectral information, there was a cer-             DEM is the most accurate in winter with low vegetation
Journal of Sensors 11
coverage. The CHM obtained by interpolation through the physiological characteristics of healthy vegetation, so that
RBFNN can theoretically get a more accurate tree height esti- the SfM algorithm extracted fewer features from the images.
mation. Analyzing the actual tree height and estimating the The FMSD-OBIA methods were employed in the combina-
average tree height showed that the overall estimated tree tion of 12-bands and CHM increased the spectral informa-
height was underestimated (between 0.3 and 0.7 m). Nuijten tion of the shelterbelt forest canopy, effectively reduced the
et al. [42] indicated that the tree height may be underesti- phenomena of oversegmentation and undersegmentation,
mated when leaves have fallen. After the frost in October in increased the F-score by 0.12–0.17, and improved the accu-
the northern Xinjiang region, the leaves of the shelterbelt racy of canopy extraction. The proposed method is effective
began to become yellow and gradually fell, while the vegeta- for estimating the tree height of individual trees of shelter
tion coverage of the canopy also diminished, which led to forests in a desert area but nonetheless requires further
the overall underestimation phenomenon of tree heights. improvement. The degree of automation of object-oriented
The difference in tree height estimation of different shel- methods is not ideal, and there is definitely room for further
terbelt types was mainly due to the acquisition and recon- improvement of the accuracy and the speed of the canopy,
struction of photogrammetric point clouds. The image data which can be replaced with deep learning methods. More-
obtained from the UAV platform was affected by many fac- over, the two types of forest stand data, from dense and
tors in the reconstruction of the 3D canopy point cloud [13, sparse forest areas, can be used to build a tree height growth
39, 43], including the UAV platform, sensors, image acquisi- model based on multiperiod image data, which will be helpful
tion parameters, and protection forest type. This study to conduct health assessments to protect the desert forest and
focused on the differences in the ability to reconstruct photo- provide an important reference for maintenance and
grammetric point clouds in different types of shelter forest, replacement.
selecting image data acquired on the same day, of the same
sort, and using the same flight platform, overlap rate, and Data Availability
lighting conditions, to prevent these parameters from having
an impact on the reconstruction of the point cloud. Through The data used to support the findings of this study are avail-
this research, it was found that the tree species and health sta- able from the corresponding author upon request.
tus of the shelter forest had different effects on the tree height
estimation. For dead trees without leaves (Populus bolleana, Conflicts of Interest
sparse forest), the RMSE was 1.03 m, and the correlation with
the measured data was lower than that of other types. The The authors declare that they have no conflicts of interest.
dense mixed forest had a lower RMSE than the sparse forest
with more dead trees. The crown area of dead trees was sig- Acknowledgments
nificantly smaller than that of healthy trees, and the vegeta-
tion information was not obvious, which made the The authors would like to acknowledge the support from col-
reconstruction of point clouds difficult. Generally speaking, leagues of the Geospatial Information Engineering Research
the higher the point cloud density, the more canopy informa- Center, Xinjiang Production and Construction Corps, espe-
tion was obtained; this was more conducive to the recon- cially Yongjian Ma, Wenzhong Tian, and Xiang Long. This
struction of canopy point cloud information, and higher study was financially supported by the Xinjiang Production
point cloud density can provide higher estimation accuracy and Construction Corps Science and Technology Project
of tree height [44]. Dead trees had a small canopy and a lim- (2017DB005); the Geospatial Information Engineering
ited number of point clouds. The lower canopy coverage Research Center to Create, Xinjiang Production and Con-
results in fewer features that can be extracted, which reduces struction Corps (2016BA001); and the Central Government
the ability to reconstruct the point cloud. This resulted in a Directs Local Science and Technology Development Special
higher tree height estimation error, which is consistent with Funds (201610011).
the research results in [22].
References
6. Conclusions [1] J. Huang, H. Yu, X. Guan, G. Wang, and R. Guo, “Accelerated
dryland expansion under climate change,” Nature Climate
This study proposed a novel method of individual tree height
Change, vol. 6, no. 2, pp. 166–171, 2016.
estimation based on fusion of an airborne multispectral
[2] F. Wang, X. Pan, C. Gerlein‐Safdi et al., “Vegetation restora-
image and photogrammetric point cloud and selected 3 areas
tion in northern China: a contrasted picture,” Land Degrada-
in the shelter forest for verification. The DEM generated after tion & Development, vol. 31, no. 6, pp. 669–676, 2020.
RBFNN interpolation could meet the requirement of esti- [3] C. Deng, B. Zhang, L. Cheng, L. Hu, and F. Chen, “Vegetation
mating tree height, which confirmed that the photogrammet- dynamics and their effects on surface water-energy balance
ric point cloud obtained by a CW-20 fixed-wing UAV, over the Three-North Region of China,” Agricultural and For-
equipped with SONY-A7RII camera, had the significant est Meteorology, vol. 275, pp. 79–90, 2019.
potential for the estimation of tree height. The coverage [4] G. B. West, B. J. Enquist, and J. H. Brown, “A general quanti-
and health condition of protective forest canopies had a cer- tative theory of forest structure and dynamics,” Proceedings of
tain influence on the reconstruction of photogrammetric the National Academy of Sciences, vol. 106, no. 17, pp. 7040–
point clouds. Dead trees had a small canopy area and no 7045, 2009.12 Journal of Sensors
[5] B. J. Enquist, G. B. West, and J. H. Brown, “Extensions and means clustering and RBF neural network,” Transactions of
evaluations of a general quantitative theory of forest structure the Chinese Society for Agricultural Machinery, 2019.
and dynamics,” Proceedings of the National Academy of Sci- [21] F. Brieger, U. Herzschuh, L. A. Pestryakova, B. Bookhagen, and
ences, vol. 106, no. 17, pp. 7046–7051, 2009. S. Kruse, “Advances in the derivation of northeast Siberian for-
[6] K. T. Moe, T. Owari, N. Furuya, and T. Hiroshima, “Compar- est metrics using high-resolution UAV-based photogrammetric
ing individual tree height information derived from field sur- point clouds,” Remote Sensing, vol. 11, no. 12, p. 1447, 2019.
veys, LiDAR and UAV-DAP for high-value timber species in [22] H. Huang, S. He, and C. Chen, “Leaf abundance affects tree
northern Japan,” Forests, vol. 11, no. 2, p. 223, 2020. height estimation derived from UAV images,” Forests,
[7] M. L. Hobi and C. Ginzler, “Accuracy assessment of digital sur- vol. 10, no. 10, p. 931, 2019.
face models based on WorldView-2 and ADS80 stereo remote [23] H. Hamraz, M. A. Contreras, and J. Zhang, “Vertical stratifica-
sensing data,” Sensors, vol. 12, no. 5, pp. 6347–6368, 2012. tion of forest canopy for segmentation of understory trees
[8] W. J. Ni, D. F. Zhang, Y. Wang et al., “Extraction of forest within small-footprint airborne LiDAR point clouds,” ISPRS
height by using GF-2 cross-track stereo images,” Journal of Journal of Photogrammetry and Remote Sensing, vol. 130,
Remote Sensing, vol. 22, no. 3, pp. 392–399, 2018. pp. 385–392, 2017.
[9] M. Karpina, M. Jarząbek-Rychard, P. Tymków, and [24] S. E. Franklin, “Pixel- and object-based multispectral classifi-
A. Borkowski, “UAV-based automatic tree growth measure- cation of forest tree species from small unmanned aerial vehi-
ment for biomass estimation,” ISPRS - International Archives cles,” Journal of Unmanned Vehicle Systems, vol. 6, no. 4,
of the Photogrammetry, Remote Sensing and Spatial Informa- pp. 195–211, 2018.
tion Sciences, vol. XLI-B8, pp. 685–688, 2016. [25] V. González-Jaramillo, A. Fries, and J. Bendix, “AGB estima-
[10] Y.-C. Hsieh, Y.-C. Chan, and J.-C. Hu, “Digital elevation tion in a tropical mountain forest (TMF) by means of RGB
model differencing and error estimation from multiple and multispectral images using an unmanned aerial vehicle
sources: a case study from the Meiyuan Shan landslide in Tai- (UAV),” Remote Sensing, vol. 11, no. 12, p. 1413, 2019.
wan,” Remote Sensing, vol. 8, no. 3, p. 199, 2016. [26] Q. Z. Zhao, W. Liu, X. J. Yin, and T. Y. Zhang, “Selection of
[11] H. Li and J. Y. Zhao, “Evaluation of the newly released world- optimum bands combination based on multispectral images
wide AW3D30 DEM over typical landforms of China using of UAV,” Transactions of the Chinese Society for Agricultural
two global DEMs and ICESat/GLAS data,” IEEE Journal of Machinery, vol. 47, no. 3, pp. 242–248+291, 2016.
Selected Topics in Applied Earth Observations and Remote [27] J. A. Bullinaria, “Radial basis function networks: introduction,”
Sensing, vol. 11, no. 11, pp. 4430–4440, 2018. Neural Comput. Lect, vol. 13, pp. L13-2–L13-16, 2004.
[12] Z. Xu, X. Shen, L. Cao, N. C. Coops, and X. Wu, “Tree species [28] M. Gomroki, M. Jafari, S. Sadeghian, and Z. Azizi, “Applica-
classification using UAS-based digital aerial photogrammetry tion of intelligent interpolation methods for DTM generation
point clouds and multispectral imageries in subtropical natural of forest areas based on LiDAR data,” PFG – Journal of Photo-
forests,” International Journal of Applied Earth Observation grammetry, Remote Sensing and Geoinformation Science,
and Geoinformation, vol. 92, p. 102173, 2020. vol. 85, no. 4, pp. 227–241, 2017.
[13] S. Krause, T. G. M. Sanders, J. P. Mund, and K. Greve, “UAV- [29] H. He, Y. Yan, T. Chen, and P. Cheng, “Tree height estimation
based photogrammetric tree height measurement for intensive of forest plantation in mountainous terrain from bare-earth
forest monitoring,” Remote Sensing, vol. 11, no. 7, p. 758, 2019. points using a dog-coupled radial basis function neural net-
[14] M. Imangholiloo, N. Saarinen, L. Markelin et al., “Characteriz- work,” Remote Sensing, vol. 11, no. 11, p. 1271, 2019.
ing seedling stands using leaf-off and leaf-on photogrammetric [30] C. Chen, Y. Li, N. Zhao, B. Guo, and N. Mou, “Least squares
point clouds and hyperspectral imagery acquired from compactly supported radial basis function for digital terrain
unmanned aerial vehicle,” Forests, vol. 10, no. 5, p. 415, 2019. model interpolation from airborne LiDAR point clouds,”
[15] Z. Qiu, Z.-K. Feng, M. Wang, Z. Li, and C. Lu, “Application of Remote Sensing, vol. 10, no. 4, p. 587, 2018.
UAV photogrammetric system for monitoring ancient tree [31] A. Plowright, “ForestTools: analyzing remotely sensed forest
communities in Beijing,” Forests, vol. 9, no. 12, p. 735, 2018. data. R Package version 0.2.0,” 2018, 2009, https://github
[16] Y. H. Tu, K. Johansen, S. Phinn, and A. Robson, “Measuring .com/AndyPL22/ForestTools.
canopy structure and condition using multi-spectral UAS [32] S. C. Popescu and R. H. Wynne, “Seeing the trees in the forest,”
imagery in a horticultural environment,” Remote Sensing, Photogrammetric Engineering and Remote Sensing, vol. 70,
vol. 11, no. 3, p. 269, 2019. no. 5, pp. 589–604, 2004.
[17] J. Lin, M. Wang, M. Ma, and Y. Lin, “Aboveground tree bio- [33] L. Vincent and P. Soille, “Watersheds in digital spaces: an effi-
mass estimation of sparse subalpine coniferous forest with cient algorithm based on immersion simulations,” IEEE
UAV oblique photography,” Remote Sensing, vol. 10, no. 11, Transactions on Pattern Analysis and Machine Intelligence,
p. 1849, 2018. vol. 13, no. 6, pp. 583–598, 1991.
[18] C.-Y. Wu, J. Mossa, L. Mao, and M. Almulla, “Comparison of [34] F. A. Gougeon, “A crown-following approach to the automatic
different spatial interpolation methods for historical hydro- delineation of individual tree crowns in high spatial resolution
graphic data of the lowermost Mississippi river,” Annals of aerial images,” Canadian Journal of Remote Sensing, vol. 21,
GIS, vol. 25, no. 2, pp. 133–151, 2019. no. 3, pp. 274–284, 1995.
[19] S. Liu, Y. Zhang, P. Ma, B. Lu, and H. Su, “A novel spatial inter- [35] L. Jing, B. Hu, T. Noland, and J. Li, “An individual tree crown
polation method based on the integrated RBF neural network,” delineation method based on multi-scale segmentation of
Procedia Environmental Sciences, vol. 10, no. part-PA, imagery,” Isprs Journal of Photogrammetry & Remote Sensing,
pp. 568–575, 2011. vol. 70, pp. 88–98, 2012.
[20] Q. Z. Zhao, L. I. Peiting, M. A. Yongjian, and T. Wenzhong, [36] W. Li, Q. Guo, M. K. Jakubowski, and M. Kelly, “A new
“Construction method of point clouds' DEM based on k- method for segmenting individual trees from the LiDAR pointYou can also read