Chapter 1 - An Integrated Multimodal Transportation System
←
→
Page content transcription
If your browser does not render page correctly, please read the page content below
Chapter 1 – An Integrated Multimodal
Transportation System
The Regional Transportation Plan envisions an integrated system that supports the goals of VISION
2050, which calls for increased investment in transportation to support a growing population and
economy. VISION 2050 emphasizes investing in transportation projects and programs that support
local and regional growth centers and high-capacity transit station areas in particular. These policies
emphasize the importance of public transit
to achieving the VISION 2050 regional
growth strategy.
Over the last few years, the region has
made significant progress in building out
its integrated multimodal transportation
system. The Alaskan Way Viaduct was
demolished and replaced with a tunnel
under Seattle’s central waterfront. New,
fast, passenger-only ferry service now
connects Kitsap County with downtown
Seattle, and new ferry terminals have
opened, including a long-planned facility
in Mukilteo. Community Transit’s Green
Line provides a second bus rapid transit
corridor in Snohomish County, and the
Northgate extension to Sound Transit’s 1-
line opened three new light rail stations.
Major rail-roadway separation projects
have been completed to eliminate bottlenecks and improve safety. And new bike and pedestrian
connections, such as the Grand Avenue Park pedestrian bridge in Everett, provide improved access to
transit stations and local amenities. WSDOT is nearing completion of a 20-year project to extend I-5
HOV lanes into Pierce County, connecting a vital network of the region’s managed highways. These
investments, and many others like them, will create and sustain the integrated transportation system
that will be necessary for the region to thrive.
This chapter describes different parts of the system and related operations and efficiencies, including
current conditions; needs, gaps and opportunities; future conditions; and what’s ahead.

Chapter 1 – An Integrated Multimodal Transportation System                                            22
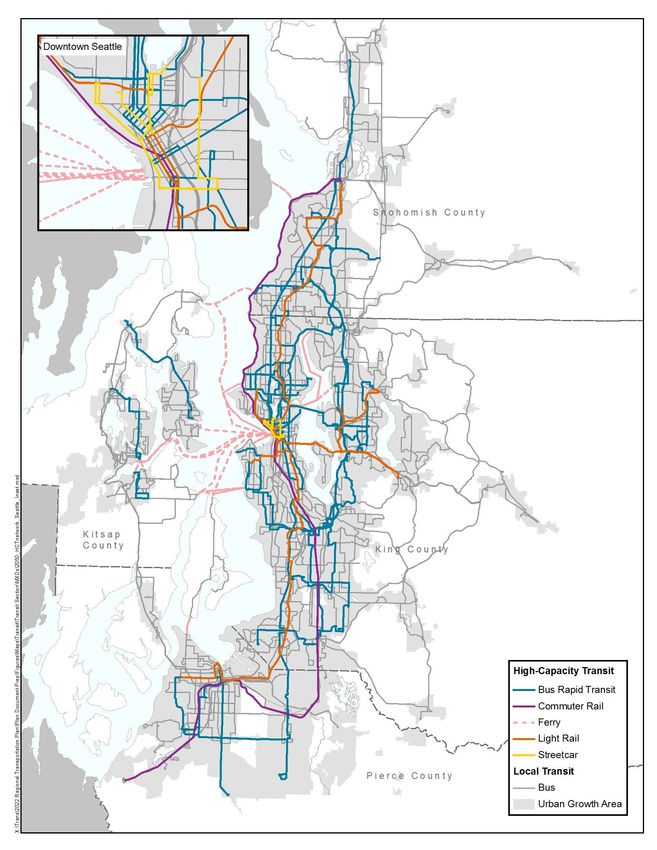
System Uses
Regular Transit
When people think of transit, most often they think of
fixed-route rail or bus service that stops at specific
stations or stops on a schedule. For the purposes of this
section, these types of transit services are referred to as
“regular transit.”
VISION 2050 calls for providing and encouraging
alternatives to driving alone and ensuring the availability
of reliable and competitive transit options.

Existing Conditions
The region’s regular transit system is built upon the
backbone of an extensive bus transit system with an
expanding high-capacity transit system.                            Definitions
High-capacity transit in the region is provided by a              Regular Transit: Rail or bus transit
variety of rail, bus rapid transit and ferry modes,               that serves regional and local
including: Sound Transit’s Link light rail, Tacoma Link,          mobility needs by providing service
and Sounder commuter rail; Seattle’s two streetcar lines          at fixed stations or stops. Regular
and the historic 1962 monorail; Community Transit’s               transit consists of both high-
Swift and King County Metro’s RapidRide bus rapid                 capacity transit modes (light rail,
transit services; and multimodal and passenger-only               commuter rail, streetcar, monorail,
ferry services provided by the Washington State Ferries,          and bus rapid transit) as well as bus
Pierce County Ferries, King County Metro and Kitsap               service connecting local
Transit (see Ferries section below). Bus rapid transit            communities to one another and to
(BRT) routes in the region are distinguished from other           high-capacity transit modes.
forms of bus transit by a combination of features that
include branded buses and stations, off-board fare
payment, wider stop spacing than other local bus service, and other treatments such as transit signal
priority and business access and transit (BAT) lanes. Collectively, high-capacity transit modes
provided approximately 25% of the region’s transit boardings in 2018. See Figure 4
Six transit agencies provide additional fixed-route bus service in the region. Each agency defines its
own service thresholds and types. However, the system can be characterized by varying frequencies
of bus service. The more urban and densely developed parts of the region include a network of
frequent buses that operate throughout most of the day. Key roles of this type of bus service include
supporting transit-oriented development (TOD) and connecting to high-capacity transit modes. Other
parts of the region have more limited service. In addition, different forms of commuter and express
buses operate over longer distances using the highway high-occupancy vehicle (HOV) lane system
with some routes operating predominantly in the peak commuting periods only. Overall, these bus
services (excluding BRT) provided approximately 75% of regular transit boardings in 2018.

23                                                            Draft Regional Transportation Plan – 1/13/2022
Figure 4 - 2018 High-Capacity Transit Network

Chapter 1 – An Integrated Multimodal Transportation System   24

More than 83% of all trips accessing transit were made by nonmotorized modes of travel (pedestrians
and bicyclists) in 2018. Automobiles accounted for the remainder of access either by parking or drop-
off. The central Puget Sound region has 231 park & ride lots providing 45,226 spaces for people to
park to access regular transit (as well as accessing vanpools and carpools).
Figure 5 shows proximity of households to the region’s growing high-capacity transit system. The
figure shows that more people of color and people with low incomes are living near high-capacity
transit than the region’s population as a whole. This finding holds true whether considering ¼-mile or
½-mile distance from stations.

Figure 5 - Households Near High-Capacity Transit Stations (2018)
    35.0%

    30.0%

    25.0%

    20.0%

    15.0%

    10.0%

     5.0%

     0.0%
                         Region                       People of Color               People with Low Incomes

                               Households near High Capacity Transit Stations 1/4-Mile
                               Households near High Capacity Transit Stations 1/2-Mile

Trends and Data Collection
Transit agencies in the central Puget Sound region collectively provided over 221 million regular transit
boardings in 2018. All fixed-route transit modes experienced robust growth between 2010 and 2018.
Light rail boardings increased dramatically due to ongoing system expansion and additional station
openings in 2016. In recent years prior to the COVID-19 pandemic, the region saw regular transit
boardings increase faster than population - the largest increase among the top 50 urbanized areas
across the nation. 1
In 2018, more than 20% of all ORCA 2 boardings used a reduced fare product. The largest among
these were people with low incomes, using an ORCA LIFT (5.7%) at almost 8 million boardings. This
was followed by people with disabilities, youth, and older adults (aged 65+). The Coordinated Mobility

1
    PSRC: Puget Sound Trends (2019). Retrieved from: https://www.psrc.org/sites/default/files/trend-transit-growth-20190424.pdf
2
  ORCA stands for One Regional Card for All. It is a contactless smart card system for public transit system riders in the central Puget Sound
region. ORCA allows for fare reductions through programs such as the Regional Reduced Fare ORCA (for older adults and people with
disabilities), ORCA LIFT (for low income households), and ORCA Youth, among other fare products.

25                                                                                  Draft Regional Transportation Plan – 1/13/2022
Plan provides more information on mobility and demographic trends for people who use reduced fare
products; see Appendix B (Coordinated Mobility Plan).
In 2020, the COVID-19 pandemic disrupted this growth in regular transit boardings as the region
responded to a stay-at-home order, rising unemployment, and a dramatic increase in telecommuting
by employees who could work from home. By early April 2020, WSDOT’s Transit COVID-19
Transportation System Reporting dashboard indicated that the regular transit ridership in the region
was down 74% on average across transit agencies compared to the previous year. 3 Transit agencies
in the region responded to this public health emergency in a variety of ways to maintain a safe
operating environment with reduced demand and vehicle capacity. The pandemic dramatically
highlighted that certain corridors and areas within the region had higher reliance on regular transit to
meet daily needs, even with pandemic travel restrictions. By 2021, with the rollout of vaccines and
partial reopening of the region, regular transit boardings showed a slow rebound, but remained at a
fraction of the boardings in prior years.
The COVID-19 pandemic will continue to have near-term impacts on regular transit boardings.
However, jurisdictions and transit agencies in the region are continuing to plan for growth in a way that
will increase ridership and meet long-term projections of transit boardings. The continuing build out of
the planned high-capacity transit network means that when people return to in-person employment,
school, and other activities in greater numbers, they will have easier access to fast and reliable transit
options. Since 2018, the region has seen the opening of one new BRT route (Swift Green line) and the
extension of Link light rail (Line 1) from Husky Stadium to Northgate, opening three new stations in
north Seattle.
Appendix A (Transportation System Inventory) provides information on the various routes and
operational details for the region’s public transit system.

Needs, Gaps & Opportunities
VISION 2050 calls for attracting 65% of the region’s residential growth and 75% of its employment
growth to regional geographies that are centered upon high-capacity transit station areas. Therefore,
some of the plan’s greatest needs, gaps, and opportunities are linked to the planned expansion of an
integrated high-capacity transit network. Integration of this network includes providing easy
connections between modes of transit and providing easy multimodal access to the public transit
network.
Public feedback during development of the plan indicated that among the top motivators to get people
to use more regular transit are shorter trip times, easier access, and extended service. For people with
special transportation needs, many of their top mobility challenges include those associated with
regular transit, including lack of regular transit in locations where it is needed, long travel times, lack of
service at times when it is needed, lack of accessible physical infrastructure to access regular transit,
and difficulty getting to medical appointments.

3
  WSDOT: Transit COVID-19 Transportation System Reporting. Retrieved in October 2021 from: https://wsdot.wa.gov/about/covid-19-
transportation-report/dashboard/transit/default.htm

Chapter 1 – An Integrated Multimodal Transportation System                                                                        26
Access to Transit
As the high-capacity transit system expands, there is an opportunity to continue to improve upon the
high percentages of nonmotorized access to transit that exists today. In addition, local jurisdictions
and transit agencies will need to collaborate in their planning to facilitate multiple modes of transit
access around future HCT station areas. This includes the following types of access:
     •   Transit-Oriented Development (TOD): VISION 2050 reinforces the importance of regular
         transit in the regional growth strategy. More than 65% of new housing units and 75% of new
         jobs are planned near transit stations. Locating most of the new growth near transit leverages
         the region’s investment in regular transit and provides new opportunities for nonmotorized
         access. Ensuring that long-term affordable housing is incorporated into transit-oriented
         communities will help to ensure that people with low incomes, people with disabilities and
         others who experience mobility challenges have easy access to the high-capacity transit
         system.
     •   Nonmotorized Transportation (pedestrian and bicycling): Walking and bicycling are some of
         the most efficient, healthy, and environmentally friendly ways to access transit. PSRC’s
         inventory of pedestrian and bicycle facilities shows that there are opportunities to fill gaps and
         create a connected network of facilities that will encourage walking and bicycling (See Bicycle
         and Pedestrian section). In developing the Regional Transportation Plan, sensitivity testing of
         PSRC’s model was conducted including an evaluation of improved walk access time and
         distance around HCT stations and the corresponding impact to transit boardings. The
         sensitivity test was intended to represent improved access from both nonmotorized and other
         last-mile improvements such as community shuttles and mobility on demand options. The
         results of this sensitivity test showed that implementation of these types of access
         improvements to the transit network could yield up to an estimated 40% increase in transit
         boardings.
     •   Automobile (both parking and drop-off): Not everyone will be able to walk or bicycle to
         regular transit, particularly in less urban and in rural contexts. However, constructing parking is
         one of the most expensive ways to access transit on a per passenger basis. Continuing to
         explore and implement parking management policies and programs at existing park and rides,
         particularly those facilities at or near capacity, can help ensure more efficient use of parking
         that is already in place. Parking management can include providing incentives for carpool
         parking as well as disincentives to driving alone. Managing demand for park and ride spaces,
         including through price, can also improve customer experience by providing riders with
         certainty that they will find a space. This can also offer more equitable access by freeing up
         spaces for use outside the peak periods, and potentially through leveraging programs like
         ORCA LIFT for low-income riders. There are opportunities for transit agencies and local
         governments to work together to incorporate areas for passenger drop off (private vehicle, taxi,
         transportation network company, and other forms) and to provide parking in scale with the
         community context. Agencies can consider strategic and lower cost ways to create additional
         parking, including:
            o   Leased lots. Leased parking both increases the supply of transit parking and comes in
                at a much lower per-stall cost than building new permanent stalls.

27                                                            Draft Regional Transportation Plan – 1/13/2022
o Creative partnerships. Leveraging existing private parking supply is a cost-effective
strategy for transit agencies and local jurisdictions. Fee-based parking near high
frequency transit service can add parking capacity and provide predictability to riders
with guaranteed parking spaces near transit.
o Restriping existing park and rides. Restriping and reconfiguring the layout of parking
stalls at existing park and ride lots can add significant new capacity at a relatively low
cost.
In addition, convenient connections between regular transit modes at transit stations and stops will
enable people using the growing transit system to travel farther in less time than they do today. There
is an opportunity for transit agencies and jurisdictions to collaborate in designing and implementing
transit facilities that make connecting between modes and services easy and seamless. One example
of a seamless transfer location where multiple modes of transit come together is the Tacoma Dome
Station, where Sounder commuter rail, Tacoma Link, and regional and local bus service are all within a
short walk of each other. In Bremerton, ferry and bus modes come together at the Bremerton Ferry
terminal. These smooth intermodal connections require advanced planning that may include multiple
modes, transit agencies, local jurisdictions, and others such as WSDOT, to succeed.
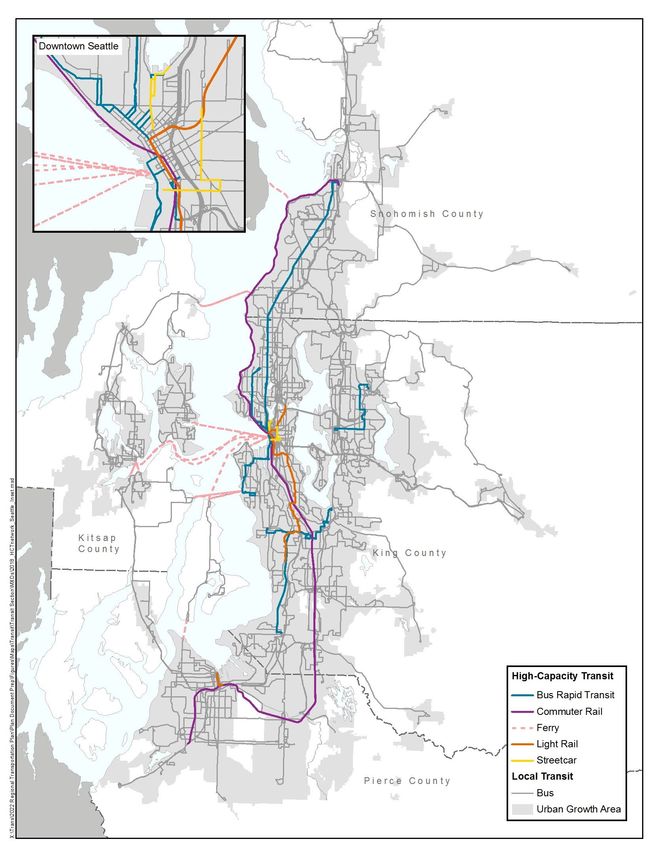
Future Conditions
The plan includes investments in high-capacity transit to expand the system to include 116 miles of
light rail with 80+ stations in three counties, 36 bus rapid transit routes, two expanded commuter rail
routes (89 miles and 15 stations), three streetcar routes, and maintaining the existing historic
monorail.
This integrated high-capacity transit system will connect to local transit services and other forms of
public transit noted within this section. Local bus service on weekdays will increase by approximately
26% regionwide between 2018 and 2050. This bus service will continue to provide mobility in places
not served by the high-capacity transit network, as well as connecting to that network. Approximately
70% of all system improvements in the plan’s financial strategy (see Appendix J, Financial Strategy)
are transit investments. In addition, a significant portion of overall transit investments are for
maintenance and preservation: replacing vehicles and keeping facilities in a state of good repair over
the long-term. See the System Performance section for information about transit asset management
and associated performance measures and targets.
Chapter 1 – An Integrated Multimodal Transportation System 28
Figure 6 - 2050 High-Capacity Transit Network

29                                              Draft Regional Transportation Plan – 1/13/2022
Plan Outcomes
Planned investments that expand and integrate the high-capacity transit system and improve
multimodal access to the public transit system result in a projected tripling of transit boardings from
2018 levels (see Figure 7).

Figure 7 - Transit Boardings Comparison 2018 to 2050

The number of regular transit boardings from high-capacity transit modes will grow from 25% in 2018
to over 62% in 2050. Light rail boardings will increase by more than tenfold over 2018 levels. BRT and
streetcar modes will also experience exponential growth in boardings (BRT boardings are projected to
increase eightfold and streetcar boardings are projected to increase more than sixfold). Other forms
of regular transit experience smaller, but still significant, ridership growth. See Figure 8 for a
comparison of transit ridership by mode between 2018 and 2050.

        -                        500,000               1,000,000               1,500,000              2,000,000              2,500,000
            2%
                3%
             2%

 2018 10% 11%                73%

                                                                                 1%
                                       1%

 2050                 25%                  1%              34%                 1%                    37%

             Bus Rapid Transit      Multimodal Ferry   Passenger-only Ferry   Light Rail   Commuter Rail    Streetcar   Local Bus

Chapter 1 – An Integrated Multimodal Transportation System                                                                               30
As the regular transit system expands and more housing is built near transit investments, by 2050
around 36% of all households will live within ¼-mile of the high-capacity transit system (up from 9% in
2018) and 59% of households will live within ½-mile of high-capacity transit in the region (up from 25%
in 2018). The improved access to the HCT network is projected to be even better for people of color
and for people with low incomes. By 2050, 48% of people of color will live within ¼ mile of HCT and
75% will live within ½-mile of HCT. People with low incomes will have similarly high percentages
(45.5% within ¼-mile and 71% within ½-mile of HCT). Nonmotorized access to regular transit will
increase from 83% in 2018 to 90% of all trips accessing transit in 2050.
By 2050, the magnitude of transfer activity across the regular transit system increases dramatically.
Local bus-to-local bus transfers are larger than they are in 2018 but are no longer the largest within
the system in 2050. The region’s investments in an integrated high-capacity transit system that
reaches all four counties means that by 2050 the largest transfer volumes will be connecting light rail
to and from local bus, with the next largest transfer volumes connecting light rail to and from BRT.

What’s Ahead?
As the region continues to expand its regular transit network into one that is increasingly convenient,
flexible, safe, and provides mobility options throughout the day, access to transit becomes more
important than ever.

Access to Transit
As described above PSRC’s model sensitivity tests showed the importance of improving access to
transit and its impact on transit ridership throughout the region in 2050. This makes it clear that
improving access to transit is essential to achieving the VISION 2050 regional growth strategy. The
region’s transit agencies, local jurisdictions, and other regional and state partners should continue
working together, building upon principles that facilitate easy multimodal access to transit as the
transit system expands. Key highlights of the work ahead include:
     •   Equity and safety: A safe and equitable transit system is fundamental to implementing VISION
         2050. Equity and safety are primary lenses through which transit access improvements should
         be considered. The needs of transit-dependent communities to access quality transit service
         should be prioritized in planning and implementation. In addition, transit access improvements
         should be safe and comfortable for those using the transit system, with particular focus on
         safety for vulnerable users and people of all ages and abilities. For more in-depth analysis,
         please see the Equity and Safety sections of the plan.
     •   Location and context matter: There is no “one size fits all” solution to access to transit issues.
         When transit agencies and other stakeholders work together to improve access to transit
         stations, the location of the station within the transit network should be considered as well as
         the local community context. A station located in a growing suburban area designated as a
         high-capacity transit community will have different access needs and priorities than a station
         located at the edge of the urban growth area. Access improvements should be customized
         based upon location and context.
     •   Importance of land use decisions and affordable housing: VISION 2050 calls for significant
         development near high-capacity transit stations. It is important that convenient, safe, and

31                                                            Draft Regional Transportation Plan – 1/13/2022
multimodal access to transit be a primary focus in redevelopment to TOD in these key locations
to maximize nonmotorized access to transit and to facilitate easy transfers. Maintaining existing
and creating new affordable housing near transit stations will be key to ensuring that transit-
dependent populations will have easy access to the expanding transit network.
• Identify roles and responsibilities: Improving access to transit is a shared responsibility that
includes ongoing communication and coordination among transit agencies, local jurisdictions,
and other relevant stakeholders (such as WSDOT). It is important to identify and engage with
potential stakeholders early in the planning process and to outline and agree to key roles and
responsibilities around planning for, funding, and implementing access to transit in a
community.
Planning for transit investments to 2050
The Regional Transportation Plan, building from and implementing VISION 2050, extends beyond the
planning horizon of all transit agencies within the region. The plan provides resources for transit
agencies to use and provides an opportunity for them to think longer-term beyond their existing
planning horizons towards the next major transit investments needed to expand the region’s
multimodal capacity.
Key issues to consider within this topic area include:
• Equity: As transit agencies and local jurisdictions begin planning beyond their current long-
range planning horizons, it is important that they prioritize good quality transit service and
consider the needs of transit-dependent populations as they do so. The Equity analysis shows
that transit-dependent populations are predominantly low income and people of color. Transit-
dependent populations need transit service connecting to jobs, childcare, health care and
other vital services, including on days and at times other than the typical commute peak
periods.
• Envisioning the next high-capacity transit corridor planning: This plan introduces the
opportunity for transit agencies to look beyond their typical planning horizons. Looking ahead
to the next set of high-capacity transit corridors will provide the framework for transit agencies
to consider in updating their long-range plans, similar to how envisioning the light rail spine in
the 1990’s set the regional stage for three high-capacity transit system plans that followed.
See Chapter 4 of the plan for more information on this topic.
• Maintaining and updating transit agency long range plans: All of the region’s transit
agencies have developed, and in some cases, updated long range transit plans. These plans
are useful for identifying long-range planning goals, assessing transit opportunities and needs
into the future, and informing shorter range implementation and funding decisions. Transit
agencies should include PSRC early in their plan update processes and incorporate an
assessment of how their long-range plans are consistent with and implement VISION 2050.
PSRC will also continue review of transit development plans and other transit agency planning
documents, as appropriate.
Chapter 1 – An Integrated Multimodal Transportation System 32Specialized Transportation People with special transportation needs are defined as those who are unable to transport themselves due to their age, income, or ability. 4 For purposes of planning, these populations include older adults, youth, people with disabilities, and people with low incomes. While regular transit services, such as bus, rail, and ferries, are the backbone of the transit system, public transportation services tailored to people with special transportation needs are called specialized transportation. Federal and state regulations require regions like PSRC to conduct a coordinated planning process that identifies an inventory of all transportation services available to people with special transportation needs, identifies mobility challenges through outreach to those groups, and creates prioritized strategies to address those challenges. PSRC includes this planning process as part of the Regional Transportation Plan in the development of a Coordinated Mobility Plan, see Appendix B. Existing Conditions As of 2019, almost half of the region’s population (47%) had special transportation needs, whether they were an older adult (aged 65 or older), youth (age 5-17), a person with low income (household income under 200% of the federal poverty level), or a person with disabilities (including physical and cognitive disabilities). Although not every person within these groups requires specialized transportation, these group tend to rely more heavily than others on public transit and specialized transportation to meet their daily needs. In many cases, people are in multiple categories, such as an older adult with a disability or a youth who lives in a household with low income. While almost half of the population falls into at least one of the categories for people with special transportation needs, the largest component of that group consists of people with low incomes (20%) followed by people with disabilities (11%). The Coordinated Mobility Plan provides information about the distribution of these and other groups of people with special transportation needs within the region and identifies common mobility challenges associated with each group. In addition, the Coordinated Mobility Plan incorporates an equity lens by considering race and ethnicity of people with special transportation needs. For example, people of color are more likely to be low income or to have a disability when compared to the general population. Trends and Data Collection Long-range transportation planning relies on a thorough understanding of current conditions. As demonstrated in other sections of the RTP, data collection and analysis are critical to this understanding. This section addresses the data related to specialized transportation that is currently available and highlights challenges and gaps in that data. Demographic Trends This section includes trends relating to the various groups considered people with special transportation needs. 4 According to Washington state law, RCW 81.66.010, people with special transportation needs are “those people, including their attendants, who because of physical or mental disability, income status or age, are unable to transport themselves or purchase transportation.” 33 Draft Regional Transportation Plan – 1/13/2022
Youth
The number of youth in the region is expected to grow by 21% between 2020 and 2050, a slower rate
than the total population. Approximately 48% of youth in the region today are people of color, making
it one of the most diverse age groups in the region. Youth also tend to be in households with low
incomes at higher rates than the regional average.
Older Adults
Whereas youth will grow at a slower rate than the total population, older adults will grow at a faster rate
(85%) between 2020 and 2050. This trend has been continuing for the last decade as the large Baby
Boomer generation (born 1946-1964) ages and people tend to live longer. Older adults tend to be
less diverse than the regional population as a whole. Although one in three adults aged 65 or older has
a disability, 73% of the oldest cohort at 85 and older has a disability. The 85 and older cohort is
projected to be the fastest growing demographic group in the region, increasing from 69,600 in 2020
to more than 275,900 by 2050. This oldest group, in particular, requires specialized transportation for
mobility.
People with Disabilities
King County has the largest overall number of people with disabilities and Kitsap County has the
highest percentage (14%) in the region. As described above, there is a high correlation between
people with disabilities and older adults. In addition to that, people with disabilities are more likely to
be in a household with low incomes than the general population. Twenty-seven percent of people with
disabilities identify as people of color.
People with Low Incomes
The largest group of people with special transportation needs are people with low incomes, at 20% of
the region’s population in 2019. Forty-nine percent of people with low incomes are people of color.
Transportation costs and availability are key concerns for people with low incomes. As housing costs
in urban centers increase, many people with low incomes are moving or being displaced to areas
outside of the urban core. When looking at data for the Seattle-Tacoma-Bellevue Metropolitan area,
the Urban Institute found that a lack of affordable housing in transit-rich areas has caused low income
people to live in areas that are far from employment/services and lack frequent transit. 5
Other Groups
Additional groups with high correlations to people with special transportation needs include both
veterans (correlated to older adults and people with disabilities) and people who have limited English
proficiency (LEP) (correlated to people with low incomes, youth, and older adults). See the
Coordinated Mobility Plan for more information on these groups.

Common Origins and Destinations for People with Special Transportation Needs
The coordinated planning process calls for PSRC to identify common origins and destinations for

5
  Urban Institute (October 2020). Access to Opportunity through Equitable Transportation: Lessons from Four Metropolitan Regions. Retrieved
from https://www.urban.org/research/publication/access-opportunity-through-equitable-transportation

Chapter 1 – An Integrated Multimodal Transportation System                                                                                34
people with special transportation needs. The Coordinated Mobility Plan identifies where different
groups of people with special transportation needs live within the region. Feedback from surveys to
these groups shows that some of the most common destinations for people with special transportation
needs are medical facilities and related healthcare destinations, grocery stores/food banks, and
educational institutions. Medical/healthcare locations are important for all but are particularly
common destinations for older adults and people with disabilities. Educational institutions are the
most common destinations for youth.

Existing Specialized Transportation Services
People with special transportation needs rely upon all modes of public transit. Of particular
importance for freedom of movement and flexibility are buses, rail, and ferries, discussed in other
sections of the RTP. This section reviews the various forms of specialized transportation that are
available in the region.
Most specialized transportation providers surveyed for the Coordinated Mobility Plan serve the needs
of older adults, people with disabilities, and people with low incomes who either are not able to access
transit or have mobility needs that cannot be met by transit.
Older adults and persons with disabilities who are very frail or have cognitive impairments require a
higher level of service than can be provided by either public transit or paratransit services. Based on
the latest service inventory, more than half of the specialized transportation programs in the region
serve older adults or people with disabilities and most of those programs reported their service
vehicles are wheelchair accessible. Table 1, below, provides a summary of specialized transportation
services found in the central Puget Sound region. The Coordinated Mobility Plan includes a full
inventory of existing services.

Figure 9 - Specialized Transportation Programs by Type

 Transportation Service      Key Provider(s)                      Eligibility

 ADA Complementary
                             Transit agencies                     People with disabilities
 Paratransit
                                                                  People with special transportation needs
 Demand Response (non-       Transit and other specialized
                                                                  (see Coordinated Mobility Plan
 ADA paratransit)            transportation agencies
                                                                  Attachment B for more details)
                             Other specialized transportation     People with special transportation needs
 Volunteer Driver Programs   agencies–non-profits or faith-       (see Coordinated Mobility Plan
                             based organizations                  Attachment B for more details)
                             Other specialized transportation
 Non-Emergency Medical                                            Medicaid/Medicare Advantage eligible
                             agencies—for-profit transportation
 Transportation (NEMT)                                            riders
                             contractors
                             Other specialized transportation
 Student Transportation
                             agencies—for-profit transportation   School-aged youth
 (School Buses)
                             contractors
                                                                  Open to the public (see Coordinated
                             Transit and other specialized
 Travel Training                                                  Mobility Plan Attachment B for more
                             transportation agencies
                                                                  details)

35                                                           Draft Regional Transportation Plan – 1/13/2022
Transportation Service Key Provider(s) Eligibility
Information and Referral Other specialized transportation
Open to the public
Service agencies—non-profits
Mobility Other specialized transportation
Open to the public
Management/Coalitions agencies—non-profits
Most of the programs noted in Figure 9 are specialized transportation operating programs. However,
some programs are designed to educate and inform people with special transportation needs on how
to use existing operating services, whether they be regular transit or specialized transportation. These
include travel training, information and referral services, and mobility management/coalitions. These
three categories of specialized transportation programs provide a key transportation demand
management (TDM) function for people with special transportation needs. See the Transportation
Demand Management section of the RTP for more on that topic.
Needs, Gaps & Opportunities
People with special transportation needs experience a multitude of mobility needs or challenges that
are not experienced by the general population or are more difficult for these groups compared to the
general population. Examples of these challenges include lack of transportation that they can use in
their neighborhood; transportation that is not available at the time that they need it; and/or institutional
barriers to using accessible transportation.
PSRC conducted outreach to people with special transportation needs through community-based
organizations (CBOs) and online surveys during 2020-2021. Through this outreach targeted to people
with lived experiences with mobility challenges, PSRC identified several key mobility needs that are
highlighted in the Coordinated Mobility Plan and summarized below.
Shorter travel times when taking regular transit or specialized transportation
Longer travel times when taking regular transit or specialized transportation compared to other
transportation options, like driving a personal vehicle, is one of the key mobility challenges. Long wait
times can be due to poor on-time reliability and excessive wait time at transfer points, among other
things. Also, a lack of flexibility scheduling return trips for Americans with Disabilities Act (ADA)
paratransit can result in a rider waiting a long time to be picked up.
More transportation services at times when they are needed
With many transit agencies focusing service during peak hours, there is a need for more of the
region’s transit service to be available during non-peak hours, for example in the early morning or late
evening. Also, there is less transit and ADA paratransit service available on weekends compared to
weekday service. Specialized transportation services most commonly provide service on weekdays
with little or no service offered in early mornings, evenings, or on weekends.
Accessible information about available services and language services
Riders with special transportation needs are often unaware of the different transportation options
available to them or unsure which to use for a particular trip. Also, a lack of translated resources or in-
Chapter 1 – An Integrated Multimodal Transportation System 36language assistance services can further exacerbate this challenge.
Better access to health and wellness destinations
With a growing number of people with special transportation needs, getting to health and wellness
destinations is a continuing mobility challenge in the region. Many people shared that a lack of
transportation, either regular transit or specialized transportation, to get to their medical appointments
was a barrier to accessing healthcare. Other feedback in this area was on the difficulty of reaching
urban medical facilities from rural areas. There is a particular mobility challenge identified for those
who have special transportation needs and are not eligible for Medicaid non-emergency medical
transportation or ADA paratransit service.
Affordable transportation for families with low incomes
Although most transit agencies in the region offer reduced fare options for people with low incomes,
those reduced fares can be too expensive for families with lower incomes who may need to pay for
multiple family members for multiple rides a day. This concern was raised in many outreach meetings
throughout the coordinated planning process. Concerns were also expressed about the cost of
medical transportation for people with low incomes.
Connected ADA-accessible infrastructure
Individuals seeking to walk, bike, or roll need an accessible and connected bicycle and pedestrian
network. ADA-accessible infrastructure, such as complete sidewalks and wheelchair-accessible curb
ramps, can help people getting to transit or specialized transportation services to reach their desired
destinations. Filling gaps in sidewalks can mean accessing public transit options that allow more
independence, such as allowing use of bus transit instead of ADA paratransit service.
Better regional coordination to meet growing mobility needs
Transportation providers and regional stakeholders expressed concerns over funding constraints to
support the mobility of people with special transportation needs in the region. In addition, there are
numerous mobility programs that serve specific groups for specific purposes. These programs create
potential unnecessary duplication of service to areas that are expensive to serve. There is a need to
improve regional cross-program collaboration and leverage existing funding among entities with
dedicated transportation programs to increase availability of specialized transportation services.
Additional needs and challenges for specialized transportation
PSRC also identified the following mobility needs and challenges through outreach:
• More flexible scheduling for specialized transportation services, such as ADA paratransit and
other community demand response services.
• Improved driver communication and training for people with special transportation needs.
• Simplified ADA paratransit eligibility review processes.
• Issues associated with rider comfort and safety, including perceived safety.
There are also challenges in obtaining consistent data for specialized transportation programs.
Specialized transportation programs cover a wide range of types, including forms of operation
(volunteer driver, demand response paratransit, deviated fixed-route, among others), and types of
37 Draft Regional Transportation Plan – 1/13/2022mobility management (travel training, information and referral services, and mobility coalitions). Specialized transportation services are also often provided by private nonprofit organizations and human service providers with limited budgets and capacity for robust data collection and reporting. There is a clear need to develop consistent performance measures and collection processes for specialized transportation providers. Future Conditions Demographic trends point to a future with a higher percentage of people with special transportation needs living in the region by 2050. The oldest adults 85 and older will be the group that grows the most and who have a very high correlation with people with disabilities. In addition, youth, people with low incomes and working-age people with disabilities will continue to have mobility challenges that must be addressed. At the same time, as described in other sections, the central Puget Sound region will have a much more extensive high-capacity transit network that will be fed by bus, mobility on demand, and specialized transportation services to improve mobility of all people, including those who have challenges due to age, income, and ability. What’s Ahead? Prioritized Strategies PSRC developed and prioritized strategies to improve identified mobility needs of the people with special transportation needs. Community and regional partners provided input on prioritization of the strategies. See Appendix B - the Coordinated Mobility Plan for a full discussion of these strategies. Measuring Impact and Next Steps PSRC will work with stakeholders to engage on the mobility needs and strategies identified in the Coordinated Mobility Plan, and to find meaningful ways to measure performance of the programs that implement the strategies. Chapter 1 – An Integrated Multimodal Transportation System 38
Mobility On Demand
Mobility on Demand (MOD) refers to the ability of individuals to find and use a variety of transportation
options through public or private providers at their own convenience rather than a fixed schedule.
Technology plays a key role in aggregating transportation options and providing details like availability
and cost so customers can make an informed decision when planning a trip. All the shared mobility
options addressed in the ITS/Technology section of the plan can also be considered MOD options:
ride hailing, microtransit, micromobility, car sharing, and ride sharing. (See the ITS/Technology
section for definitions and general discussion of these modes.)
MOD can be a direct provider-to-user experience, like an individual booking an Uber ride instead of
driving themselves or renting an electric scooter in lieu of walking. However, public transit agencies
are increasingly pursuing opportunities to leverage these new transportation options rather than
compete with them. Transit agencies generally use the MOD service model to provide first- and last-
mile connections to regular transit services and/or to serve geographic areas not well suited to regular
transit.

Utilizing MOD for First- and Last-Mile Connections
Not all residents live close enough or are able to walk, bike, drive, or get dropped off to access transit
at a stop or station. One way transit agencies in the region are addressing this access issue is through
MOD projects, usually as a pilot or on a trial basis. These projects use smaller vehicles (vans or cars)
to provide trips within a set geography where either the destination or origin point must be a transit
stop or station (usually with high-capacity transit service like rail or BRT). Transit agencies may also
encourage the use of micromobility options to access regular transit services.

Ride Hailing Partnerships and Microtransit
Many of the region’s transit agencies have experimented with public-private partnerships with ride
hailing or microtransit companies to improve access to transit by closing first- and last-mile gaps.
Examples include King County Metro’s Via to Transit and Ride Pingo to Transit programs. Via to Transit
operates in four designated zones in King County: Othello, Rainier Beach/Skyway, Renton Highlands,
and Tukwila. Customers use the Via app or contact the call center to book an on-demand trip. One end
of the trip (origin or destination) must be a designated Via hub, which includes transit centers, light rail
stations, and key community locations (e.g., select community centers, libraries, and medical
facilities). Another pilot program, Ride Pingo to Transit, operates similarly but uses the Pingo app
instead of Via. Ride Pingo to Transit serves the Kent Valley area, and each trip must either end or begin
at Kent Station or the Kent Valley Hub to connect to bus or Sounder commuter rail services.
Former pilots include the Ride2 Pilot Program in Eastgate and West Seattle, which was a partnership
between King County Metro and Chariot, a defunct microtransit service, as well as Pierce Transit’s
Limited Access Connections Program, a partnership with Lyft funded by the Federal Transit
Administration’s MOD Sandbox grant program.

Micromobility
Another emerging market under the MOD umbrella is micromobility, which refers to person-powered
and individually operated modes, usually for short trips. Micromobility includes shared-use bike, e-

39                                                            Draft Regional Transportation Plan – 1/13/2022
bike, or e-scooter rental services where rental transactions are typically completed in a smartphone
app. Transit agencies have partnered with bike and scooter share services to install docked systems
or deploy dockless fleets at transit centers to encourage transit riders to use these modes for first-
and last-mile connections to transit.

Targeted MOD
Transit agencies also deploy MOD services to replace a low-performing bus route or provide new
service in an area that has unmet demand that may not be high enough or dense enough to warrant a
regular route. Common MOD solutions in this scenario are deviated-route buses or providing on-
demand point-to-point service in a designated service zone using agency-owned vans or by
partnering with ride hailing or microtransit companies.

Flexible- or Deviated-Route Bus
Deviated-route service is a hybrid of fixed-route and demand-response service. 6 Typically using a
smaller bus or van, this service generally operates along a fixed route but can deviate within a certain
proximity to pick up a rider who submits a pre-scheduled request. It may also refer to a route that
consistently circulates along a busy route or corridor without scheduled timepoints that can be flagged
down for pickups.
New technology has made this a more efficient mode, enabling real-time requests and making it a
truly on-demand service. One local example of a deviated-route service is Kitsap Transit’s BI Ride
Powered by Pingo. BI Ride has operated a deviated route serving Bainbridge Island since 2014.
Beginning in July 2021, customers can also use the Ride Pingo mobile app to request rides on
demand instead of scheduling in advance.

Ride Hailing Partnerships and Microtransit
Transit agencies have long used vans to provide community shuttle and on-demand service as an
alternative to regular transit to serve people with special transportation needs (sometimes called
paratransit). As ride hailing apps grew in popularity over the last decade, transit agencies began
piloting partnership programs to provide a similar on-demand experience to the general public either
through public-private partnerships or agency-operated programs. These pilots are typically deployed
in areas where regular transit has been eliminated due to low productivity or where there is unmet
demand but not enough to warrant regular transit.
King County Metro’s Community Ride is an example of the MOD application. Unlike Ride Pingo to
Transit or Via to Transit, Community Ride allows on-demand trips to begin and end anywhere within
the designated service area, even if it is not a transit stop, station or hub (sometimes referred to as
point-to-point service). The service is being piloted in the Sammamish and Juanita areas. To access

6
   Traditional bus, rail, or ferry service that operates on a set schedule, along a fixed route alignment (including those in a shared right-of-way,
like local bus), and with designated stops is considered fixed-route or “regular” transit. Alternatively, on-demand service operates dynamically
based on customer demand. Routing, stops, and pick-up/drop-off times are based on requests from riders. Traditional demand-response and
paratransit services require scheduling in advance, but newer technologies are allowing for true on-demand service, with customers requesting
rides in real-time, as needed.

Chapter 1 – An Integrated Multimodal Transportation System                                                                                        40
destinations outside the service areas, customers can be dropped off at one of several transit stops or
park-and-rides within the service area to connect to regional transportation options.
Pierce Transit’s PT Runner service builds upon lessons learned from the pilot Runner to Joint Base
Lewis-McChord. The on-demand service is designed to offer a car-free transportation solution in
areas with limited regular transit options. Customers can book a door-to-door trip anywhere in a
designated zone on the Goin app, by phone call, or by flagging down a vehicle. Trips are provided by
Pierce Transit owned-and-operated vans.

The Future of Mobility on Demand
The scale of adoption and future impacts of Mobility on Demand are still relatively uncertain. Most
programs in the region have been launched on a pilot basis, and the cost effectiveness and
successfulness of MOD as a longer-term public transportation service model has yet to be seen. The
impacts of the pandemic on travel behavior and the high turnover of technology and microtransit
companies also contribute to this uncertainty.
Customer awareness and convenience also present challenges. With various implementers and
partnerships across the region, there are several apps and programs for customers to keep track of.
While traditional ride hailing services may show up as a transportation option in Google Maps, along
with driving, walking, biking (with personal bike or micro-mobility options), and traditional fixed-route
transit, most microtransit and flexible-route services (as well as specialized transportation services) do
not show up as an option. Uniform adoption of standard data feeds (like GTFS-flex) for all MOD
services in the region would improve customer awareness of these services by showing them
alongside other options in Google Maps and other trip planning tools.
MOD has a lot of potential to improve access to regular transit and provide point-to-point service more
efficiently in areas not well suited to regular transit. More data collection and analysis at a local and
regional scale of past and current programs may help focus these emerging technologies and service
models where they can be most effective long-term. Further discussion of the future of MOD is
included in the ITS/Technology section of the plan.

41                                                           Draft Regional Transportation Plan – 1/13/2022
Intercity Rail & Bus
                                                                                        Definitions for
Intercity passenger rail and bus provide transportation                                 Passenger Rail Systems
for trips between cities in and outside of the region, with
                                                                                        Long-Distance: Routes of more
connections to key regional and local transit services.
                                                                                        than 750 miles between endpoints.
The central Puget Sound region benefits from existing
                                                                                        Example: Amtrak Empire Builder
intercity passenger rail and bus lines and its location
                                                                                        from Chicago to Seattle
along a federally designated high-speed rail corridor.
                                                                                        Intercity: Routes of 750 miles or
Intercity Rail                                                                          less, but not commuter rail.
                                                                                        Example: Amtrak Cascades from
System Description                                                                      Eugene to Vancouver, B.C.
The Pacific Northwest Rail Corridor is one of 11 high-                                  Commuter: Serves metropolitan
speed rail corridors designated by the Federal Railroad                                 and suburban areas, usually having
Administration. The corridor runs from Eugene, Oregon                                   reduced fare, multiple-ride
through the Seattle-Tacoma-Everett urbanized area up                                    commuter tickets and morning and
to Vancouver, British Columbia, encompassing the                                        evening peak period operations.
primary north-south passenger rail route through the                                    Example: Sound Transit Sounder
state of Washington.                                                                    from Everett to Lakewood

Since 1994, the Amtrak Cascades line has provided              Notes: Light rail, monorail, and
intercity rail service along the length of the Pacific         streetcar services do not meet the
Northwest Rail Corridor, from Vancouver, B.C. to               definitions above, which are from
Eugene, OR. Since 2013, the service has been                   United States Code (49 USC Section
managed and funded by the Washington State                     24102). More details on these
Department of Transportation (WSDOT) and Oregon                modes are addressed in the regular
Department of Transportation (ODOT), contracting               transit section of the plan.
operations and train equipment maintenance with
Amtrak and primarily using tracks owned by BNSF. 7 The
Amtrak Cascades line stops in Everett, Edmonds, Seattle, Tukwila, and Tacoma, with other stops
outside the region. Prior to the COVID-19 pandemic, the service offered four daily roundtrips between
Seattle and Portland, two daily roundtrips between Seattle and Vancouver, B.C., and two daily
roundtrips between Portland and Eugene. Most stations provide connections to local public transit
service and many have strong connections to local bicycle and pedestrian facilities.
The Amtrak Coast Starlight (from Los Angeles to Seattle) and Empire Builder (from Chicago to
Seattle), which are both managed by Amtrak, serve the region with long-distance passenger rail
service. The Empire Builder stops at Everett, Edmonds, and Seattle stations, with the line terminating
in Seattle. The Amtrak Coast Starlight stops in Tacoma and Seattle, where the line terminates.

Existing Conditions
WSDOT developed a long-range plan for Amtrak Cascades service in 2006, identifying several

7
    Note: Sound Transit and Union Pacific also own track segments used by the Amtrak Cascades trains.

Chapter 1 – An Integrated Multimodal Transportation System                                                                   42
infrastructure and equipment improvements necessary to achieving the long-term vision of expanded service between Seattle and Portland (13 daily roundtrips, up from four). The federally funded infrastructure projects prioritized from the plan were completed in 2017 and included station upgrades, track and signal upgrades, new tracks, new locomotives, and landslide mitigation work. The state is monitoring the program outcomes of these investments based on travel time reductions, number of roundtrips between Seattle and Portland, and on-time performance in the corridor. Ridership In 2011, WSDOT reported the highest ridership on the Amtrak Cascades service to date with 848,000 trips. 8 Unfortunately the delivery of the rail infrastructure projects between 2011 and 2017 created short-term reliability issues during construction. Ridership decreased each of the following years, reaching 745,000 in 2015. Ridership fluctuated over the next few years, but WSDOT reported improvements in ridership, revenue, and on-time performance in 2019. The COVID-19 pandemic had a substantial impact on Amtrak Cascades service in 2020. The closure of the Canadian border led to the suspension of service between Seattle and Vancouver, B.C., and the reduction in passenger demand due to public health recommendations resulted in WSDOT reducing the number of daily roundtrips between Seattle and Portland from four to one. Furthermore, capacity restrictions to encourage social distancing limited ticket sales to 50% of capacity on all trains for most of the year. Consequently, annual ridership in 2020 dropped to 172,000 passenger trips from the 824,000 reported in 2019. Reliability With the completion of projects to improve the speed and reliability of intercity rail, WSDOT set a new goal in 2018 for 88% on-time performance for the trips serving Washington cities (i.e., all trips on Amtrak Cascades except the Eugene to Portland trips), up from the previous goal of 80%. On-time performance has been recovering from a low of 47% in 2017 but continues to be a challenge. In 2020, WSDOT reported that 62% of trips were on time, up from 58% in 2019 but still well below the 88% goal. Slow order delays, freight train interference, and passenger train interference accounted for almost half of all delay on this route in 2019. 9 Additionally, beginning in 2018, WSDOT adjusted the definition of “on time” from a train arriving at the final destination station within 10 or 15 minutes of the scheduled time (depending on route length) to arrival within 10 minutes of scheduled arrival at the endpoint station within each segment (Portland to Seattle is one segment and Seattle to Vancouver, B.C. is another). 8 Source (for all Amtrak Cascades ridership data in this section): Amtrak Cascades 2020 Performance Data Report. Washington State Department of Transportation. Published February 2021. 9 As recorded in the 2019 Washington State Rail Plan, of the 24 Amtrak delay categories, these three categories accounted for 18.7%, 15.3%, and 12.9% of total delay minutes on Washington trips of Amtrak Cascades, respectively. Freight and passenger train interference refer to delay when another train is given priority (freight, commuter rail, another Amtrak train, etc.). A slow order is issued by the host railroad as a safety measure, lowering the maximum allowable operating speed on track segments, often near maintenance areas or capital projects. Operating at a reduced speed can lead to late arrival at the destination. 43 Draft Regional Transportation Plan – 1/13/2022
You can also read