Chapter 2: Scenarios of Urban Futures: Degree of Urbanization - UN-Habitat
←
→
Page content transcription
If your browser does not render page correctly, please read the page content below

WORLD CITIES REPORT 2022

                               Chapter 2:
                           Scenarios of Urban Futures:
                             Degree of Urbanization

31
Scenarios of Urban Futures: Degree of Urbanization

Quick facts
1. Global city population share doubled from 25 per cent in 1950 to about 50 per cent in 2020;
    it is projected to slowly increase to 58 per cent over the next 50 years.

2. Between 2020 and 2070, the number of cities in low-income countries will increase by 76 per
    cent, in high-income and lower-middle-income countries by about 20 per cent, and in upper-
    middle-income countries by 6 per cent.

3. Over the next five decades, growth in city land area will mostly take place in low-income
    (141 per cent), lower-middle-income (44 per cent) and high-income countries (34 per cent).
    Changes in upper-middle-income countries are projected to be relatively small (13 per cent).

4. Small cities cover almost half of city land (about 45 per cent) in low-income countries, a
    trend that will persist over the coming decades.

Policy points
1. City densities in low-income countries need to be planned for and managed in ways that
    future growth does not exert pressure on existing open land, infrastructure and services, and
    result in crowding on the one hand or lead to unsustainable sprawl on the other.

2. Enhanced planning capacities for small cities and emerging newer cities will strengthen the
    important role they play across the urban-rural continuum in achieving sustainable futures.

3. Planning for age-friendly cities and towns that afford good quality of life for all inhabitants
    across all generations is critical for sustainable futures.

4. Effective urban and territorial planning is critical to mitigate the negative social, economic
    and environmental associated with future urban growth.

5. Effective urban and territorial planning is critical to mitigate the negative social, economic
    and environmental associated with future urban growth.

                                                                                                                                32
WORLD CITIES REPORT 2022

One of the fundamental challenges linked to monitoring global      2.1. The Degree of Urbanization and Why it
urbanization trends and progress on the global development              is Important?
agendas has been the lack of a unified definition as to what
constitutes “urban” and its precise measurement that can           Despite varying national definitions, the harmonized
facilitate international comparability. This has largely been      definition proposed by the Degree of Urbanization
attributed to the differing criteria employed by countries         methodology has revealed that there is in fact a broad
in defining “urban” and “rural” areas—a reflection of their        consensus across countries on what constitutes a large
various perspectives as to what constitutes these types of         city and where the most rural areas are. However, there is
human settlements. Understanding future scenarios of urban         a wide variation in how “towns” are defined, a discrepancy
trends calls for a more precise measurement that allows for        with profound implications for demographic analysis of
meaningful comparison across countries, while remaining            global urbanization trends. In general, national definitions
relevant to national conceptions of urban and rural areas.         in Europe and the Americas tend to classify towns as
                                                                   urban, while in Africa and Asia they tend to classify them
It is in this light that this chapter uses a new, harmonized and   as rural. For example, in Brazil, France, Mexico and the
global definition of urbanization that facilitates international   United States, towns tend to be classified as urban, while
comparability to present scenarios of urban trends in various      in Egypt, India, Uganda and Viet Nam towns are often
regions of the world. These scenarios allow us to understand       classified as rural. In some cases, this happens because the
the anticipated demographic and spatial changes across the         country uses a high minimum population threshold for a
urban-rural continuum in various regions as well as their          settlement to be considered urban. In other cases, especially
drivers. This definition, known as the Degree of Urbanization,     where the minimum population threshold is already met,
was endorsed by the United Nations Statistical Commission          a range of other indicators or criteria applied by a country
in 2020. It was developed by six international organizations1      (in combination with the minimum population threshold)
to facilitate international comparisons and complement             excludes such settlements from being officially recognized
national definitions. The monitoring of both the New Urban         as urban. This distinction leads to only a small share of towns
Agenda and the 2030 Agenda for Sustainable Development in          being classified as urban.
particular stands to benefit from this harmonized definition.
A detailed manual of how to apply this new definition was
published in 2021.2                                                There is a wide variation in how “towns”
                                                                   are defined, a discrepancy with profound
Chapter 1 describes urban trends based mainly on data from         implications for demographic analysis of global
the United Nations World Urbanization Prospects (WUP).             urbanization trends
This chapter, on the other hand, complements the analysis
in the preceding chapter by providing a different, but equally     It is worth noting that most national definitions with a
important, perspective on future trends using Degree of            minimum population size threshold for an urban area use
Urbanization and data emanating from this new harmonized           a relatively low threshold. Out of the 100 countries for
approach.                                                          which the World Urbanization Prospects lists a minimum
                                                                   population threshold, 84 use a threshold of 5,000 or smaller.
The chapter begins with a short introduction to the Degree         The Degree of Urbanization follows this approach and
of Urbanization. It then shows how urbanization has and            defines all settlements with at least 5,000 inhabitants as
will change from 1950 to 2070 using a new global definition        urban. However, it recommends splitting these urban areas
of cities, towns and rural areas. The chapter presents the         into cities of at least 50,000 inhabitants, on the one hand,
drivers of urbanization in the different regions of the world,     and towns and semi-dense areas, on the other hand. This
highlighting how the spatial expansion of cities and the           captures the urban-rural continuum more accurately, as a
emergence of new cities have contributed to city population        growing number of national definitions do as well. It also
growth. It reveals how cities attract young adults, but            means that the cities and the rural areas as defined by the
children and elderly are more likely to live outside cities.       Degree of Urbanization are generally classified as urban and
The chapter explores how the number and size of cities have        rural, respectively, by their national definitions and that the
been changing and the future challenges of city growth.            areas that are not treated consistently by national definitions
Finally, the chapter interrogates how dense our cities should      are confined to the intermediate classes: “towns and semi-
be while advancing options that enhance sustainability.            dense areas.”

33
Scenarios of Urban Futures: Degree of Urbanization
classified as urban. Applying this definition to an estimated
To better understand urban futures global human settlements population grid (GHS-POP)4 for
and their demographic drivers, 2015 shows that in most regions the population share in
it is important move beyond the cities as defined by the Degree of Urbanization is similar or
classical rural-urban dichotomy and smaller than the urban population share based on national
consider entire urban continuum definitions (Figure 2.1).
The Degree of Urbanization also has a second-level The rural population share as defined by the Degree of
classification that splits towns from semi-dense areas and Urbanization is also typically similar or smaller than the
creates three classes in rural areas: villages, dispersed rural national defined rural population share. In high-income
and mostly uninhabited (Box 2.1). To better understand urban countries, however, the nationally-defined rural population
futures and their demographic drivers, it is important move share is smaller than the one as defined by the Degree of
beyond the classical rural-urban dichotomy and consider Urbanization approach. This is because several of the high-
entire urban continuum.3 This reconceptualization is critical income countries use a minimum population threshold
and aligns with the vision of the New Urban Agenda and below 5,000 inhabitants. For example, the US uses 2,500,
SDG 11 of fostering equitable regional development across Canada and New Zealand use 1,000 and Denmark and
all sizes and scales of human settlements while supporting Sweden use 200.
positive economic, social and environmental interlinkages
in these territories. Sustainable urban futures cannot These results highlight the broad agreement on the two
be realized using the traditional dichotomized or binary categories of human settlement at the extremes as well as
treatment of human settlements. the disagreement with regard to the middle of the urban-
rural continuum. Given the global population concentration
The discrepancy in how towns and other areas in the middle in Asia and Africa, the global population share in nationally-
of the urban-rural continuum are classified by national defined urban areas (54 per cent) has a closer resemblance
definitions has a statistically significant impact on the to the share of population in cities (48 per cent) than the
global level of urbanization. For example, the world would aggregate of cities plus towns and semi-dense areas (78 per
be substantially “more urban” if all such settlements were cent) as defined by the Degree of Urbanization.
Figure 2.1: Population by Degree of Urbanization and in nationally defined urban areas by SDG regions and income group, 2015
100%
90%
80%
70%
Share of population
60%
50%
40%
30%
20%
10%
0%
Low income
Lower-middle
income
Upper-middle
income
High Income
Oceania
Central and
Southern Asia
Sub-Saharan Africa
Eastern and South-
Eastern Asia
Northern Africa and
Australia and New
Zealand
World
Western Asia
Europe
Latin America and
the Caribbean
Northern America
Cities Towns and semi-dense area Rural Urban (national definition)
34
WORLD CITIES REPORT 2022

     Box 2.1: Levels and classes in the Degree of Urbanization methodology

     The Degree of Urbanization methodology offers more nuance than the “urban” and “rural” binary that categorizes the demographic
     classification of human settlements common in many national statistical offices. Instead of those two categories, the Degree of
     Urbanization approach proposes two levels of understanding with distinct classes of human settlement by analysing grid cells of one
     square kilometre (1 sq. km).

     Level 1 consists of three classes:

     1. Cities: settlements of at least 50,000 inhabitants in a high-density cluster of grid cells (greater than 1,500 inhabitants per sq. km)

     2. Towns and semi-dense areas: an urban cluster with at least 5,000 inhabitants in contiguous moderate-density grid cells (at least
        300 inhabitants per sq. km) outside cities

     3. Rural areas: grid cells with a density of less than 300 inhabitants per sq. km or higher density cells that do not belong to a city,
        town or semi-dense area

     Urban areas are defined as “cities” plus “towns and semi-dense areas.” It is recommended, however, to keep all three classes
     separate given their different nature.

     Level 2 uses six classes:

     1. Cities: same as above

     2. Towns: settlements with between 5,000 and 50,000 that are either dense (with a density of at least 1,500 inhabitants per sq. km)
        or semi-dense (a density at least 300 inhabitants per sq. km).

     3. Suburban or peri-urban areas: cells belonging to urban clusters but not part of a town

     4. Villages: settlements with a population between 500 and 5,000 inhabitants and a density of at least 300 inhabitants per sq. km.

     5. Dispersed rural areas: rural grid cells with a density between 50 and 300 inhabitants per sq. km.

     6. Very dispersed rural areas or mostly uninhabited areas: rural grid cells with a density between 0 and 50 inhabitants per sq. km.

The World Urbanization Prospects also lists cities with at least             provided by the World Urbanization Prospects, this data
300,000 inhabitants. Comparing these designations with the                   set produces boundaries with a high spatial resolution. The
cities identified by the Degree of Urbanization shows a very                 cities are defined using a grid of one square kilometre (1 sq.
high overlap.5 This confirms that national definitions and the               km) cells. This means that city population densities can be
Degree of Urbanization agree on what constitutes a large city.               calculated and compared in a meaningful way.
However, compared to the data in the World Urbanization
Prospects, the data used here has several advantages (Box
2.2). The concept of “city” and its definition here have been                The cities are defined using a grid of one square
harmonized whereas the World Urbanization Prospects                          kilometre (1 sq. km) cells. This means that city
employs a mixture of city proper, urban agglomeration and                    population densities can be calculated and
metropolitan areas. Second, instead of the point locations                   compared in a meaningful way

35
Scenarios of Urban Futures: Degree of Urbanization

      Box 2.2: Advantages of the Degree of Urbanization methodology: A summary

      The Degree of Urbanization methodology:

      • captures the urban-rural continuum through three different classes at level 1 and through six different classes at level 2 of the
        methodology’s classification system (Box 2.1: Levels and classes in the Degree of Urbanization methodology);

      • uses the same population size and density thresholds across the world;

      • starts from a population grid to reduce the bias of using spatial units with different shapes and sizes;

      • measures population clusters directly instead of indirectly by using building clusters as an approximation of population clusters;

      • defines areas independently from their access to services to ensure that this access can be monitored reliably, in other words,
        without interference from the definition;

      • proposes a relatively cost-effective approach that can be applied to existing data collections.

      Source: European Union et al, 2021.

Aerial view of Barcelona, Spain © Shutterstock

                                                                                                                                                         36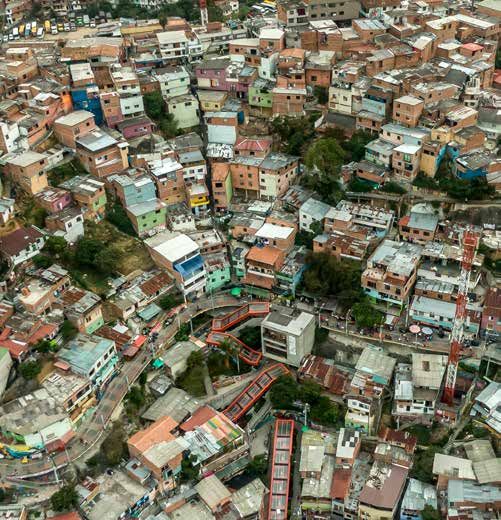
WORLD CITIES REPORT 2022

Figure 2.2: City population growth through expansion, annexation and new cities in Hanoi, Viet Nam and Debrecen, Hungary

Source: Adapted from UNDESA, 2001.

As a city expands, it incorporates the population of the           According to different scenarios, in particular regarding the
surrounding rural and semi-dense areas and can annex               decline of fertility rates in developing countries, the peak for
nearby towns (Figure 2.2a). When a town grows, it can pass         global population growth could be reached between 2070 and
the minimum population threshold and become a new city             the end of the 21st century.8 Apart from differences in timing,
(Figure 2.2b). In both cases, the total population has grown,      the completion of demographic transition in developing
but the initial population of the rural and semi-dense areas       countries is expected to parallel urban transitions and lead to
as well as the towns are merely reclassified. This population      a convergence of urban population growth rates towards the
was already there before the city expanded or became a new         low level already reached by highly urbanized countries.9
city. Measuring the impact of reclassification separately is a
longstanding United Nations recommendation.6 Previously,           Within this general theoretical framework, the trends of
this task has been difficult to achieve due to the lack of a       urbanization in developing countries and emerging economies
harmonized definition and boundaries with a high spatial           exhibit unique features with respect to what happened
resolution. This chapter, however, looks at the impact of          during industrialization in the 19th century. While increases
reclassification in subsequent sections.                           in the share of urban population are only slightly higher by
                                                                   historical standards, developing countries are characterized
Generally, the high growth rates of urban population in the        by an unprecedented growth of urban population in absolute
World Urbanization Prospects have dominated the debates            terms mostly due to their high national population growth.10
on urbanization in recent decades. However, the differences
between the national definitions and the unclear impact of the     In terms of economic development, the previous two
reclassification of areas have led to an overestimation of urban   editions of the World Cities Report have highlighted
growth rates, an emphasis on challenges for megacities relative    the positive link between urban areas and economic
to small- and medium-sized cities, and an underestimation of       development. The World Cities Report 2016 showcased
the relevance of urban natural increase versus rural-to-urban      urbanization as a transformative trend, with urban areas
migration as a source of city population growth.7                  described as “a positive and potent force for addressing

37
Scenarios of Urban Futures: Degree of Urbanization

sustainable economic growth, development and prosperity,                  future of cities. In relation to climate change, for instance,
and for driving innovation, consumption and investment                    the IPCC points out that the resulting sea-level rise—which is
in both developed and developing countries.”11 The World                  expected to significantly increase by the end of this century—
Cities Report 2020 reinforced this message by stating that                poses risks to high-density coastal urban developments in both
urban areas generate enormous economic value, although                    developing and developed countries.14
the economic value generated varies depending on the
local context.12 For instance, while the linkages between
urbanization and economic growth have been apparent
in Eastern and South-Eastern Asia, several authors have
highlighted that the relationship between urbanization
and economic development has decoupled in Sub-Saharan
Africa, citing several reasons e.g. widespread neglect and
bad management of cities, among other factors.13

In relation to environmental sustainability, the World Cities
Report 2020 notes that urbanization, if unplanned or
unmanaged, presents threats such as “unbridled urban sprawl,
irreversible land-use changes and biodiversity loss, resource
and energy-intensive consumption patterns, and high levels
of pollution and carbon emissions.” In the same vein, Chapter
5 of this Report stresses the threat posed by the twin crises
of climate change and the loss of global biodiversity to the              Metro Manila, Philippines © Shutterstock

   Box 2.3: Projections and data sources for the Degree of Urbanization methodology

   The projections presented in this chapter produce different estimates of urban and rural population as compared to national
   definitions for two main reasons. First, some national definitions include medium-sized settlements or towns in the urban category,
   while others categorize them as rural. The Degree of Urbanization classifies these settlements into its own category: “towns and semi-
   dense areas.” The second reason is that the projections of population by Degree of Urbanization are not derived from an extrapolation
   of the trends of rural and urban population aggregated at the national level, as normally done in the United Nations World Urbanization
   Prospects,15 but from a bottom-up approach starting at the grid cell level.

   With the Degree of Urbanization approach, urbanization is not predetermined from national trends but emerges from a gravity model
   that reflects the surrounding and attractiveness of each grid cell. The parameters used in this model have been estimated for different
   regions of the world and are based on changes in population and built-up area grids between 1975 and 2015.

   Since the population by Degree of Urbanization is based on geographically-detailed data, it is possible to do a more detailed analysis.
   The Degree of Urbanization can be applied at multiple points in time, which makes it possible, for example, to measure the impact of
   expansion and densification separately for each city.

   In terms of data sources, the projections and trends in this chapter rely on three distinct data sets. For the period 1950 to 1975, the
   population by Degree of Urbanization has been estimated by combing data based on national definitions from the World Urbanization
   Prospects and estimates of the population by the Degree of Urbanization for 1975 produced by the European Commission’s Joint
   Research Centre (JRC). From 1975 to 2015, the data relies global estimated population grids for 1975, 1990, 2000 and 2015 produced
   by the JRC. The data from 2015 to 2070 relies on projected population grids produced by Jones et al. (2020). The national population
   projections are derived from the Shared Socioeconomic Pathway 2: Middle of the Road scenario as prepared by the International
   Institute for Applied Systems Analysis (IIASA).

                                                                                                                                                              38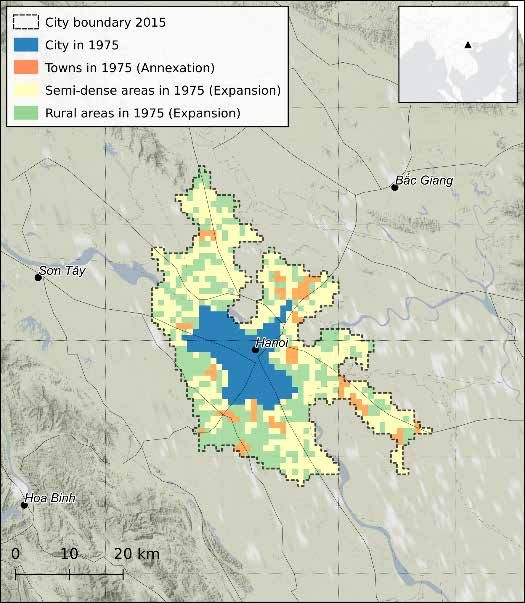
WORLD CITIES REPORT 2022

2.2. City Population Continues Growing                          Over the past seven decades, the world has experienced
     as Towns and Rural Areas Experience                        significant population growth and notable demographic
     Slowdown                                                   “megatrends,” including urbanization, which have significant
                                                                implications for economic and social development as well
Urbanization undoubtedly presents a unique opportunity          as environmental sustainability.17 In 1950, the global
for social and economic progress.16 On the other hand, as       population was relatively small at only 2.5 billion and mostly
highlighted in Chapter 1, it also presents challenges when      rural. By 2020, the global population had grown to 7.8 billion
planning systems and public institutions are not equipped       and most people lived in cities. This transformation has
to deal with the challenges posed by rapid urbanization.        had big economic, social and environmental consequences
Rapid population growth in cities, for instance, can lead to    which various chapters of this report examine with a view to
congestion and crowding when it is not anticipated with         achieving sustainable futures.
adequate infrastructure and housing and when the expansion
of the city is not properly planned and managed. As a result,   In 1950, most people lived in rural areas, followed by
the population growth in cities, especially rapid growth, is    towns and semi-dense areas, while cities were the least
a central concern as humanity moves into a future that is       inhabited. Faster growth in city population meant that by
predominantly urban.                                            1965, the global population was equally distributed across
                                                                these three types of areas (Figure 2.3). By 1990, the order
Uncovering some of these demographic trends using a             had reversed with most people living in cities, followed
harmonized global methodology that captures the urban-          by towns and semi-dense areas, and then rural areas last.
rural continuum in a consistent manner is therefore             In 2020, almost half the global population lived in cities,
fundamental. In this regard, this section applies the Degree    while 29 per cent lived in towns and semi dense areas and
of Urbanization to briefly examine the demographic trends       22 per cent in rural areas.
of the three classes of settlements that comprise Level 1 in
Box 2.1. It provides a synopsis of previous decades before      However, this large transformation is projected to slow
venturing into future projections of what is expected to        into the future. Demographic growth has already started to
unfold until 2070. Similarly, using this harmonized data, it    decelerate and is projected to continue to do so over the
peeks into future anticipated land-cover changes.               coming decades. The share of population in cities is projected

39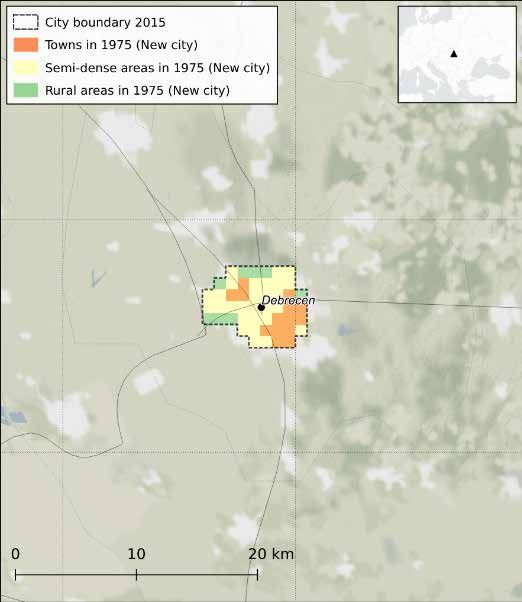
Scenarios of Urban Futures: Degree of Urbanization
The rural population, on the other hand, has grown more
The share of population in cities is projected to slowly than total population from 1975 to 2020. This growth
grow at a slower pace to reach 58 per cent of is projected to continue to slow down until 2050, after
the global population in 2070, while the share in which a slight decrease in absolute numbers is expected. As
towns and semi-dense areas is expected drop to a result, its population share has dropped from 38 per cent
24 per cent in 1950 to 22 per cent in 2020 and to 18 per cent in 2070.
to grow at a slower pace to reach 58 per cent of the global In terms of geographic regions, data from the Degree of
population in 2070, while the share in towns and semi-dense Urbanization shows Sub-Saharan Africa and Oceania to be
areas is expected drop to 24 per cent. having the lowest city population share in 1950 (Figure
2.4). These two regions—together with Northern Africa
Notably, the population in towns and semi-dense areas has and Western Asia—are projected to experience the biggest
generally grown at the same speed as the total population increase in the city population share in the future. On the
between 1950 and 2020. As a result, it has maintained its other end of the spectrum, Europe will experience the
population share of 30 per cent over that period, but the smallest increase in its city population share among the
absolute number of people in these areas tripled from 750 regions. In most regions, the population share will drop in
million to 2.25 billion. The population in these settlements is both rural areas as well as towns and semi-dense areas. In
projected to continue growing, but more slowly than the total the Americas, Europe, Australia and New Zealand, however,
population. Between 2050 and 2070, however, population the population share in towns and semi-dense areas barely
in towns and semi-dense areas will start declining. changes over time.
Figure 2.3: Evolution of population by degree of urbanization 1950–2070 in absolute and relative terms
10
9
8
Population (Billions)
7
6
5
4
3
2
1
0
1950
1955
1960
1965
1970
1975
1980
1985
1990
1995
2000
2005
2010
2015
2020
2025
2030
2035
2040
2045
2050
2060
100% 2070
90%
80%
% of total population
70%
60%
50%
40%
30%
20%
10%
0%
1950
1955
1960
1965
1970
1975
1980
1985
1990
1995
2000
2005
2010
2015
2020
2025
2030
2035
2040
2045
2050
2060
2070
Cities Towns Rural
40WORLD CITIES REPORT 2022
Figure 2.4: Population share by degree of urbanization and SDG region (1950–2070) ordered by city population share in 1950
Oceania Sub-Saharan Africa Eastern and South-Eastern Asia
100%
90%
80%
70%
60%
50%
40%
30%
20%
10%
0%
1950
1960
1970
1980
1990
2000
2010
2020
2030
2040
2050
2060
2070
1950
1960
1970
1980
1990
2000
2010
2020
2030
2040
2050
2060
2070
1950
1960
1970
1980
1990
2000
2010
2020
2030
2040
2050
2060
2070
Northern Africa and Western Asia Northern America Europe
100%
90%
80%
70%
60%
50%
40%
30%
20%
10%
0%
1950
1960
1970
1980
1990
2000
2010
2020
2030
2040
2050
2060
2070
1950
1960
1970
1980
1990
2000
2010
2020
2030
2040
2050
2060
2070
1950
1960
1970
1980
1990
2000
2010
2020
2030
2040
2050
2060
2070
Latin America and the Caribbean Central and Southern Asia Australia and New Zealand
100%
90%
80%
70%
60%
50%
40%
30%
20%
10%
0%
1950
1960
1970
1980
1990
2000
2010
2020
2030
2040
2050
2060
2070
1950
1960
1970
1980
1990
2000
2010
2020
2030
2040
2050
2060
2070
1950
1960
1970
1980
1990
2000
2010
2020
2030
2040
2050
2060
2070
City Town and semi-dense areas Rural
Nairobi, Kenya © Kirsten Milhahn/UN-Habitat
41Scenarios of Urban Futures: Degree of Urbanization
Figure 2.5: Population share by degree of urbanization and income level (1950–2070)
Low income Lower-middle income
100%
90%
80%
70%
60%
50%
40%
30%
20%
10%
0%
1950
1960
1970
1980
1990
2000
2010
2020
2030
2040
2050
2060
2070
1950
1960
1970
1980
1990
2000
2010
2020
2030
2040
2050
2060
2070
Upper-middle income High income
100%
90%
80%
70%
60%
50%
40%
30%
20%
10%
0%
1950
1960
1970
1980
1990
2000
2010
2020
2030
2040
2050
2060
2070
1950
1960
1970
1980
1990
2000
2010
2020
2030
2040
2050
2060
2070
City Town and semi-dense areas Rural
When these demographic changes are assessed in terms of The growth of population in cities, towns and semi-dense
income groups, the data show that low-income countries had areas invariably leads to spatial expansion. Past studies
the smallest share of city population (17 per cent) in 1950, have shown urban land area growing at a higher rate than
while high-income countries had the highest share (31 per population and, relatedly, population densities have also
cent). Because city population shares in low-income countries been declining as a result of more dispersed patterns of
increased faster than in high-income countries, this gap has urbanization in the form of urban sprawl.18 These trends
shrunk from 14 to 7 percentage points and is projected to significantly affect the environment and have profound
drop to 5 percentage points by 2070 (Figure 2.5). socioeconomic repercussions. These effects include negative
impacts on ecosystem services and increased energy
Over the past decades, population growth rates in lower- consumption, higher cost of providing infrastructure (often
income countries have been higher than in other countries. leading to the uneven or unequal distribution of services), a
This trend is expected to continue. By contrast, high-income
countries have had relatively low population growth rates,
which are projected to slow further and reach almost zero sustainable futures call for slowing down
by 2070. Upper- and lower-middle-income countries have urban sprawl and, if possible, ensuring that
also experienced higher growth rates in the past decades, the compactness of cities is maintained or
but they are also slowing down. The population of upper- increased over time in line with Target 11.3 of
middle-income countries is even projected to shrink from SDG 11
2040 onwards.
42WORLD CITIES REPORT 2022
reduction in the economies of agglomeration and decreased 2.3. What is Driving Population Growth in
urban productivity, among others. Yet, sustainable futures Cities?
call for slowing down urban sprawl and, if possible, ensuring
that the compactness of cities is maintained or increased The previous section and Chapter 1 show that urbanization
over time in line with Target 11.3 of SDG 11—which also is pervasive although the level, pace and processes driving
provides a measure of how efficiently cities “utilize” land.19 urbanization are uneven across the world. The previous
sections of this chapter have also described nuanced trends
The Degree of Urbanization shows that the share of land along the urban-rural continuum based on the classes in new
occupied by cities is small (0.5 per cent in 2020), but has global definition (“cities,” “towns and semi-dense areas”
been growing (from 0.2 per cent in 1975) and is projected and “rural areas”). This section delves into the most distinct
to keep growing (to 0.7 per cent in 2070) (Figure 2.6). In and unique pattern emerging at the global level that carries
contrast, land covered by towns and semi-dense areas double significant implications for urban futures: population growth
between 1975 and 2020, but it is projected to start shrinking in cities.20
from 2040 onwards due to conversion to city and rural land.
This projection also indicates that the amount of urban land Depending on how it is managed, population growth in cities
is likely to shrink after 2050. can contribute to sustainable urban futures and deliver on
the optimistic scenario described in Chapter 1 by increasing
City land in low-income countries has been growing rapidly economic productivity, spurring innovations and new ideas
and is projected to more than double between 2020 and 2070 that enable people to find a better job and better access to
(Figure 2.7). Additionally, land covered by towns and semi- services. On the other hand, if this growth is not planned for
dense areas in low-income countries is projected to grow, but and well-managed, it can exacerbate poverty and inequality
at a slower pace (+50 per cent between 2020 and 2070). (increasing the population of slums or poorly-serviced
In contrast, upper-middle-income countries are projected to neighbourhoods), compound environmental problems and
experience the slowest increase in city land (+10 per cent
between 2020 and 2070) and land covered by towns and semi-
dense areas is likely to shrink, in part due to their shrinking Depending on how it is managed,
population. Urban land in lower-middle- and high-income population growth in cities can
countries is projected to grow, but the pace slowing over time contribute to sustainable urban
to reach almost zero between 2060 and 2070. futures
Figure 2.6: Land covered by cities, towns and semi-dense areas, 1975–2070
100%
90%
80%
70%
60%
50%
40%
30%
20%
10%
0%
1975 1990 2000 2010 2020 2030 2040 2050 2060 2070
0.54% 0.72% 0.83% 0.98% 1.09% 1.12% 1.12% 1.10% 1.05% 0.99%
0.22% 0.31% 0.39% 0.46% 0.52% 0.58% 0.63% 0.66% 0.69% 0.70%
City Town and semi-dense areas
43Scenarios of Urban Futures: Degree of Urbanization
Figure 2.7: Land covered by cities, towns and semi-dense areas and income group, 1975–2070
Land covered by cities, towns and semi-dense areas in low Land covered by cities, towns and semi-dense areas in Lower-
income countries, 1975-2070 middle income countries, 1975-2070
1.0% 3.5%
0.9%
3.0%
0.8%
As a share of total land
As a share of total land
0.7% 2.5%
0.6%
2.0%
0.5%
1.5%
0.4%
0.3% 1.0%
0.2%
0.5%
0.1%
0% 0%
1975 1990 2000 2010 2020 2030 2040 2050 2060 2070 1975 1990 2000 2010 2020 2030 2040 2050 2060 2070
0.10% 0.14% 0.19% 0.24% 0.29% 0.32% 0.35% 0.38% 0.41% 0.43% 0.75% 0.95% 1.14% 1.41% 1.62% 1.73% 1.80% 1.86% 1.90% 1.91%
0.07% 0.09% 0.11% 0.15% 0.19% 0.23% 0.29% 0.35% 0.40% 0.45% 0.31% 0.49% 0.65% 0.82% 0.98% 1.13% 1.26% 1.35% 1.40% 1.42%
Land covered by cities, towns and semi-dense areas Upper- Land covered by cities, towns and semi-dense areas in high
middle income countries, 1975-2070 income countries, 1975-2070
1.8% 1.8%
1.6% 1.6%
1.4% 1.4%
As a share of total land
As a share of total land
1.2% 1.2%
1.0% 1.0%
0.8% 0.8%
0.6% 0.6%
0.4% 0.4%
0.2% 0.2%
0% 0%
1975 1990 2000 2010 2020 2030 2040 2050 2060 2070 1975 1990 2000 2010 2020 2030 2040 2050 2060 2070
0.49% 0.76% 0.90% 1.07% 1.19% 1.22% 1.19% 1.11% 0.99% 0.85% 0.67% 0.75% 0.79% 0.87% 0.91% 0.91% 0.90% 0.89% 0.87% 0.85%
0.17% 0.25% 0.31% 0.35% 0.39% 0.41% 0.43% 0.43% 0.44% 0.44% 0.32% 0.39% 0.47% 0.51% 0.58% 0.64% 0.68% 0.72% 0.75% 0.78%
City Town and semi-dense areas
pose challenges to the achievement of net-zero goal, thus 2.3.1. Natural growth is the main driver of city
leading to the pessimistic or even high damage scenarios population growth
described in Chapter 1. As a result, this section, using Several studies have warned about the frequent
new data from the harmonized definition of cities in the overestimation of the role of rural-urban migration in the
Degrees of Urbanization approach, revisits the drivers of rapid urban growth recorded in last decades in particular in
city population growth, including the questions of how cities Sub-Saharan Africa.21 Despite using different methodologies
expand, how new cities emerge and how the age of a city’s to understand the demographic drivers of urban growth,
population differs from those in the rest of the country. these studies generally agree that about 60 per cent of the
44WORLD CITIES REPORT 2022
urban population increase is attributable to natural growth population in low-income countries is projected to increase
and the remaining 40 per cent is due to the combined effect by 12 per cent. Two-thirds of this increase (8 per cent) stems
of migration and reclassification of areas. Because most from natural change (fixed share) and only one-third from
of the growth in city population is due to natural change rural-to-city migration (change in share).
and expansion, restricting migration into cities would have
relatively little impact.22 In high-income countries, both components (fixed share and
change in share) contribute equally to growth, and both are
These warnings and estimates are confirmed by the analysis shrinking over time. In upper-middle-income countries, the
of city population growth over time (Figure 2.8). In lower- contribution of the natural change (fixed share) is decreasing
middle- and low-income countries, city population growth is at a faster rate than rural-to-city migration (change in share)
mainly determined by natural change (captured in the fixed and becomes negative after 2040. This decline is because
share component, see Box 2.4). The influence of city-to-rural the national population is projected to shrink from 2040
migration (captured by the change in share component) onwards and only the rural-to-city migration ensures that city
has been dropping over time and is projected to continue populations continue to grow.
to do so. For example, between 2060 and 2070, the city
Box 2.4: Different drivers of population change
National population change is often broken down into “natural change” (the difference between the numbers of births and
deaths) and “net migration” (the difference between in-migration and outmigration). At the national level, this natural change and
international net-migration data are usually available. Measuring population change at the city level, however, is more complicated.
At the city level, net migration has to consider both international and internal migration. Data is usually not available for natural
change at the city level. Finally, the boundaries of a city can change over time, leading to a reclassification of population. As a result,
this chapter splits population growth in two different ways.
City population growth can be split into two components based on the changes in the city population share:
• Fixed share shows how much the population of a city would grow if its share of the national population remained fixed. This
would be the case if it had the same natural change and net-migration rate as its country did. In lower-income countries, this will
primarily be driven by natural change.
• Change in share shows how much the population of a city grows because its share of the national population changed. This share
can grow due to net migration, expanding city boundaries and differences in natural change. In lower-income countries, this will
be mainly driven by rural-urban migration.
City population growth can also be split into change and reclassification:
1. Population change:
i. Within the initial boundaries of the city.
ii. Within areas that are newly classified as a city.
2. Reclassification: Initial population in areas that are newly classified as (part of) a city.
i. Expansion: Rural, suburban and peri-urban areas that have been added to a city.
ii. Annexation: A town is added to a city.
iii. A new city: An area, typically a town or village, grows enough in population and density to be classified as a city.
45Scenarios of Urban Futures: Degree of Urbanization
Figure 2.8: Components of city population growth, 1960–2070
70%
City population growth over the previous decade
60%
50%
40%
30%
20%
10%
0%
1960
1980
2000
2020
2040
2060
1960
1980
2000
2020
2040
2060
1960
1980
2000
2020
2040
2060
1960
1980
2000
2020
2040
2060
-10%
Low income Lower-middle income Upper-middle income High income
Fixed population share in cities Changes in the population share in cities
2.3.2. Expanding cities and new cities Most new cities will be towns that have grown to attaining
One important, and often ignored, driver in expansion of city the threshold for “city” classification as per the Degree of
population is represented by the changes in the classification Urbanization harmonized definition. The contribution of
of an area. So far attempts to explicitly account for the role these reclassifications is higher in low-income countries and
of reclassification in explaining urban growth have been leads to a 5 per cent increase city population per decade.
hindered by the lack of harmonization in the definitions Further, from the spatial analysis using the Degree of
and the absence of detailed boundaries. However, with the Urbanization approach, the transformation of a rural area
new definitions and by using spatial methods applied on directly to city can also be observed in low-income countries.
population grids, some studies have started to demonstrate This phenomenon, however, does not happen in countries
how this role is far from being negligible.23 with higher incomes.
As population grows, some areas originally classified as towns In high-income countries, new cities will be rare. Between
or rural areas are reclassified as cities and their population 2060 and 2070, new cities are projected contribute to
starts to contribute to city population growth. The other increase the city population by only 0.5 per cent. In contrast,
sources of city population growth are natural change in low-income countries the emergence of new cities
and migration. By applying the classification by Degree of between 2060 and 2070 is projected to increase the city
Urbanization at multiple points in time, the impact of the population by 2.3 per cent. The emergence of new cities
change in classification for each cell can be captured and of small size poses challenges in terms of urban governance
aggregated. Overall, the spatial expansion of cities and the for low-income countries. The previous World Cities Reports
emergence of new cities are projected to contribute between
20–40 per cent of the growth in city population. However,
as highlighted in the previous subsection, most population the spatial expansion of cities and
growth in cities is due to natural change (fixed share) and the emergence of new cities are
most of that growth will occur within the initial boundaries projected to contribute between
of a city, while reclassification will add less and less to city 20–40 per cent of the growth in city
populations (Figure 2.9). population
46WORLD CITIES REPORT 2022
Figure 2.9: The role of reclassification in city population growth during the previous decade, 2030–2070
30%
To realize sustainable urban futures, an
integrated and territorial approach to urban
25%
development is imperative
City population growth over the previous decade
To realize sustainable urban futures, an integrated and
20%
territorial approach to urban development is imperative.
Various levels of government can develop and implement
15% national urban policies and strategies that ensure integrated
spatial growth and development to harness the potential
of such small and intermediate cities within national
10% urban systems. These settlements offer a significant, but
often untapped, potential for achieving the Sustainable
Development Goals and contributing to sustainable futures.
5% The poor data and information on these cities pose severe
challenges for evidence-based policy formulation. For
instance, the lack of sufficient geographic detail and of a
0%
harmonized definition makes it impossible to unpack the
2030
2040
2050
2060
2070
2030
2040
2050
2060
2070
2030
2040
2050
2060
2070
2030
2040
2050
2060
2070
specific components of urban growth.
Low income Lower-middle Upper-middle High income
-5% income income
In low-income countries, expansion and annexation account
for a relatively small share of city population growth and the
Initial population annexation and expansion areas
Initial population in new cities
high growth rates are mainly driven by population growth
Population growth within boundaries of the initial city and new city areas within the initial city boundaries and the new city areas
(Figure 2.10). On the other hand, expansion and annexation
are more important in high-income countries because cities
have highlighted the plight of secondary or intermediary
cities in most countries. Often, these cities face challenges in
managing urbanization. They struggle to attract investments;
generate employment; and meet the demand for housing,
infrastructure and basic urban services.24
asymmetrical development
compounds the urban spatial divide
Despite these challenges, policy discussions on urbanization
have been dominated in the past by their attention on the
unprecedented growth of megacities and large cities. As
illustrated in Chapter 4, the “winner-takes-all” phenomenon
propels megacities and large cities to growing economically
faster than others creating more localized development as
opposed to allowing more diffused spatial development across
territories. Such asymmetrical development compounds the
urban spatial divide, especially with regard to secondary cities—
whose populations, especially in regions such as Sub-Saharan
Africa, often face multiple deprivations relating to income and
employment, water and sanitation, health and housing.25 Medellin, Colombia © Kirsten Milhahn/UN-Habitat
47Scenarios of Urban Futures: Degree of Urbanization
Figure 2.10: City population growth between 2020 and 2030 of the lines for children do not change substantially, but tend
by city size, income group and source of growth to shift downwards. This indicates an overall reduction in
the share of children at the country level, but illustrates no
25%
fundamental changes in rural/city differences.
Population growth between 2020 and 2030 in existing cities
In upper-middle-income countries, a reduction of the intercept
20%
between 2050 and 2000 shows the effect demographic
transition in terms of changes of overall age structure at
national level. This change is also accompanied by a flattening
15% of the lines, which indicates that rural areas are converging
towards the lower fertility and mortality levels found in cities.
10% While differentials in age structure for the age groups of
children can be mainly attributed to fertility and mortality,
differences in other age groups stem both from cohort
5%
effects (population residing in the areas moving to the next
age group) and migration patterns which can also have a
strong age component.27
0%
In all income groups, the slopes invert from positive to
5M
5M
5M
5M
negative when moving from children to young adults’ cohorts.
This inversion indicates that cities attract more younger adults
Low income Lower-middle Upper-middle High income
income income relative to towns and rural areas. In low-income countries, the
slopes are more pronounced and the inversion is anticipated to
Population growth within the boundaries of the initial city and the new areas
the age group 15–19. For high-income countries, the negative
Due to initial population in expansion areas slope starts at age 20 in correspondence with migrations of
Due to initial population in annex areas students to cities for tertiary education.
Another inversion that can be observed after age 50,
tend to be surrounded by larger suburbs, which are absorbed particularly in high-income countries, denotes how population
by the city as it expands. This tendency is particularly the ageing is affecting rural areas. This trend is likely attributable
case for small cities, where the population of the surrounding to migrations from cities to rural areas in correspondence
suburbs is more important relative to the city population with retirement. Differentials in age distribution between
than is the case for larger cities. cities, towns and rural areas have implications both for the
ageing of population in countries in advanced stages of their
2.3.3. Cities attract more young adults, while rural demographic transition and for countries with still high
areas have more children fertility rates and large youth populations.
In the rural areas of low- and lower-middle-income countries,
children as a share of the rural population is higher than the Overall, the large share of youth population in cities is expected
share of children in the city population (Figure 2.11). These to persist. If accompanied by favourable conditions, large
higher shares reflect the higher fertility rates in rural areas youth bulges concentrated in cities of developing countries
which is documented in several analyses based on Demographic represent the source of a demographic dividend. In the
and Health Survey data.26 Between 1950 and 2050, the slopes absence of such conditions, they pose several demographic
and socio-economic challenges. Provided there are sufficient
employment opportunities, a large youth population frees up
In the rural areas of low- and resources for investments and boosts productivity. 28 This
lower-middle-income countries, positive effect holds true irrespective of the level of income
children as a share of the rural and geographical area. Where employment opportunities are
population is higher than the share lacking, youth bulges may be a source of unrest, violence
of children in the city population and conflicts.29
48WORLD CITIES REPORT 2022
Figure 2.11: Population share by age group in cities, towns and semi-dense areas, and rural areas in 1950, 2020 and 2050
00-04 05-09 10-14 15-19 20-24 25-29 30-34 35-39 40-44 45-49 50-54 55-59 60-64 65-69 70-74 75-79 80+
15%
High 10%
income 5%
0%
15%
Upper- 10%
middle 5%
income
0%
15%
Lower- 10%
middle 5%
income
0%
15%
Low 10%
income 5%
0%
City Town Rural 1950 2020 2050
Note: This graph shows the population share for five-year age groups by Degree of Urbanization for three points in time. The data points of the three classes of the Degree of
Urbanization are connected by a line. A line with an upward slope means that a higher share of that age groups lives in rural areas as compared to cities. A line with a downward
slope means that a higher share of that age group lives in cities as compared to rural areas.
2.4. Growth in Cities is Slowing Down, but some based on size of cities (Box 2.5), income grouping and
Less for Large Cities geographic region. Some will even experience population
loss and shrinkage in the future.
More than a decade ago, the UN-Habitat flagship report
State of the World Cities 2008/09 described cities as “one
of humanity’s most complex creations, never finished, never
definitive. They are like a journey that never ends. Their Box 2.5: City size classification
evolution is determined by their ascent into greatness or
their descent into decline. They are the past, the present and Cities as defined by the Degree of Urbanization are
the future.”30 The analysis of previous and anticipated future divided into four size classes:
trends using the harmonized definition of cities provides an
insight into this evolution of cities in a coherent way. As 1. Small cities have a population between 50,000 and
alluded to in previous sections, it shows that cities have been 250,000 inhabitants.
growing demographically and spatially and will continue to
do so. 2. Medium-sized cities have a population between
250,000 and 1 million inhabitants.
At the same time, the data paint a picture of overall growth:
the number of cities globally doubled between 1975 and 3. Large cities have a population between 1 and 5
2020 to 14,000. However, the data also show that the growth million inhabitants.
in the number of cities will slow down—with only another
3,000 new cities appearing over the next 50 years. As the 4. Very large cities have a population of a least 5 million
following subsections will illustrate, this global slowdown in inhabitants.
the growth of the number of cities hides a lot of variation,
49Scenarios of Urban Futures: Degree of Urbanization
Figure 2.12: Growth in the number of cities 1975–2070 by income group
9,000
8,000
7,000
Number of cities
6,000
5,000
4,000
3,000
2,000
1,000
0
1970 1980 1990 2000 2010 2020 2030 2040 2050 2060 2070
High Income Upper-middle income Lower-middle income Low Income
2.4.1. Cities in low-income countries continue to From a geographical perspective, the two regions with the
grow in numbers biggest absolute increase in the number of cities between
Low-income countries experienced the largest increases in 1975 and 2020 are Central and Southern Asia (+2,500)
the number of cities between 1975 and 2020 (+270 per and Sub-Saharan Africa (+1,800) (Figure 2.13). According
cent), while high-income countries experienced the smallest to the projections, they will also experience the biggest
increase (+30 per cent). Increases in middle-income increases between 2020 and 2070 (+850 and + 1,700,
countries were between these two extremes (+55 per respectively).
cent and +130 per cent) (Figure 2.12). Projections indicate
that, between 2020 and 2070, the number of cities in low- The two regions with the lowest relative increase in the
income countries will grow far more than in the rest of the number of cities between 1975 and 2020 are Europe, where
world. An increase of 76 per cent, compared to 6 per cent they remained constant, and Eastern and South-Eastern Asia,
in upper-middle-income countries. The number of cities in where they increased by 35 per cent. The projections also
high-income and lower-middle-income countries will both suggest that the growth in cities will remain low in these
increase by about 20 per cent. two regions. In Europe, the number of cities is projected
Figure 2.13 Growth in the number of cities 1975–2070 by region of the world
6,000
5,000
Number of cities
4,000
3,000
2,000
1,000
0
1970 1980 1990 2000 2010 2020 2030 2040 2050 2060 2070
Australia and New Zealand Central and Southern Asia Eastern and South-Eastern Asia
Europe Latin America and the Caribbean Northern Africa and Western Asia
Northern America Oceania Sub-Saharan Africa
50WORLD CITIES REPORT 2022
to increase by only 9 per cent between 2020 and 2070 especially in poorer countries, and urbanization by itself is
while the number of cities is projected to remain constant in not a sufficient condition for economic development.31
Eastern and South-Eastern Asia.
The new harmonized definition and data set allow us to
The biggest increase in cities with 1 or 5 million inhabitants capture primacy, or the relative importance of the biggest
between 2020 and 2070 is projected to happen in Sub- city, in two ways: (a) by calculating the population in the
Saharan Africa and Central and Southern Asia. In Sub- largest city relative to total city population in a country and
Saharan Africa, the number of cities with at least 1 million (b) via the Hirschman-Herfindahl Index (HHI), a common
inhabitants will increase from 60 to 134 over the next 50 measure of concentration.32 Noteworthy, because, for most
years and those with at least 5 million will increase from countries, it was not possible to obtain data for each city, most
six to 28. For Central and Southern Asia, the respective studies relied on a less suitable indicator: the population of
increases are from 117 to 183 and from 16 to 31. In all the largest city as a share of the national population.
other regions, the increase is much lower. Notably, Eastern
and South-Eastern Asia is projected to see a small reduction Overall, primacy tends to be higher in smaller countries as well
of cities with at least 5 million, from 29 to 27. as in more developed countries (Table 2.1). A small country may
only have a single city, leading to high primacy. For example,
2.4.2. In more developed countries, the largest city Bahrain, Lesotho, Mauritius, Timor-Leste and Singapore only
tends to be more important have one city. In a large country, a single city cannot capture
Urbanization and the concentration of population in cities a large share of the country’s city population. For example,
is seen by standard economic geography as a finite and in India the biggest city only accounts for 4 per cent of the
beneficial process, part of the transformation from agrarian country’s city population. The city population share in the
to industrialized societies. Higher concentration has largest city decreases from 69 per cent in small countries (1 to
been historically associated with economic development, 5 million total population) to 21 per cent on average in very
improvements in living standards, better education, large countries (i.e., with more than 100 million inhabitants);
lower fertility, technological development and increased HHI decreases from 56 per cent on average in small countries
productivity. However, these outcomes are not guaranteed, to 8 per cent on average in very large countries.
Figure 2.14: Number of cities with at least 1 or 5 million inhabitants per region, 2020–2070
250 80
70
200
60
150 50
40
100 30
20
50
10
0 0
Sub-Saharan Africa
Central and Southern Asia
Northern Africa and Western Asia
Australia and New Zealand
Northern America
Latin America and the Caribbean
Europe
Oceania
Eastern and South-Eastern Asia
Sub-Saharan Africa
Central and Southern Asia
Australia and New Zealand
Northern Africa and
Western Asia
Latin America and the
Caribbean
Northern America
Europe
Asia
Oceania
Eastern and South-Eastern
2020 2030
2050 2070
2020 2030 2050 2070 Increase 2020-2070 (right axis) Increase 2020-2070 (right axis)
51You can also read