Russo, Alessio ORCID: 0000-0002-0073-7243, Chan, Wing Tung and Cirella, Giuseppe T (2021) Estimating Air Pollution Removal and Monetary Value for ...
←
→
Page content transcription
If your browser does not render page correctly, please read the page content below
This is a peer-reviewed, final published version of the following document and is licensed under
Creative Commons: Attribution 4.0 license:

           Russo, Alessio ORCID: 0000-0002-0073-7243, Chan, Wing Tung
           and Cirella, Giuseppe T (2021) Estimating Air Pollution
           Removal and Monetary Value for Urban Green Infrastructure
           Strategies Using Web-Based Applications. Land, 10 (8). Art
           788. doi:10.3390/land10080788

Official URL: https://doi.org/10.3390/land10080788
DOI: http://dx.doi.org/10.3390/land10080788
EPrint URI: http://eprints.glos.ac.uk/id/eprint/10004

Disclaimer
The University of Gloucestershire has obtained warranties from all depositors as to their title in
the material deposited and as to their right to deposit such material.
The University of Gloucestershire makes no representation or warranties of commercial utility,
title, or fitness for a particular purpose or any other warranty, express or implied in respect of
any material deposited.
The University of Gloucestershire makes no representation that the use of the materials will not
infringe any patent, copyright, trademark or other property or proprietary rights.
The University of Gloucestershire accepts no liability for any infringement of intellectual
property rights in any material deposited but will remove such material from public view
pending investigation in the event of an allegation of any such infringement.

PLEASE SCROLL DOWN FOR TEXT.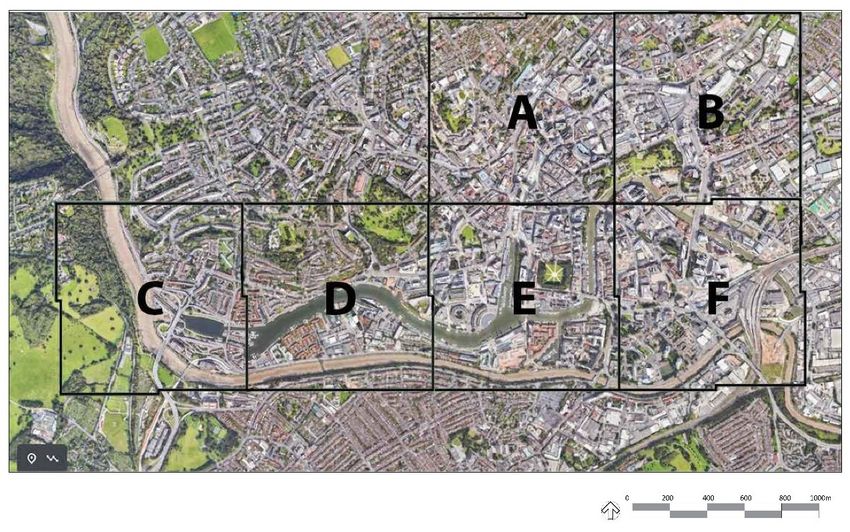
land
Communication
Estimating Air Pollution Removal and Monetary Value for
Urban Green Infrastructure Strategies Using
Web-Based Applications
Alessio Russo 1, * , Wing Tung Chan 1 and Giuseppe T. Cirella 2

                                          1   School of Arts, Francis Close Hall Campus, University of Gloucestershire, Swindon Road,
                                              Cheltenham GL50 4AZ, UK; wtung919@gmail.com
                                          2   Faculty of Economics, University of Gdansk, 81-824 Sopot, Poland; gt.cirella@ug.edu.pl
                                          *   Correspondence: arusso@glos.ac.uk; Tel.: +44-(0)1242-714557

                                          Abstract: More communities around the world are recognizing the benefits of green infrastructure
                                          (GI) and are planting millions of trees to improve air quality and overall well-being in cities. However,
                                          there is a need for accurate tools that can measure and value these benefits whilst also informing
                                          the community and city managers. In recent years, several online tools have been developed to
                                          assess ecosystem services. However, the reliability of such tools depends on the incorporation of
                                          local or regional data and site-specific inputs. In this communication, we have reviewed two of
                                          the freely available tools (i.e., i-Tree Canopy and the United Kingdom Office for National Statistics)
                                          using Bristol City Centre as an example. We have also discussed strengths and weaknesses for their
                                          use and, as tree planting strategy tools, explored further developments of such tools in a European

                                   context. Results show that both tools can easily calculate ecosystem services such as air pollutant
                                          removal and monetary values and at the same time be used to support GI strategies in compact cities.
Citation: Russo, A.; Chan, W.T.;
                                          These tools, however, can only be partially utilized for tree planting design as they do not consider
Cirella, G.T. Estimating Air Pollution
Removal and Monetary Value for
                                          soil and root space, nor do they include drawing and painting futures. Our evaluation also highlights
Urban Green Infrastructure Strategies     major gaps in the current tools, suggesting areas where more research is needed.
Using Web-Based Applications. Land
2021, 10, 788. https://doi.org/           Keywords: urban ecosystem services; urban tree planting; i-Tree Canopy; Office for National
10.3390/land10080788                      Statistics; health damage costs; United Kingdom

Academic Editor:
Thomas Panagopoulos
                                          1. Introduction
Received: 22 June 2021
                                                Air pollution caused by the growth of urbanization and industrialization continues to
Accepted: 25 July 2021
                                          plague societies in the twenty-first century [1]. Urbanization plays a major role in worsen-
Published: 27 July 2021
                                          ing ventilation conditions and increases the emissions of pollutants [2]. The transformation
                                          of land use, caused by urbanization, reduces ventilation quality via building morphology
Publisher’s Note: MDPI stays neutral
                                          and, indirectly, the urban wind velocity [3]. Air pollution derived from human activities
with regard to jurisdictional claims in
                                          comes from both indoor and outdoor environments [4]. It causes harm to health, decreases
published maps and institutional affil-
iations.
                                          economic growth, and augments social problems (i.e., by way of knock-on societal ef-
                                          fects) [5]. In 2015, the World Health Organization [6] estimated 4.3 million deaths occurred
                                          due to indoor air pollution and 3.7 million due to outdoor air pollution (i.e., 8 million
                                          for the year). Data published by the United Kingdom (UK) Royal College of Physicians
                                          demonstrates that there are around 40,000 fatalities each year due to air pollution [7].
Copyright: © 2021 by the authors.
                                               Several studies show that green infrastructure (GI) can improve air quality in cities [8–11].
Licensee MDPI, Basel, Switzerland.
                                          In particular, urban vegetation provides several ecosystem services and plays a vital role
This article is an open access article
                                          in air pollutant removal, heavy metal removal, rainwater interception, and microclimatic
distributed under the terms and
conditions of the Creative Commons
                                          improvements [12–14].
Attribution (CC BY) license (https://
                                                Planting millions, billions, or even trillions of trees as a simple solution to air pollution
creativecommons.org/licenses/by/
                                          and other major environmental problems is being proposed by an increasing number
4.0/).                                    of global, regional, and national projects [15]. Large tree planting can also improve life

Land 2021, 10, 788. https://doi.org/10.3390/land10080788                                                        https://www.mdpi.com/journal/land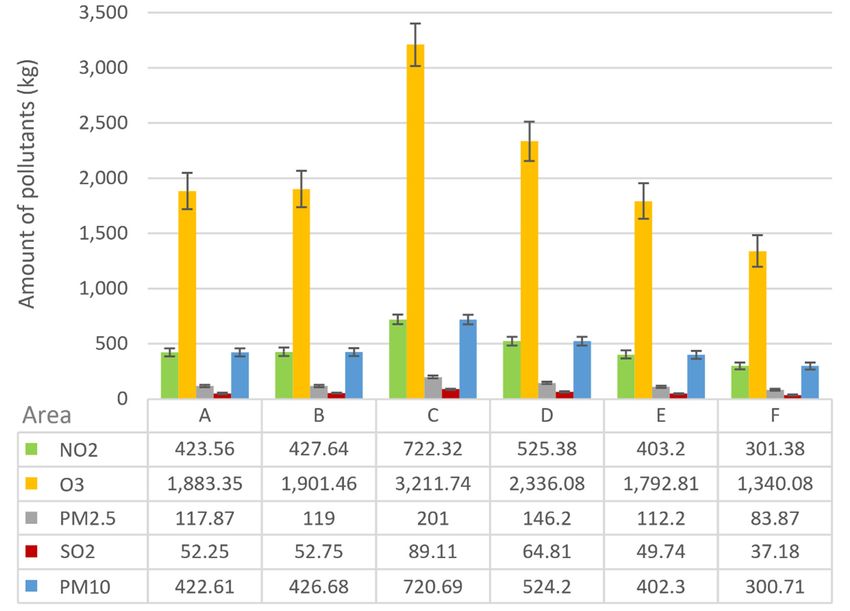
Land 2021, 10, 788                                                                                            2 of 17

                     satisfaction [16,17]. According to Jones’ [17] research, life satisfaction among NYC residents
                     improved by 0.018 points on a 4-point scale during the first three years of the Million
                     Trees NYC initiative, when over 400,000 trees were planted. This is a USD 505 increase
                     in per capita monthly family income, or a 6.5% gain. According to the existing literature
                     on the benefits of urban trees, the observed increases in life satisfaction following Million
                     Trees NYC could be due to improved air quality, lower ambient temperatures during the
                     spring and summer, lower crime rates, improved recreation and exercise opportunities, or
                     greater social and community cohesion [17]. Tree planting, however, is a lot more difficult
                     than it appears [15]. It takes between 15 and 40 years for a tree to grow a sufficiently
                     large canopy to offer several ecosystem services (e.g., aesthetics, reducing air pollution,
                     controlling rainwater, and carbon storage) [18]. However, street tree growth is influenced
                     by critical landscape design issues that affect access of the tree roots to water, air, and
                     nutrients [19]. Landscape architects and urban foresters should consider the concept of
                     “optimal planting,” which includes several factors such as the extent of rooting space and
                     the quality of urban soils for supporting trees [19,20]. Therefore, there is a need for tools
                     that can aid in the process of tree planting as well as the implementation of landscape
                     design in order to guarantee healthy trees can provide sufficient ecosystem services in the
                     built environment [21].
                           In addition to tree planting campaigns, several nations and towns throughout the
                     world have made deliberate pledges to provide high-quality GI [22,23]. In particular, GI
                     strategy (which outlines which GI and ecosystem service assets already exist and how they
                     can be improved [24]) serves as the foundation for policies and decisions on development
                     proposals in cities to avoid loss or harm before considering mitigation or compensatory
                     measures [25]. However, an issue raised in the scientific literature and by stakeholders
                     is a lack of reliable friendly user models with local data for assessing ecosystem services
                     that support GI strategies [26], as well as strong evidence on the most cost-effective and
                     sustainable models and procedures for long-term management and maintenance of high-
                     quality GI [22]. Therefore, rapid ecosystem services evaluation tools and models have
                     sparked widespread interest across all sectors; nonetheless, it is widely acknowledged that
                     systematic use of ecosystem services in decision- and policy-making necessitates a level of
                     accuracy that is seldom achieved in practice [27,28]. Experts from the disciplines of forestry,
                     agriculture, urban planning, and environmental engineering must collaborate to develop
                     accurate tools that can simulate plant-built environment interactions [29]. Fortunately,
                     numerous models that simulate and quantify energy, water flows, and ecosystem services in
                     various ecosystems already exist [29]. For example, the last few years have seen an increase
                     in the use of the United States Department of Agriculture, Forest Service i-Tree tools in the
                     American and international market (e.g., Australia, Canada, Mexico, South Korea, much
                     of the European Union, and the UK). Even though the science and development of the
                     i-Tree tools date back to the mid-1990s, the software suite was released as a framework
                     for science delivery in 2006 [30]. Today, i-Tree tools include several desktop applications
                     (e.g., i-Tree Eco and i-Tree Hydro) and web-based applications (e.g., i-Tree Canopy, i-Tree
                     Country, i-Tree Design, and i-Tree Species) that provide baseline data for tree benefits and
                     planning over time [26,31].
                           In the UK, for instance, several ecosystem services provided by GI that specifically
                     target air pollutant removal have been calculated using i-Tree tools. For example, dating
                     back to 2011, the i-Tree Eco project started in Torbay, England that has now been introduced
                     in more than 20 cities and towns [32,33]. In 2013, Natural England [34] evaluated three
                     of the tools (i.e., i-Tree Design, i-Tree Eco, and i-Tree Streets) for applications nationwide.
                     i-Tree Eco uses data collected using standardized time-consuming field methods that
                     require professional foresters and arboriculturists [26,33] in which data on the number and
                     health of trees assess their quantity and monetary value (i.e., in terms of air purification,
                     carbon storage, and carbon sequestration [32]). Similarly, ready-made GI valuation tools
                     available online can be used by those with little to no ecological background or training,
                     offering low-budget alternatives for applications and assessments [34]. In particular, i-Tree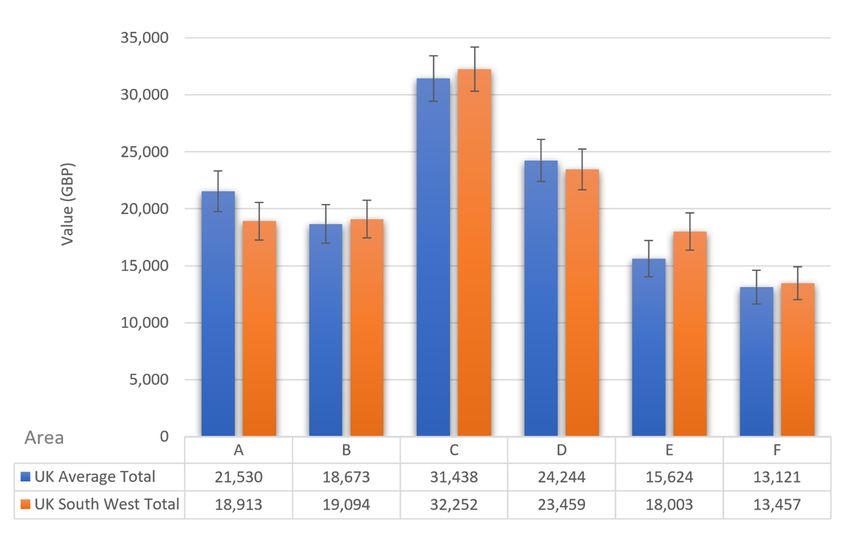
Land 2021, 10, 788                                                                                             3 of 17

                     Canopy (i.e., estimating tree canopy levels using aerial photography) as well as the UK’s
                     Office for National Statistics tool (i.e., framed by using postcodes)—both based on different
                     spatial parameters and methods—have been mostly used to assess GI benefits and the
                     UK natural account. Specifically, the Office for National Statistics tool was created in
                     response to the government’s commitment to incorporate natural capital accounting in the
                     UK Environmental Accounts by 2020 [35]. In addition, the UK Government has pledged to
                     boost tree planting rates across the country to 30,000 ha per year. Between 2020 and 2025,
                     they have allocated over GBP 500 million of the GBP 640 million Nature for Climate Fund
                     on trees and forests in England to assist this goal [36]. To meet these ambitious goals in
                     the coming years, evaluation tools and new guidance through the National Model Design
                     Code on how trees can be included in the built environment (including design parameters
                     for street tree placement) are required [36].
                           Moreover, such publicly-funded planting efforts rarely receive formal or even informal
                     benefit-cost analyses, implying that large amounts of resources (i.e., financial, labor, etc.)
                     are being deployed without a clear understanding of their returns, preventing comparisons
                     of the net benefits per penny spent on afforestation to other potential urban improvement
                     projects, such as early childhood education [17]. Thus, understanding the net benefits of
                     urban trees is essential for justifying public-funding planting efforts or just allocating money
                     to maintain existing urban trees on public land [37]. In this effort, this communication
                     examines tree cover and relating ecosystem service utility using the Bristol City Center as
                     an example by: (1) illustrating the main features of free user-friendly web applications (i.e.,
                     i-Tree Canopy and the Office for National Statistics tool), and (2) comparing i-Tree Canopy
                     Version 6.1 (i.e., using American quantified datasets), Version 7.1 (i.e., local UK quantified
                     datasets), and the Office for National Statistics website in the context of their use and as
                     tree planting strategy tools in Europe. The tools are centered on aiding policymakers to
                     best understand the benefits of maintaining trees and GI in terms of a balanced urban
                     ecosystem services output.

                     2. Materials and Methods
                     2.1. Study Area
                           Bristol is the largest city in South West England with an estimated population of
                     463,400 people [38]. In 2019, Bristol’s Council Cabinet approved a GBP 4 million, five-
                     year management contract for preserving the city’s trees, with the goal of doubling the
                     city’s tree canopy [39]. A commissioned report from the City Council showed that around
                     300 deaths each year (i.e., 8.5% of total deaths) in the City of Bristol had been attributed to
                     air pollution [40], making it crucial to control and reduce air pollution in certain areas. The
                     study area is comprised of six areas in Bristol City Centre according to the postcode BS1 (i.e.,
                     Bristol Central, see https://www.streetlist.co.uk/bs/bs1, accessed on 1 June 2021) with a
                     population of 11,991 inhabitants living between Broadmead and Wapping Wharf (Figure 1).
                     The choice was supported by: (1) preliminary desk research using ArcGIS Version 10.5.1
                     and the EDINA Digimap web-based mapping service that evaluated the physical BS1
                     zones, which took into account the location of air pollutant monitors, population density,
                     and NO2 concentrations and found that NO2 is above the UK legal limits within postcodes
                     BS1-2 and BS1-3 [41], and (2) according to council figures, it has planted approximately
                     6000 trees in each of the last four years. However, far too many of these are younger, smaller
                     trees that are not in the city center, where they are most needed, and will take decades to
                     reach maturity [42]. The six areas (i.e., letters A–F) represent the postcode sectors within
                     the BS1 district—each with an area of 1 km2 .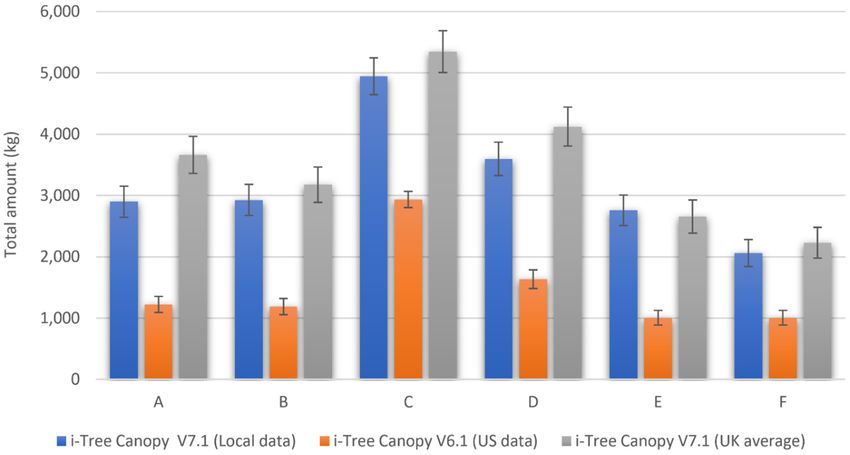
Land 2021, 10, 788
x FOR PEER REVIEW 4 of 18
17
Figure 1.
Figure The study
1. The study area
area made
made up
up of
of the
the six
six quadrants,
quadrants, i.e., A–F, included
i.e., A–F, included in
in the
the postcode
postcode BS1.
BS1. Source:
Source: Google
Google Earth.
Earth.
2.2. Office
2.2. Office for
for National
National Statistics
Statistics Web-based
Web-based Application
Application
Quantified pollution removed by vegetation (i.e.,
Quantified pollution removed by vegetation (i.e., per kg) and
per kg) and avoided
avoided health
health damage
damage
costs (i.e.,
costs (i.e., GBP
GBP perper person)
person) inin each
each area
area is
is calculated
calculated using
using the
the Office
Office for
for National
National Statistics
Statistics
website [43]—an online tool developed by the Centre for Ecology
website [43]—an online tool developed by the Centre for Ecology and Hydrology. and Hydrology. The tool
Theis
available online at: https://www.ons.gov.uk/economy/environmentalaccounts/articles/
tool is available online at: https://www.ons.gov.uk/economy/environmentalaccounts/arti-
ukairpollutionremovalhowmuchpollutiondoesvegetationremoveinyourarea/2018-07-30, ac-
cles/ukairpollutionremovalhowmuchpollutiondoesvegetationremoveinyourarea/2018-
cessed on 1 June 2021. This calculator also provides the avoidable health damage costs
07-30, accessed on 1 June 2021. This calculator also provides the avoidable health damage
per person within postcodes and compares it to the UK average. In 2020, to calculate
costs per person within postcodes and compares it to the UK average. In 2020, to calculate
pollution removed by vegetation as well as the avoided health damage costs for the se-
pollution removed by vegetation as well as the avoided health damage costs for the se-
lected areas, we have entered postcodes within the BS1 district into the Office for National
lected areas, we have entered postcodes within the BS1 district into the Office for National
Statistics tool (i.e., area A = BS1-1 and BS1-2, area B = BS1-2 and BS1-6, area C = BS1-6, area
Statistics tool (i.e., area A = BS1-1 and BS1-2, area B = BS1-2 and BS1-6, area C = BS1-6, area
D = BS1-6, area E = BS1-4 and BS1-6, and area F = 1-6). The Office for National Statistics
D = BS1-6, area E = BS1-4 and BS1-6, and area F =1-6). The Office for National Statistics
website’s methods are being developed to incorporate the values within the UK’s natural
website’s methods are being developed to incorporate the values within the UK’s natural
capital accounts [44]. Air pollution removal by urban green and blue infrastructure is
capital accounts [44]. Air pollution removal by urban green and blue infrastructure is cal-
calculated using the EMEP4UK model which is a dynamic atmospheric chemistry transport
culated using the
model [44,45]. EMEP4UK
Table model
1 illustrates which isremoved
pollutants a dynamic by atmospheric
urban green chemistry transport
and blue infrastruc-
model [44,45]. Table 1 illustrates pollutants removed by urban green and
ture (i.e., urban trees and woodland, urban grassland, and urban water) as dry pollutant blue infrastruc-
ture (i.e., urban
deposition trees
(i.e., in andofwoodland,
terms kilo tonnesurban grassland,
per year) and urban
throughout the UK water) as dry
in 2015. Thepollutant
negative
deposition (i.e., in terms of kilo tonnes per year) throughout the UK
values for several pollutants removed by urban water, which are legitimate outputs in 2015. The negative
of the
values
scenario forcomparison,
several pollutants removed
imply that by urban water,
dry deposition to water which
would arebe
legitimate
higher if outputs of the
there were no
scenario comparison,
woodland or grassland [44]. imply that dry deposition to water would be higher if there were no
woodland or grassland
The monetary [44]. economic and health calculations are based on damage cost
account’s
per unit of exposure, with the economic benefit calculated directly from mortality and
morbidity statistics for each local authority in the UK, as well as the receiving population’s
change in pollutant exposure [44]. Detailed methods are given in Jones et al. [46].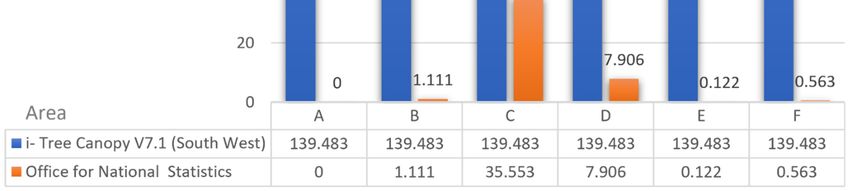
Land 2021, 10, 788                                                                                                5 of 17

                     Table 1. UK pollutants removed by GI as dry pollutant deposition (kilo tonnes per year), 2015 [46].

                                    Pollutant                           UGBI †                     Year 2015
                                                                Urban trees and woodland             1.23
                                      PM10                          Urban grassland                  1.45
                                                                      Urban water                   −0.004
                                                                Urban trees and woodland             0.70
                                      PM2.5                         Urban grassland                  0.31
                                                                      Urban water                   −0.003
                                                                Urban trees and woodland             0.59
                                       SO2                          Urban grassland                  1.00
                                                                      Urban water                   −0.049
                                                                Urban trees and woodland             0.44
                                       NH3                          Urban grassland                  0.95
                                                                      Urban water                   −0.045
                                                                Urban trees and woodland              0.41
                                       NO2                          Urban grassland                   1.61
                                                                      Urban water                    0.000
                                                                Urban trees and woodland             4.97
                                        O3                          Urban grassland                 16.94
                                                                      Urban water                   −0.003
                     †   urban green and blue infrastructure.

                     2.3. i-Tree Canopy
                            To calculate the tree cover and the monetary value for the selected areas in Bristol,
                     the free online tool i-Tree Canopy Version 6.1 in 2020 and Version 7.1 in 2021 was used. To
                     compare the data from the Office for National Statistics, the Pollution Removal GeoPackage
                     (i.e., found at: http://geoportal.statistics.gov.uk/search?q=Geopackage, accessed on 1 June
                     2021) was used to create six ESRI shapefiles in ArcGIS Version 10.5.1. The boundary of each
                     postcode area and the ESRI shapefiles were imported into the i-Tree Canopy tool. Each
                     boundary was 1 km2 . A total of 500 random points (i.e., with a standard error (SE) < 3%)
                     were photo interpreted for each area for a total of 3000 points. Within each area, the
                     percentage of each cover class (i.e., ‘p’) was calculated as the number of sample points (i.e.,
                     ‘x’) hitting the cover attribute divided by the total number of interpretable sample points
                     (i.e., ‘n’) within the area of analysis (i.e., p = x/n). The SE of the estimate is calculated using
                     Equation (1) [47,48].                            p
                                                                         p (1 − p )
                                                              SE =                                                    (1)
                                                                            n
                     where p = percentage of each cover class, n = total number of interpretable sample points.
                            For the photo interpretation, two photo interpreters with a background in landscape
                     architecture and urban forestry classified each point using three cover classes: two default
                     classes (i.e., tree and non-tree) and grass. i-Tree Canopy Version 6.1 calculates air pollutant
                     removal and monetary values using the default values (i.e., the multipliers) of air pollutant
                     removal rates (i.e., g/m2 /year) and monetary values (i.e., USD m−2 year−1 ) for a unit
                     tree cover derived from i-Tree Eco projects across the United States [49]. In this version
                     for international projects (i.e., outside the United States), the default values are derived
                     from the United States’ total removal amount and monetary values used from Ameri-
                     can urban areas [49]. The monetary values are in USD and the tool calculates currency
                     values from the online currency exchange tool at: https://www.openexchangerates.org,
                     accessed on 2 June 2021. On the other hand, i-Tree Canopy Version 7.1 estimates the
                     ecosystem service rates using i-Tree Eco batch runs as well as using local pollution and
                     weather data [50]. A description of the metadata used in the model is available in the
                     i-Tree Canopy metadata and data sources [50]. Furthermore, the monetary values for
                     ecosystem services in the UK are provided by Treeconomics, which are available online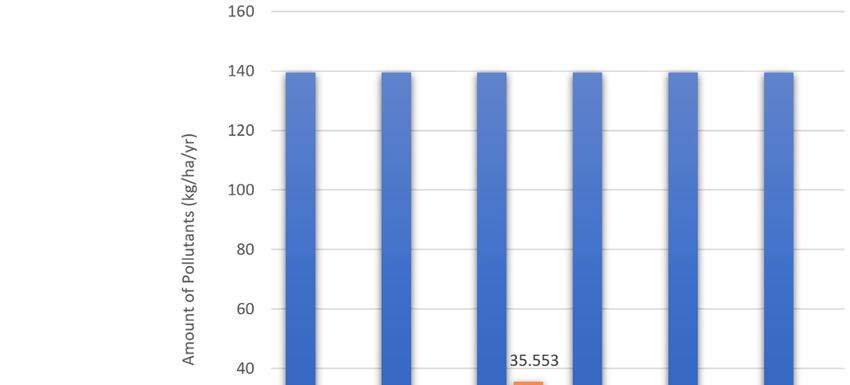
Land 2021, 10, 788                                                                                                              6 of 17

                     at: https://www.itreetools.org/documents/734/UK_Benefit_Prices_from_Danielle_Hill_
                     Treeconomics_-_Benefits_Prices_by_County_Final_1.xlsx, accessed on 10 June 2021. In this
                     study, both versions were run. Specific to Version 7.1, the tool used the UK’s average data
                     as well local data in urban areas, i.e., the South West data (Table 2).

                     Table 2. Multipliers derived from i-Tree Eco projects in the UK and using South West data [50].

                                           Removal Rate         Monetary Value           Removal Rate           Monetary Value
                         Pollutant
                                           (g/m2 /Year) *       (GBP/t/Year) *           (g/m2 /Year) **        (GBP/t/Year) **
                            CO                  0.148                956.63                   0.072                  956.63
                           NO2                  3.065                187.91                   2.037                  114.41
                             O3                10.304                928.15                    9.06                  770.40
                           PM10                 2.08                33,713.00                 2.033                 33,713.00
                           PM2.5                0.521               30,654.87                 0.567                 26,838.42
                            SO2                 0.405                 64.93                   0.251                   41.56
                     * UK average data; ** South West data; Metric units: g = grams, m = meters, t = metric tons.

                     2.4. Comparison of the Office for National Statistics and i-Tree Canopy Tools
                           In terms of indicators, the i-Tree Canopy toolset contains six common air pollu-
                     tants (i.e., carbon monoxide (CO), nitrogen dioxide (NO2 ), ozone (O3 ), particulate matter
                     less than 2.5 microns (PM2.5 ), particulate matter greater than 2.5 microns and less than
                     10 microns (PM10 ), and sulfur dioxide (SO2 ) [49]) while the Office for National Statistics
                     also contains six common air pollutants (i.e., ammonia (NH3 ), NO2 , O3 , PM2.5 , PM10 ,
                     and SO2 ). In order to compare the two tools, we have not included CO from i-Tree and
                     NH3 from the Office for National Statistics. Furthermore, to compare the total pollutant
                     removal amounts between i-Tree Canopy Version 7.1 with local data and the Office for
                     National Statistics’ findings, the Office for National Statistics values were converted from
                     kg/km2 to kg/ha.

                     3. Results and Discussion
                     3.1. Tree Cover Results Using i-Tree Canopy
                           The percentage of tree cover in the six areas are given in Figure 2. Area E and F
                     have the lowest coverage of 12.2 ± 1.46%, while the range of tree cover in the six study
                     areas is between 12.2 ± 1.46% and 35.6 ± 2.14%. The lowest value is higher than in a
                     previous study using i-Tree Canopy in Bristol, which found a value of 10% tree cover in
                     the city center in 2018 [51]. This difference is due to the fact that the Bristol Tree Canopy
                     Cover Survey in 2018 [51] assessed each area according to city council wards, e.g., Bristol
                     Central was calculated using the total area of 223.14 ha with a tree canopy of 10.0 ± 1.62%
                     using i-Tree Canopy and a tree canopy of 6.5% using i-Tree Eco. Furthermore, the UK tree
                     cover, in general, was found to be lower than in other European and American cities [52].
                     Doick et al. [53] suggest that UK towns and cities strive to achieve a 20% tree canopy cover
                     as a minimum standard while towns and cities with at least 20% cover should increase
                     their tree cover by at least 5% within the next 10 to 20 years [53]. Unless supplemented by
                     more comprehensive criteria, the canopy cover targets cannot give a true representation of
                     the structure, health, and function of GI [54].
                           Studies have suggested that increasing tree canopy may provide more support for
                     mental health [55]. Recently, Marselle et al. [56] found that people with a poor socioe-
                     conomic level who lived in an area with a high density of street trees within 100 m of
                     their home had a lower chance of being given antidepressants. In a study conducted by
                     Kondo et al. [57], it was found that a five-percentage-point increase in tree canopy might
                     result in a 302-death decrease every year, worth USD 29 billion in Philadelphia. Moreover,
                     a 10% increase in canopy over the city was linked to a USD 36 billion reduction in mor-
                     tality. If Philadelphia achieves its objective of raising tree canopy cover to 30% by 2025,
                     403 premature adult deaths (i.e., 3% of total mortality) might be avoided annually [57]. On
                     the contrary, UK city councils have raised concerns about the possible impact of increased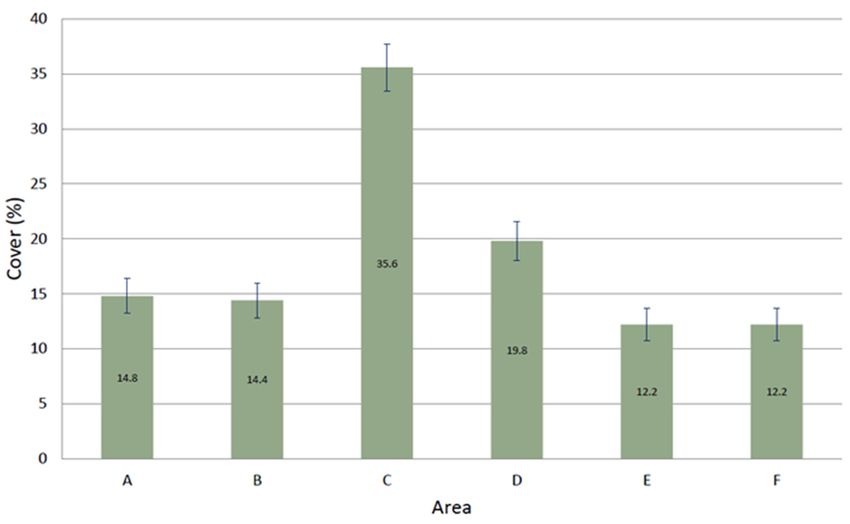
Land 2021, 10, 788                                                                                                              7 of 17

                                        tree cover in urban parks on crime and personal safety, as well as the fact that leaf fall from
                                        deciduous trees can obstruct urban run-off drains [58]. Furthermore, while increasing tree
                                        cover is associated with better pollution reduction, local-scale trees and forest design, it
                                        can also influence local-scale pollution concentrations [59]. In Baltimore, Troy et al. [60]
d 2021, 10, x FOR PEER REVIEW           found that a 10% increase in tree canopy was linked to a 12% reduction in crime. These                     7o
                                        conflicting findings between the American and British indicate a clear policy difference at
                                        the local level with different scientific viewpoints used to support their case.

                            Figure
                     Figure 2.        Tree cover
                               Tree2.cover       in the
                                            in the  six six studyareas
                                                         study    areas shown
                                                                        shown ininpercentage
                                                                                   percentage(error bars represent
                                                                                                 (error            SE).
                                                                                                          bars represent SE).

                                        3.2. Air Pollution Removal, Monetary Value, and Tool Evaluation
                                        Studies have suggested that increasing tree canopy may provide more support
                                              The range of pollutants removed is between 1006.8 ± 120.79 to 2935.18 ± 129.58 kg
                                  mental     health [55]. Recently, Marselle et al. [56] found that people with a poor socioe
                                         using i-Tree Canopy Version 6.1 (i.e., calculated using the US average), while i-Tree
                                  nomic     level who
                                         Canopy    Version lived   in anusing
                                                              7.1 (i.e.,   areathewith
                                                                                    UKaaverage
                                                                                           high density       of streeta trees
                                                                                                  data) calculated               within
                                                                                                                          reduction         100 m of th
                                                                                                                                        between
                                  home2231.72
                                           had a±lower
                                                     249.68chance      of being
                                                              and 5347.27          given
                                                                            ± 341.57       antidepressants.
                                                                                       kg. More  specifically, at In
                                                                                                                   thealocal
                                                                                                                         study    conducted
                                                                                                                              level, the results by Kon
                                  et al. yielded
                                          [57], itawas
                                                    range    between
                                                           found    that 2063.22  ± 221.29 and 4944.86 ±
                                                                           a five-percentage-point             298.57 kg
                                                                                                            increase    in(Figure    3). Areamight
                                                                                                                            tree canopy        C     res
                                         recorded the highest removal of pollutants, which is nearly threefold compared to the
                                  in a 302-death decrease every year, worth USD 29 billion in Philadelphia. Moreover, a 1
                                         lowest in area E and F. The difference between the US and the UK average data is more
                                  increase
                                         thanin  canopy over the city was linked to a USD 36 billion reduction in mortality
                                              double.
                                  PhiladelphiaUsingachieves       its objective
                                                       i-Tree Canopy               of raising
                                                                          Version 7.1  with the tree  canopy
                                                                                                 UK data,         cover
                                                                                                             the data     to 30% by 2025,
                                                                                                                        overestimated     the re-403 pre
                                         duction  of  pollutants   in area  A and  underestimated    it in  area E
                                  ature adult deaths (i.e., 3% of total mortality) might be avoided annually [57]. by  a total of 103   kg when
                                                                                                                                              On the co
                                         compared    to  the local South   West  data. Figure 4 shows    a comparison
                                  trary, UK city councils have raised concerns about the possible impact of increased t  of the total  pollutant
                                         removal amount between i-Tree Canopy Version 7.1 with the local data and the Office for
                                  coverNational
                                           in urban     parks on crime and personal safety, as well as the fact that leaf fall fro
                                                   Statistics’ findings.
                                  deciduous trees can obstruct urban run-off drains [58]. Furthermore, while increasing t
                                  cover is associated with better pollution reduction, local-scale trees and forest design
                                  can also influence local-scale pollution concentrations [59]. In Baltimore, Troy et al. [
                                  found that a 10% increase in tree canopy was linked to a 12% reduction in crime. Th
                                  conflicting findings between the American and British indicate a clear policy difference
                                  the local level with different scientific viewpoints used to support their case.

                                  3.2. Air Pollution Removal, Monetary Value, and Tool Evaluation
                                        The range of pollutants removed is between 1006.8 ± 120.79 to 2935.18 ± 129.58
Land 2021, 10,
Land 2021, 10, 788
x FOR PEER REVIEW 88 of
of 18
17
Land 2021, 10, x FOR PEER REVIEW 8 of 18
Figure 3. Total amount of air pollutants (i.e., NO22,, O O3,3,PMPM2.52.5 , PM
, PM , and
, and
1010 SOSO ) removed
2) 2removed byby trees
trees inin a year
a year estimated
estimated using
using i-
Tree Figure
i-TreeCanopy
Canopy 3.Version
Total amount
Version6.1
6.1andofi-Tree
and air pollutants
i-Tree Canopy
Canopy (i.e., NO2, O
Version
Version 7.1
7.13, PM 2.5, local
with
with PM 10,and
local and UK
and SO
UK2)average
removeddata
average by trees
data in bars
(error
(error abars
yearrepresent
estimatedSE,
represent using i-
calculated
calculated
from Treeof
SEs Canopy
sampledVersion
and 6.1 and i-Tree
classified Canopy Version 7.1 with local and UK average data (error bars represent SE, calculated
points).
from SEs of sampled and classified points).
from SEs of sampled and classified points).
FigureFigure 4. Comparison
4. Comparison of the
of the estimatesof
estimates of air
air pollutants
pollutants(i.e., NO
(i.e., 2, O3, PM2.5, PM10, and SO2) removed per ha by trees using
NO 2 , O3 , PM2.5 , PM10 , and SO2 ) removed per ha by trees
i-Tree Canopy Version 7.1 (local Data) and the urban green and blue infrastructure using the Office for National Statistics.
using Metric
i-Tree units:
Canopy Version 7.1 (local Data) and the urban green and blue infrastructure using the Office for National
kg = kilograms, ha = hectares; Office for National Statistics values were converted from kg/km2 to kg/ha; i-
Figure 4. Comparison
Statistics. ofkgthe estimates ofhaair pollutants (i.e., NO 2, O3, PM2.5, PM10, and SO2) removed per ha by trees using 2 to
Tree Canopy Version 7.1 values are based on the removal multipliers (i.e.,Statistics
Metric units: = kilograms, = hectares; Office for National values
NO2 = 20.375, O3 =were converted
90.596, fromPM
PM2.5 = 5.670, kg/km
10 =
i-Tree Canopy
kg/ha;20.329,
i-TreeandVersion 7.1
SO2 = Version
Canopy (local
2.513) in 7.1 Data) and
kg/ha/year from
values are the urban
Southon
based green
West
the data.and blue infrastructure using the Office for National Statistics.
removal multipliers (i.e., NO2 = 20.375, O3 = 90.596, PM2.5 = 5.670,
Metric units: kg = kilograms, ha = hectares; Office for National Statistics values were converted from kg/km2 to kg/ha; i-
PM = 20.329, and SO2 = 2.513) in kg/ha/year from South West data.
Tree10Canopy Version 7.1 values are based on the removal multipliers (i.e., NO2 = 20.375, O3 = 90.596, PM2.5 = 5.670, PM10 =
20.329, and SO2 = 2.513) in kg/ha/year from South West data.Land 2021, 10, 788 9 of 17
There is a very strong contrast between the results using either tool. Throughout the en-
tire study area, the i-Tree Canopy results recorded a constant value of 139.483 kg/ha/year,
while the Office for National Statistics did not record any pollutant removal for area A
and near zero for areas B, E, and F. In area C, however, it recorded its highest pollutant
removal amount at 35.553 kg/ha/year. Figure 5 shows the amount of each pollutant
removed annually using i-Tree Canopy Version 7.1 with local data. Among the five pollu-
tants, O3 had the highest removal amount and NO2 ranged between 301.38 ± 32.34 and
722.32 ± 43.61 kg. In contrast, the Office for National Statics did not estimate any NO2
removal in Areas A and E (Appendix A, Table A1). The Office for National Statistics’ NO2
estimates are significantly lower than those of i-Tree Canopy (i.e., from either version of the
software). This outcome can be reasonably interpreted from the EMEP4UK model since,
while trees remove NO2 from the atmosphere, natural NO emissions from the soil under
trees also exist, and these values balance out to a substantial extent [44]. Our findings
are consistent with those of Jones et al. [44] who found that pollutant quantities assessed
using the EMEP4UK model are roughly half those found in i-Tree studies. Furthermore,
because the Office for National Statistics tool is based on a dynamic model, inhabitants of
one area may benefit from pollutants absorbed in neighboring areas due to the nature of
the model [43,44]. Additional pilot modeling, outside the purview of this study, can inform
possible locations and vegetation parameters to maximize its impact for the least polluted
conditions [8]. In the comparison of these results, consideration must be given to the fact
that both tools do not consider pollution removal by building integrated vegetation (e.g.,
green roofs and green walls). In this regard, previous studies have shown that green roofs
and green walls are effective to reduce pollution in streets [8]. Green walls, for instance,
have been shown to reduce NO2 levels at the street level by up to 40% and PM10 levels by
60%, according to researchers at Lancaster University [61]. It is also acknowledged that the
impacts of vegetation on air quality at local scales (e.g., at the street level) are dependent
on species composition and can be beneficial or negative. However, both tools were unable
to model this level of detail [43,62].
The average monetary value of the Office for National Statistics is GBP 16.19 per
person (i.e., the amount saved in healthcare costs) [44]. This result is higher than the UK
average of GBP 15.39 per person. The i-Tree Canopy local data recorded a range between
GBP 13,457 ± 1444 and GBP 32,252 ± 1948. Figure 6 shows the monetary value using i-Tree
Canopy Version 7.1 with the UK average data and local data. There is a difference of GBP
2617 in area A while in area F it is only GBP 336 due to a lower tree canopy. The monetary
values calculated using i-Tree Canopy Version 6.1 (i.e., using US average data) ranged
from GBP 5486.59 ± 658.25 in area E and GBP 16,009.96 ± 962.99 in area C. However,
these figures were estimated using the United States Environmental Protection Agency’s
BenMAP, which assesses the incidence of adverse health impacts and related monetary
values caused by changes in NO2 , O3 , PM2.5 , and SO2 concentrations [49]. Therefore,
urban values were approximated using the national median externality values from the
United States [49]. Contrarywise, i-Tree Canopy Version 7.1 as well as i-Tree Eco have been
implemented using appropriate official values from the UK [63].
For the monetary values provided by GI, the two tools (i.e., i-Tree Canopy and the
Office for National Statistics) offer a distinct benefit—differing valuation approaches [46].
The researchers from the Centre for Ecology and Hydrology calculate the health benefit
from a change in air pollutant concentrations, whereas the i-Tree tools calculate damage
costs per tonne of pollutant emitted [46]. The monetary value from the Office for National
Statistics considers the costs of avoided health damage to people—i.e., the greater the
number of people who benefit from pollution removal, the higher the value [43]. As a
result, population density plays a significant role in final valuation. Moreover, the Office
for National Statistics calculates avoided damage costs caused by NH3 and PM10 within the
parameters of PM2.5 , as this includes the aerosol fraction derived from NH3 and PM2.5 as
the riskiest (albeit bottom end) component of PM10 [43]. As such, these assumptions make
it difficult to compare the two tools. The comparison between the UK and the United Statesitants of one area may benefit from pollutants absorbed in neighboring areas due to the
nature of the model [43,44]. Additional pilot modeling, outside the purview of this study,
can inform possible locations and vegetation parameters to maximize its impact for the
least polluted conditions [8]. In the comparison of these results, consideration must be
given to the fact that both tools do not consider pollution removal by building integrated
Land 2021, 10, 788 10 of 17
vegetation (e.g., green roofs and green walls). In this regard, previous studies have shown
that green roofs and green walls are effective to reduce pollution in streets [8]. Green
walls, for instance, have been shown to reduce NO2 levels at the street level by up to 40%
and PM10 levels by 60%, according to researchers at Lancaster University [61]. It is also
toolsets is further complicated by differences in the pollution levels of specific chemicals.
acknowledged that the impacts of vegetation on air quality at local scales (e.g., at the street
This includeslevel)
the degree of segregation between emission zones, forests, and receptor
are dependent on species composition and can be beneficial or negative. However,
regions [46]. both tools were unable to model this level of detail [43,62].
Land 2021, 10, x FOR PEER REVIEW 10 of 18
The average monetary value of the Office for National Statistics is GBP 16.19 per per-
son (i.e., the amount saved in healthcare costs) [44]. This result is higher than the UK av-
erage of GBP 15.39 per person. The i-Tree Canopy local data recorded a range between
GBP 13,457 ± 1444 and GBP 32,252 ± 1948. Figure 6 shows the monetary value using i-Tree
Canopy Version 7.1 with the UK average data and local data. There is a difference of GBP
2617 in area A while in area F it is only GBP 336 due to a lower tree canopy. The monetary
values calculated using i-Tree Canopy Version 6.1 (i.e., using US average data) ranged
from GBP 5486.59 ± 658.25 in area E and GBP 16,009.96 ± 962.99 in area C. However, these
figures were estimated using the United States Environmental Protection Agency’s
BenMAP, which assesses the incidence of adverse health impacts and related monetary
values caused by changes in NO2, O3, PM2.5, and SO2 concentrations [49]. Therefore, urban
values were approximated using the national median externality values from the United
Figure 5. Amount States [49].airContrarywise,
of Amount
each pollutant i-Treeannually
removed Canopyusing
Version 7.1 Canopy
i-Tree as well Version
as i-Tree7.1
Eco have
with been
local im-
data
Figure 5.
plemented
of each air pollutant
using appropriate
removedfrom
annually using i-Tree Canopy Version 7.1(South West)
with local
(error bars represent SE, calculated from SEs of official
sampledvalues thepoints).
and classified UK [63].
data (South West) (error bars represent SE, calculated from SEs of sampled and classified points).
Monetary
Figure 6. Figure values values
6. Monetary calculated using
calculated i-Tree
using Canopy
i-Tree CanopyVersion
Version7.1
7.1with theUK
with the UKaverage
average andand local
local data.data. Notes:
Notes: currency is
currency
in GBP andis in GBP and UK
rounded; rounded; UK air pollution
air pollution estimates
estimates are based
are based on these
on these values
values in GBP/kg/year and
in GBP/kg/year androunded:
rounded:NO 2 = GBP
NO 2 GBP 0.19,
=
0.19, O3 = BGP 0.93, SO2 = GBP 0.06, PM2.5 = GBP 30.65, PM10 = GBP 33.71; local data air pollution estimates are based on
O3 = BGP 0.93, SO2 = GBP 0.06, PM2.5 = GBP 30.65, PM10 = GBP 33.71; local data air pollution estimates are based
these values in GBP/kg/year and rounded: NO2 = GBP 0.11, O3 = GBP 0.77, SO2 = GBP 0.04, PM2.5 = GBP 26.84, PM10 = GBP
on these values
33.71. in GBP/kg/year and rounded: NO2 = GBP 0.11, O3 = GBP 0.77, SO2 = GBP 0.04, PM2.5 = GBP 26.84,
PM10 = GBP 33.71.
For the monetary values provided by GI, the two tools (i.e., i-Tree Canopy and the
Office for National Statistics) offer a distinct benefit—differing valuation approaches [46].
The researchers from the Centre for Ecology and Hydrology calculate the health benefit
from a change in air pollutant concentrations, whereas the i-Tree tools calculate damage
costs per tonne of pollutant emitted [46]. The monetary value from the Office for National
Statistics considers the costs of avoided health damage to people—i.e., the greater theLand 2021, 10, 788 11 of 17
One key difference between the two tools is the i-Tree Canopy software allows re-
searchers to define the project area at the beginning of the survey, while the Office for
National Statistics just allows researchers to enter the postcode to look for the study area
and they provide the kilograms of the pollutant removed per km2 . The precision of the
result from i-Tree Canopy is based on researchers properly classifying each point into the
correct cover type [62]. When the number of points augments, the accuracy of the survey
increases. On the other hand, if insufficient points are input into the survey, SE increases.
As stated in Section 2.3, 500 points were input into each area, i.e., within the suggested
bounds of a proper i-Tree Canopy survey [62]. It is safe to suggest that some of the Google
imagery provided when piecing together the survey may be of poor image resolution and
may affect the decision of researchers during the input stage of the work [62].
3.3. Planting Strategies
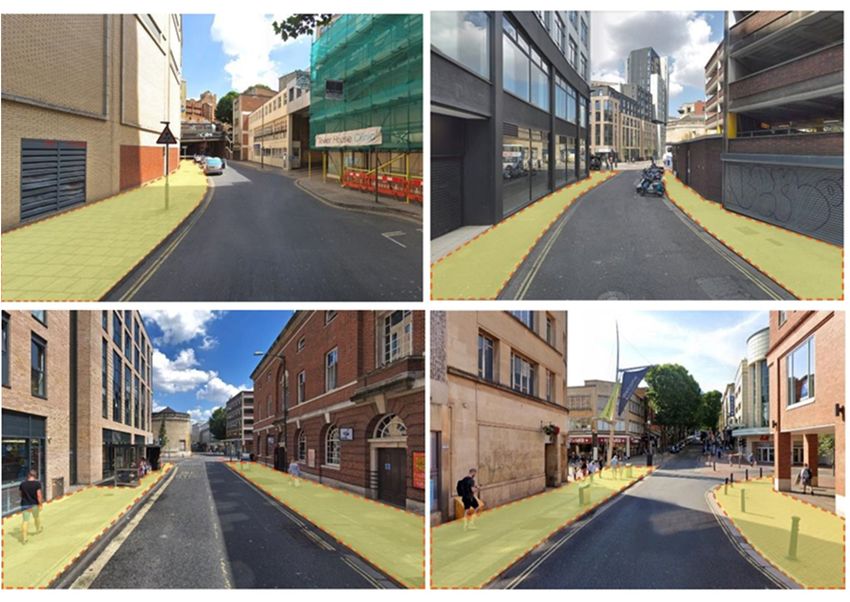
In our study, we were only able to identify potential areas for future tree plant-
ing by combining the i-Tree Canopy and the Office for National Statistics results, using
Google Maps as well as an online tree inventory (i.e., found at: https://bristoltrees.space/
Locate/?latitude=51.47709&longitude=-2.58780, accessed on 3 June 2021). For example,
to aid with the Office for National Statistics calculation for the postcode BS1-2 (i.e., area
A where it recorded zero pollutant removal), city managers could think to increase the
tree canopy as illustrated in Figure 7. However, both tools do not provide any information
about soil and root space as they are not mainly designed for tree planting strategies.
While the i-Tree Canopy’s planar cover is valuable, it leaves the very essential vertical
dimension unbound, and neither stem count nor tree-crown cover locates GI in the urban
canyon three-dimensionally [10]. Several modeling studies reported that dense high-level
canopy vegetation can lead to increased pollution concentrations inside street canyons
by reducing turbulence, mi xing fresh air with polluted air, and trapping pollution at
Land 2021, 10, x FOR PEER REVIEW 12 of 18
ground level [64–67]. As a result, it is important to consider tree interaction with local
meteorological conditions and building arrangements in street canyons [65].
Figure7.7.Possible
Figure Possibleareas
areas for
for future
future tree
tree planting: (top left) FairfaxStreet,
left) Fairfax Street,(top
(topright) AllSaints’
right)All Saints’Street,
Street,
(bottomleft)
(bottom left)Nelson
NelsonStreet,
Street,and
and(bottom
(bottom right)
right) Union
Union Street. Source: Google
Google Maps.
Maps.
The suitability of each plant for each location, including tolerance of relevant stress
and projected growth form, must be carefully considered when implementing robust and
effective GI [67]. Lack of growth space, poor soil quality, light heterogeneity, pollutants,
diseases, and conflicts with human activities, constructions, and pavements are all key
issues for vegetation and green spaces in compact cities like Bristol City Centre [70]. IfLand 2021, 10, 788 12 of 17
It should also be noted that both tools do not provide information about species.
However, species selection tools are available via i-Tree Species software which was created
to assist urban foresters in choosing the best tree species for their needs (e.g., species’
potential environmental services and geographic location). Using this additional toolset,
users rank the importance of each desired environmental function provided by trees and
the tool estimates the appropriateness of the tree species based on weighted environmental
advantages of tree species at maturity [50]. In addition, a tree selection guide is available
online which provides nearly 300 potential species for GI [68]. Both tools do not design or
integrate tree planting applications; however, the i-Tree suite contains i-Tree Design and
i-Tree Planting, but these only function in North America. In particular, i-Tree Planting
is an online tool that calculates the long-term environmental benefits of a tree-planting
project with a variety of trees and species. Its methods are based on the i-Tree Design and
i-Tree Forecast tools [30]. Future research could develop a similar tool for Europe or a
geographic information system (GIS)-like tool similar to the one developed by Wu et al. [69]
that identifies suitable tree-planting locations by simulating the planting of large, medium,
and small trees on plantable areas, with large trees taking precedence because they are
projected to provide considerable benefits.
The suitability of each plant for each location, including tolerance of relevant stress
and projected growth form, must be carefully considered when implementing robust and
effective GI [67]. Lack of growth space, poor soil quality, light heterogeneity, pollutants,
diseases, and conflicts with human activities, constructions, and pavements are all key
issues for vegetation and green spaces in compact cities like Bristol City Centre [70]. If trees
are well-managed and the correct trees are planted in the right areas, the ecosystem services
they provide can greatly exceed the disservices, contributing to a city’s or town’s long-term
sustainability and livability [71]. Tree initiatives should include recommendations on how
to make public trees more resilient (e.g., promoting a broader species choice for public
areas and ways to achieve greater size diversification) [71]. Recognizing that the potential
for improving air quality through urban vegetation is limited, one important limitation to
mitigating current air quality problems through vegetation is that the most polluted areas
of cities have very limited space for planting, greatly limiting the potential for mitigation
using these methods [72]. The benefits of an integrated policy that geographically isolates
people from major pollution sources as much as possible (i.e., particularly transportation)
and uses vegetation between the sources and the urban population are maximized [72].
4. Conclusions and Recommendations
Many developed nations are beginning to reduce pollution emissions and deposition
through successful environmental policies [73–75]. At the same time, cities are imple-
menting strategies to tackle air pollution; e.g., large scale urban afforestation projects
are becoming more popular as a strategy to improve urban sustainability and human
health [76]. In order to design and plan sustainable cities, landscape architects and urban
planners need accurate metrics and indicators. In this communication, we have illustrated
two free user-friendly online tools (i.e., the Office for National Statistics and i-Tree Canopy)
using Bristol City Centre as an example. We found both tools are easy to use and communi-
cate ecosystem services and monetary values. However, they produce different results due
to the different methods that the tools incorporate. Our findings are in accordance with
the conclusions of Timilsina et al. [77], who reported that the disparity in predictions by
general models or average data have an impact on the estimation of ecosystem services.
We also discussed the use of these tools for future tree planting strategies. According to
Keith Sacre, co-founder of Treeconomics, the tree planting process should be strategized
into several elements: “(1) creating a vision: what is wanted? (based on ‘What is there
now?’); (2) setting targets which are achievable and deliverable; (3) creating an action plan,
comprising: where to plant, what to plant, how to plant, and what is needed to maintain?;
and (4) monitoring and reviewing progress” [78]. This approach would potentially allow
for “realistic and achievable targets to be set [and] suitable species to be selected” [78].Land 2021, 10, 788 13 of 17
In terms of a key strength of the i-Tree Canopy tool, it allows users to simply photo-
interpret Google aerial images to obtain statistically valid estimates of tree and other
cover types, as well as evaluations of their uncertainty [30]. Random point sampling
approaches such as i-Tree Canopy have the benefit of openly available data and software
that may be used by a wide range of people [79]. Users of any random point sampling
method, on the other hand, should be cognizant of the uncertainties involved with any
urban tree cover estimate, especially if it is being used to track change [79]. i-Tree Canopy,
as such, calculates several ecosystem services, e.g., avoided runoff, carbon storage and
sequestration, and air pollutants removal; however, European users should be aware that i-
Tree Canopy benefits (i.e., ecosystem services and monetary values) from selected locations
are available only in Sweden and the UK. Using the i-Tree suite software, one can identify
landscape features to predict other phenomena as well, e.g., wood tick presence [80]. Future
research could explore the use of i-Tree Canopy to map edible green infrastructure as well
as urban food provisioning ecosystem services [81]. The Office for National Statistics
tool, on the other hand, provides meaningful urban metrics that highlight the linkages
between GI and health which can improve health impacts through urban policies [82].
The Office for National Statistics website formulates its research from inputting postcodes
and working from the preset-2015 dataset. The use of postcodes is a standard that many
epidemiological studies utilize when pinpointing or narrowing in on specific phenomena
(e.g., pollutants) [83–85]. This, in turn, parallels the tool’s parameter structure and offers the
prospect of measuring other performance or production elements via overlaid GIS. As an
extension, we recommend the use of locals models for ecosystem services assessments [77].
Therefore, the Office for National Statistics uses landcover maps that are more appropriate
for analyzing ecosystem services at the regional scale rather than the local scale since
maps with limited resolution are unreliable for local studies unless additional data or
fine-adjustments are supplied [86,87].
At length, both tools are excellent online resources which are easy to use, require little
to no expert knowledge, and parallel a bottom-up concept, i.e., they are simplistic, fast,
and trackable. A key difference, however, is that the i-Tree Canopy software specifically
takes into account only tree (i.e., green) coverage while the Office for National Statistics
considers the total environment (e.g., water, vegetation, etc.). This methodological dif-
ference would explain much of the discrepancy in results since Bristol is situated on the
River Avon and water is considered a negative value in the Office for National Statistics
methodology. However, results must be validated by fieldwork so future research could
compare both tools using a stratified sample according to a rural-urban gradient [88–90].
Further case research would aid in better explaining if the toolsets could be integrated
somehow (e.g., GIS) and if GI strategy can reliably be sought after if vast differences are
present. Nonetheless, when factoring in an urban sustainable vision of designing green,
urban-friendly cities, an uncertainty analysis should become a formal practice and neces-
sary component of any modeling exercises, especially for models which aim to support
“model transparency, model development, effective communication of model output, [ . . . ]
decision-making” [91] and policy formation. To further improve or develop new tools,
researchers should also account for ecosystem disservices in order to assess the net benefits
of GI [92,93]. To conclude, the results of this communication have updated the literature
on the evaluation of GI tools in the UK [34] as well as provide a basis for the future devel-
opment of a comprehensive online design tool that is site-specific for GI strategy and for
the assessment of urban ecosystem services in Europe.
Author Contributions: Conceptualization, software, investigation, resources, data curation, writing—
original draft preparation, methodology, validation, formal analysis, A.R. and W.T.C.; writing—
review and editing, A.R. and G.T.C.; supervision, project administration, funding acquisition, A.R.
All authors have read and agreed to the published version of the manuscript.
Funding: This research received no external funding.
Institutional Review Board Statement: Not applicable.Land 2021, 10, 788 14 of 17
Informed Consent Statement: Not applicable.
Data Availability Statement: All datasets are available from the corresponding author on reason-
able request.
Acknowledgments: The authors would like to thank the i-Tree team for clarification about the i-Tree
model in the UK.
Conflicts of Interest: The authors declare no conflict of interest.
Appendix A
Table A1. Amount of each pollutant removed by trees using i-Tree Canopy Version 7.1 and Version 6.1 (kg), and the amount
of each pollutant removed by blue and green infrastructure (i.e., urban trees and woodland, urban grassland, and urban
water) using the Office for National Statistics (kg/km2 ).
Area A B C D E F
i- Tree Canopy Version 7.1 UK 685.52 594.52 1000.97 771.93 497.45 417.76
i-Tree Canopy Version 6.1 US 103.48 100.68 248.9 138.43 85.3 85.3
NO2
i-Tree Canopy Version 7.1 UK South West 423.56 427.64 722.32 525.38 403.2 301.38
Office for National Statistics 0 9.6 238.7 49.5 0 4.8
i- Tree Canopy Version 7.1 UK 2304.31 1998.43 3364.69 2594.77 1672.16 1404.28
i-Tree Canopy Version 6.1 US 799.32 777.72 1920 1070 658.9 658.9
O3
i-Tree Canopy Version 7.1 UK South West 1883.35 1901.46 3211.74 2336.08 1792.81 1340.08
Office for National Statistics 0 88 2685.8 526.5 −8.8 43.5
i- Tree Canopy Version 7.1 UK 116.54 101.07 170.17 131.23 84.57 71.02
i-Tree Canopy Version 6.1 US 40.83 39.73 98.22 54.63 33.66 33.66
PM2.5
i-Tree Canopy Version 7.1 UK South West 117.87 119 201 146.2 112.2 83.87
Office for National Statistics 0 0.5 125 34.6 −3.6 0.1
i- Tree Canopy Version 7.1 UK 465.23 403.48 679.32 523.88 337.6 283.52
i-Tree Canopy Version 6.1 US 226.86 220.73 545.7 303.51 187.01 187.01
PM10
i-Tree Canopy Version 7.1 UK South West 422.61 426.68 720.69 524.2 402.3 300.71
Office for National Statistics 0 0.7 193.9 55.5 −4.3 0.1
i- Tree Canopy Version 7.1 UK 90.48 78.47 132.12 101.89 65.66 55.14
i-Tree Canopy Version 6.1 US 50.87 49.49 122.36 68.05 41.93 41.93
SO2
i-Tree Canopy Version 7.1 UK South West 52.25 52.75 89.11 64.81 49.74 37.18
Office for National Statistics 0 12.3 311.9 124.5 28.9 7.8
References
1. Ritchie, H.; Roser, M. Outdoor Air Pollution. Available online: https://ourworldindata.org/outdoor-air-pollution (accessed on
20 June 2021).
2. Yim, S.H.L.; Fung, J.C.H.; Lau, A.K.H.; Kot, S.C. Air ventilation impacts of the “wall effect” resulting from the alignment of
high-rise buildings. Atmos. Environ. 2009, 43, 4982–4994. [CrossRef]
3. Li, Z.; Zhou, Y.; Wan, B.; Chen, Q.; Huang, B.; Cui, Y.; Chung, H. The impact of urbanization on air stagnation: Shenzhen as case
study. Sci. Total Environ. 2019, 664, 347–362. [CrossRef]
4. Śmiełowska, M.; Marć, M.; Zabiegała, B. Indoor air quality in public utility environments—A review. Environ. Sci. Pollut. Res.
2017, 24, 11166–11176. [CrossRef]
5. Peters, A.; Dockery, D.W.; Muller, J.E.; Mittleman, M.A. Increased Particulate Air Pollution and the Triggering of Myocardial
Infarction. Circulation 2001, 103, 2810–2815. [CrossRef]
6. WHO World Health Assembly Closes, Passing Resolutions on Air Pollution and Epilepsy. Available online: https://apps.who.
int/mediacentre/news/releases/2015/wha-26-may-2015/en/index.html (accessed on 15 July 2021).
7. Royal College of Physicians. Every Breath We Take: The Lifelong Impact of Air Pollution; Royal College of Physicians: London,
UK, 2016.
8. Abhijith, K.V.; Kumar, P.; Gallagher, J.; McNabola, A.; Baldauf, R.; Pilla, F.; Broderick, B.; Di Sabatino, S.; Pulvirenti, B. Air
pollution abatement performances of green infrastructure in open road and built-up street canyon environments—A review.
Atmos. Environ. 2017, 162, 71–86. [CrossRef]
9. Kumar, P.; Druckman, A.; Gallagher, J.; Gatersleben, B.; Allison, S.; Eisenman, T.S.; Hoang, U.; Hama, S.; Tiwari, A.;
Sharma, A.; et al. The nexus between air pollution, green infrastructure and human health. Environ. Int. 2019, 133, 105181.
[CrossRef]You can also read