Characterization of Firmness Index for Mango Fruit by Laser Reflectometry around the Critical Angle
←
→
Page content transcription
If your browser does not render page correctly, please read the page content below
Proceedings of the XIth International Congress and Exposition
                                                                                    June 2-5, 2008 Orlando, Florida USA
                                                                        ©2008 Society for Experimental Mechanics Inc.

Characterization of Firmness Index for Mango Fruit by Laser Reflectometry
                         around the Critical Angle

                          M. Peña-Gomar*, G. Arroyo-Correa and J. I. Aranda.
 Facultad de Ciencias Físico-Matemáticas de la Universidad Michoacana de San Nicolás de
Hidalgo, Ciudad Universitaria, 58030, Morelia Michoacán, México. *mgomar@fismat.umich.mx

ABSTRACT

In this work we study the different phases of ripening of the mango fruit through the technique of Laser
Reflectometry around the Critical Angle (LRCA). The LRCA consists of measuring the reflectance and its angular
derivative with high resolution of a laser beam in internal reflection configuration, through a scanning incident
angle around the critical angle. The theoretical model is based on the analysis detailed of reflectivity of a
Gaussian beam near the critical angle and its dependence with the complex refractive index. Experimental
results of the Reflectance curves and its angular derivative for different mango pulp samples are shown. A
comparison with the firmness index of the fruit by the acoustic impact technique is done. The aim of this work is
to propose the RLAC technique as an alternative tool to acoustic methods in fruits quality characterization
problems.

INTRODUCTION

The standards of the quality control in food to global levels have prompted the proposals of new techniques for
food evaluation [1]. A great number of these new techniques are complexes and their implementation turns out to
be difficult for the agricultural industry of our country. Nevertheless, techniques exist that are a lot more easy to
implement and that permit to determine the quality of an agricultural product. Recently, the so called acoustic
impact technique (AIT) has been applied to characterize the firmness index of a wide range of fruits [1-3]. The
firmness index is an important parameter to determine the degree of quality of fruits. The experimental results
show that this factor goes decreasing comply the fruit goes maturing. Though AIT offers good possibilities as a
quantitative tool, is necessary to include other techniques that would complement it. In this work we propose the
use of LCRA as an optical technique to study the change of the refraction index of mango fruit samples during
different ripening stages. The values measured by LCRA are compared to those ones measured by AIT.

LASER REFLECTOMETRY NEAR THE CRITICAL ANGLE

LRCA is a technique based on the angle scanning reflectometry (ASR) for measuring the real and imaginary parts
of the complex refraction index of transparent, absorbing, and turbid liquids, as well as for sensing small variations
of the refractive index with high resolution [4]. The technique consists of harmonically modulating the angle of
incidence (θi) of a laser beam and measuring the amplitude of the ac-signal at photodetector. The mean angle of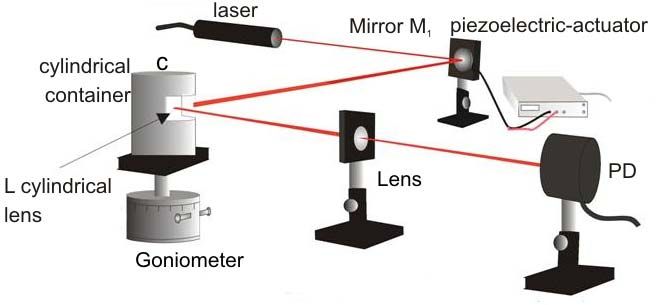
incidence can be scanned about the critical angle by mechanical rotation of the laser of the critical lens used as
the internal medium of the internal reflection with the sample. The LRCA analysis is based on a plane wave
formulation of the internal reflection between two transparent media; there is a discontinuity on the angular
derivative of the reflectivity at critical angle (there is a jump from ∞ to 0). In practice, however, one is limited to use
a well collimated beam (plane wave are not physically realizable) and of course, no real discontinuity exists. The
detailed analysis of the reflection of a Gaussian beam near the critical angle, when the external medium is
transparent is given in Ref. [5]. The case when the external medium has a complex refraction index (absorbing
and turbid as the case of this work), is discussed in the Ref. [6]. A brief description is given next.

The reflectance of a plane wave for either polarization (given by the squared modulus of the Fresnel reflection
coefficient) has a discontinuity in the first and higher-order angular derivatives at the critical angle θc. In practice
one can not use a plane wave; instead, a well collimated optical-beam has to be used. The reflectance for the first
and higher collimated Gaussian beam is given by [5]
                                                         ∞
                                                ω0 ki                        ω02 ki2
                                     R(θi ) =            ∫    f (θ ) exp[−             (θ − θi ) 2 ]dθ ,
                                                                  2
                                                                                                                                (1)
                                                 2π      −∞
                                                                               2

where ki is the wave number of light beam in the internal medium (glass in this case), ω0 is the waist radius of the
Gaussian beam, f is the Fresnel reflection coefficient for either polarization (TE and TM). Assuming a well
collimated Gaussian beam (ω0 ki>>1) and for incidence angles close to the critical angle, Eq. (1) can be simplified
to [6]

                                                                        DI (η )
                                                         R(θi ) = 1 +           ,                                               (2)
                                                                        2πω0 ki

were η =ω0 ki (θc- θi) and θc=sin-1(ε1/2/n1) is the critical angle, b=ω0 ki ε’’/h, D=4γ[4ε’/(ni2-ε’)]1/4, h =2[ε’(ni2-ε’)]1/2, and

                                                    ∞
                                                          1                       1
                                         I (η ) =   ∫
                                                    −∞
                                                          2
                                                            (u + u 2 + b 2 ) exp[− (u − η ) 2 ]du .
                                                                                  2
                                                                                                                                (3)

In Eq. (3), ni is the refraction index of the internal medium (glass), ε’ and ε’’ are the real and imaginary parts of the
dielectric constant of the external medium, γ=1 for TE polarization and γ= ni2/ε for TM polarization (or the average
for randomly polarized light).

From Eq. (2) one gets the first and higher derivatives. In particular, the first derivative is given by

                                                        dR D(ω0 ki )1/2
                                                             =          J (η ) ,                                                (4)
                                                        dθ i   2π
where

                                                    ∞
                                                          1                               1
                                         J (η ) =   ∫
                                                    −∞
                                                          2
                                                            (u + u 2 + b 2 )(u − η ) exp[− (u − η ) 2 ]du .
                                                                                          2
                                                                                                                                (5)

The parameter b, as defined above, relates to the imaginary component of the dielectric constant, and thus to the
optical absorption of the external medium. One usually works with the refractive index of external medium and
with the absorption coefficient α=2ωnI/c.

In Fig. 1 we plot the curve J(η ) for different values of b. Note η is the difference angle θc- θi times a large
dimensionless number, ω0 ki. One may calculate the angular derivative of reflectance for a laser beam near the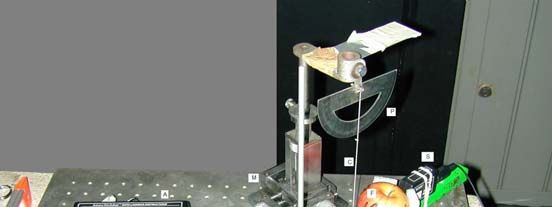
critical angle. In the figure we can observe the angular derivative changes with increasing optical absorption of the
external medium.

                                1.4
                                1.2
                                1.0
                                0.8

                        J(η)    0.6
                                0.4
                                0.2
                                0.0
                               -0.2
                                       -4      -2       0        2       4           6
                                                            η
                                        Figure 1. Graph of J(η) vs. η (see Eq. 5).

EXPERIMENTAL ARRANGEMENT

In Fig. 2 we show the experimental setup used to measure the reflectance of a laser beam and its angle-
derivatives near the critical angle. The critical reflection takes place at the interface between lens L (6 cm in
diameter and a refraction index n1 of 1.515), and the sample at point C indicate in the figure. L is a semi-
cylindrical lens with a semicircular cross section and a flat wall. It is placed on an opening in the central part of a
cylindrical container. Mirror M1 is driven by a homemade piezoelectric-actuator, adding a small angle-modulation
to the laser beam. The reflected beam is redirected to a silicon photodetector (PD). The DC-signal from PD is
proportional to the reflectance, R, of the laser beam; and for a small enough angle-modulation (much smaller than
the divergence angle of the laser beam) the amplitude of the AC-signal is proportional to the first angle-derivative
of the reflectance, dR/dθi, [4]. Lens L and the cylindrical container are fixed to a high-precision rotation stage. The
angle of incidence is varied by rotating the lens and cylindrical container about the reflection point C. We used a
He-Ne laser (632 nm of wavelength and a beam diameter of 0.8mm). The laser intensity stability was tested and
verified to be within 0.5% for periods about an hour.

A typical signal obtained with RLCA is shown in Fig. 3. The signal comes from a deionized water sample. This
curve of angular derivative of reflectance can be taken as a reference signal. The curve of reference allows
estimated the changes of the index of refraction of samples pulp. Note in the figure the maximum value of the
signal is near of the critical angle and utilizing a preliminary estimation with the Snell law, the refraction index of
the sample can be determined.
Figure 2. Schematic of our experimental setup of RLCA (see text for details).
0.08
0.06
AC Signal (mV)
0.04
0.02
0.00
60.0 60.5 61.0 61.5 62.0 62.5
o
Incidence Angle ( )
Figure 3. Signal measured by the RLCA technique.
THE ACOUSTIC IMPACT TECHNIQUE
In general, fruit quality is associated with acceptance by consumers. However, fruit quality can be closely related
to the firmness index, a well accepted indicator of quality. AIT is a non-destructive technique for quality control of
fruits which has brought a lot of attention because of its simplicity to implement it [1]. In general terms, when using
AIT a small mass hits the fruit at its equatorial zone. The excited vibrations of the fruit are measured with a
microphone at the opposite side of the impact. The acoustic signal recorded by the microphone is sent to an
acquisition data unit to get its acoustic spectrum. From the spectrum the dominant resonance frequency is
monitored. When the maturation process of the fruits takes place, this dominant resonance frequency shifts to
lower values. The so-called firmness index Sc is defined as follows [1-3]:
2/3 2
Sc = m f, (6)
where m is the mass of the fruit and f its dominant resonance frequency measured by AIT. Units for Sc are kg2/3
Hz2. ATI has been applied to a wide variety of fruits and has proved to be useful in measuring Sc [1-3].
Fig. 4 shows our implemented experimental setup of AIT. A plastic rigid ball B (2.46 cm in diameter and 7.1 grams
in mass) was suspended from a thin cord C (19.33 cm long) to form a typical pendulum. The impact angle was 20
degrees measured with the protractor P. The pendulum was placed on the movable base M to allow for impacts at
the equator of the fruit. These values were chosen after several tests on different fruits to have no damage and toget repeatable acoustic signals. The fruit F under test was placed on foam base G to minimize unwanted
vibrations. Sound sensors S (PASCO model CI-6506B) were used to capture the vibrations from the fruit and the
acoustic signal was sent an electronic interface A (PASCO model CI-7650) connected to a PC. The acoustic
signal was sampled at 5000 samples per second during 25 milliseconds. The signal analysis was performed with
the DataStudio program from PASCO Company. Masses were measured with an Ohaus balance (not shown in
the figure).
Typical signals with our ATI scheme describe above are shown in Fig. 5 for two fruits: apple and mango. Fig. 5(a)
plots the voltage signals recorded by the sound sensor. The dominant resonance frequencies for both fruits are
clearly defined in the frequency spectra, in arbitrary units, of Fig. 5(b). The relative size among the signals is an
indicative of the stronger attenuation of the acoustic signal inside the mango. When the mass and the dominance
resonance frequency are measured during a time period the firmness index Sc (see Eq. (6)) can be quantified.
Figure 4. Basic setup to instrument AIT (see text for details).
Figure 5: (a) Acoustic signals and (b) Frequency spectra for apple and mango fruits. The inset is
a close up showing details of the mango frequency spectrum.MONITORING THE REFRACCTION INDEX OF A MANGO PULP SAMPLE
The firmness index Sc of two sets of Mexican mangos in different ripening stages was measured by AIT, as
described above, during two weeks. Set A were mangoes in a more mature stage than set B. The behavior of Sc
indicates the firmness loss with regard to the ripening stage of the fruit. After measuring Sc by AIT, the refraction
index was measured by the LRCA technique for mango pulp samples with different degrees of ripening. The
mango pulp was processed with a home blender to obtain a liquid sample and placed into the cylindrical container
shown in Fig. 2. Care should be taken to avoid contamination of the sample. Fig. 6 shows different curves of the
angular derivative of reflectance for the sample of water (medium of reference), and three different mango pulp
samples analyzed in the first, around the middle and the last day of measurements during the two weeks. A shift
to greater angles is observed due to that the refraction index increased. The decrease of the heights of the
curves is an indicator of the imaginary component of the refraction index (optical absorption). The black plot in
Fig. 6 represents the reference signal shown in Fig. 3.
Deionized water
Pulp sample 1
Pulp sample 2
1.0 Pulp sample 3
0.8
AC Signal (mV)
0.6
0.4
0.2
0.0
60 61 62 63 64 65
o
Incidence Angle ( )
Figure 6. Signals from three mango samples measured by LRCA. The reference signal is in black.
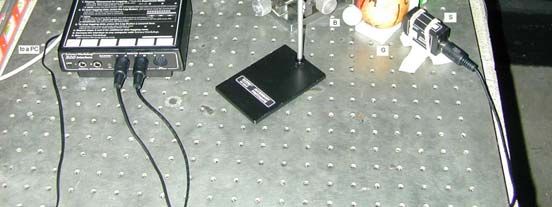
After measuring the firmness index and refraction index values of the two mango sets, we get the results shown in
Fig. 7. The marks in the horizontal axis correspond to the first (1), around the middle (2) and the last day of
measurements (3) during the two weeks. The three points in the upper branch in Fig. 7 are the values for the
mango set A and the three points in the lower branch are the values for the mango set B. From this graph we can
observe that mangoes in a less mature stage (set B) show lower refraction index values than those ones in a
more mature stage (set A). Contrary, the firmness index of the mango is greater in set B than that one in set A.
However, correlation among the refraction index and the firmness index is observed: both parameters decrease
as the maturation process goes on.2 2/3
64034 Hz Kg
1.39 45210 Hz Kg
2 2/3
1.38
Refraction Index
2 2/3
17072.5 Hz Kg
1.37
2 2/3
1.36 100105.5 Hz Kg
2 2/3
65842.9 Hz Kg
2 2/3
1.35 40348.9 Hz Kg
1 2 3 4 5 6
Mango Pulp Sample
Figure 7. Refraction index and firmness index values for mango fruits. The upper branch
corresponds to mango set A and the lower one to mango set B.
CONCLUSIONS
The results reported in this work show that the measurements of the refraction index (optical parameter) by the
RLCA technique could be used as a complementary tool to measurements of the firmness index (mechanical
parameter) by AIT of fruits. Our results for Mexican mangoes exhibit good correlation among these two
parameters. Further studies along these lines would allow correlating sugar content of fruits with the parameters
analyzed in this work.
ACKNOWLEDGMENTS
We are grateful to Leonal Abad for technical suport. We also acknowledge financial support Consejo Nacional de
Ciencia y Tecnología (México) through grant CB-05-01 No. D49482-F and the UMSNH through grant CIC-
UMSNH 9.20 and 9.23.
REFERENCES
1. Abbott, J. A., Postharvest Biol. Technol. 15, 207-225 (1999).
2. Duprat, F. et al., J. Agric. Eng. Res. 66, 251-259 (1997).
3. Delwiche, M. J. et al., Trans. Amer. Soc. Agr. Eng. 30, 249-254 (1987).
4. Augusto García-Valenzuela, M. Peña-Gomar, C. García-Segundo and V. Flandes-Aburto, Sens. and Actuators
B, 5213, 236-242 (1998).
5. Peña-Gomar and Augusto García-Valenzuela, Appl. Opt., 39, 5131-5137 (2000).
6. García-Valenzuela and M. Peña-Gomar, Optical Engineering, Opt. Eng. 41, 1704-1716 (2002).You can also read