Marangoni convection: velocity measurements using PTV method around a single vapor bubble.
←
→
Page content transcription
If your browser does not render page correctly, please read the page content below
21ème Congrès Français de Mécanique Bordeaux, 26 au 30 août 2013
Marangoni convection: velocity measurements using PTV
method around a single vapor bubble.
V. CARVALHO, M. BARTHES, V. LEPILLER, Y. BAILLY
Institut FEMTO-ST, UMR CNRS 6174, dpt ENERGIE, 2 avenue Jean Moulin, 90000 BELFORT CEDEX
(France)
Résumé :
Ces travaux portent sur la caractérisation hydrodynamique de la convection de Marangoni autour d’une
bulle de vapeur unique de FC-72. Une cellule d’ébullition est utilisée pour générer la bulle unique de vapeur
dans le liquide sous refroidi. Un système de mesure optique de PTV (Particle Tracking Velocimetry) est
monté sur la cellule et permet d’obtenir les champs de vitesse au niveau de l’interface liquide-vapeur. Ainsi
l’observation de la convection de Marangoni sous forme de rouleaux a été possible. L’influence du niveau de
sous refroidissement du liquide sur la vitesse de ces rouleaux convectifs a été mise en évidence dans cette
étude.
Abstract :
An experimental investigation of the Marangoni convection around a single vapor bubble of FC-72 on a
downward-facing heated surface was reported. The boiling cell used for this study was equipped with an
optical measurement system which was dedicated to the Particle Tracking Velocimetry (PTV) method. This
method allowed us to obtain the velocity fields in the liquid around the vapor bubble. From the velocity fields
obtained, we emphasized the presence of Marangoni convection rolls in the vicinity of the liquid-vapor
interface. Lastly, the influence of levels of subcooling on the velocity of convective rolls related to the
Marangoni effect was investigated.
Keywords : Marangoni convection, vapor bubble, Particle Tracking Velocimetry (PTV), FC-72
1 Introduction
In the presence of a surface tension gradient along an interface, a flow can occur: it’s the Marangoni
convection. C. G. M. Marangoni, an Italian scientist, was the first to describe the phenomenon of this fluid
motion during his works in 1865 [1]. The surface tension, , is function of the temperature T, of the
concentration c and of the electrical potential E. The variation of the surface tension versus s, the curvilinear
coordinate in the direction of the surface tension gradient, is given by the following equation:
d T c E
ds T s c s E s
When the temperature is the only parameter that has an influence on the surface tension variation, Marangoni
convection is called thermocapillary convection. The interface that separates the two fluids can have
different shapes (plane, bubble…). We focus here on a bubble’s shape interface.
Many studies were carried out on Marangoni convection in the case of an air bubble injected in a liquid layer
(i.e. without phase change) [2, 3, 4]. Fewer studies were conducted in the case of a vapor bubble, i.e. with
liquid-vapor phase change [5, 6]. For both operating conditions (air or vapor bubble), most of the studies
focused on the thermal aspects rather than on the hydrodynamics. For instance, Wozniak et al. [7] showed
the influence of the liquid bulk’s temperature (silicone oil) on the velocity of convective rolls around an air
121ème Congrès Français de Mécanique Bordeaux, 26 au 30 août 2013
bubble which was injected into a silicone oil layer submitted to a vertical thermal gradient. They used Liquid
Crystal as tracer particles and deduced from their tracking the velocity of convective rolls.
We decided to study Marangoni convection in the case of a vapor bubble growing underneath a heated wall.
More precisely, in this study, we focused on the influence of the level of subcooling on the dynamics of the
convective motions around a single vapor bubble of FC-72. The Particle Tracking Velocimetry (PTV)
method was used to obtain velocity fields in the vicinity of the liquid-vapor interface. This method was
already successfully tested [8].
In a first part, the experimental bench used to generate the vapor bubble and to measure the velocity of the
Marangoni convection is described. Then the results obtained are presented and discussed.
2 Experimental rig
The FIG. 1 (a) shows a schematic of the experimental bench used for this study. It was composed of the
boiling cell and a set of equipment necessary for the PTV method, for control of operating conditions and for
data acquisition.
(a) (b)
FIG. 1 – Diagram of the experimental bench (a) and a picture of the inside of the boiling cell (b)
2.1 Boiling cell
The boiling cell (cf. FIG. 1 –a and b) was a cube of stainless steel with an internal volume of 720 cm3
(external dimension: 110110120 cm3). The top side of the cell was used to support the heating element.
One of the sides was used to support the instrumentation (heating of the liquid bath, temperature sensors).
And the last four sides were composed of glass windows that allowed the optical measurements. The cell
was filled with non degassed Fluorinert FC-72. We used an expansion vessel with a variable volume to
maintain the cell at atmospheric pressure. To observe the thermocapillary convection, a temperature gradient
must be present alongside the bubble’s interface. Thus we worked with a subcooled liquid (with a
temperature below the saturation’s one). The heating element was then the hot spot, and the subcooled liquid
the cold spot. Four heaters were used to maintain the fluid at a required temperature. This last one was
measured by thermocouples and fixed using a PID controller. The temperature sensors were K type
thermocouples which were manufactured and calibrated in our laboratory. The heating element was a
downward facing one (to reach larger bubble’s size and growth periods). It was composed of an electrical
resistance and a polished copper disc. The artificial nucleation site was located in the center of the disc. It
had a conical shape with a diameter of 100 m and an apex angle of 45°.
221ème Congrès Français de Mécanique Bordeaux, 26 au 30 août 2013
2.2 PTV system
The principle of the PTV (Particle Tracking Velocimetry) method consists in seeding a flow with reflecting
particles. A plan of the liquid is illuminated by two light pulses separated with a known time interval. A
camera placed perpendicular to light sheet records two images corresponding to each pulse of light. Image
processing is performed on the images and gives the spatial displacement of the liquid (See FIG. 2).
Knowing the spatial displacement and the time interval, velocity vector fields are obtained
In this study, we used the commercial software Insight (TSI) for the image processing. A first algorithm
consists in the identification of each particle, allowing to know their position in the initial picture. Then a
tracking algorithm seeks identified particle on the picture t into the picture t+1. Finally, a bicubic
interpolation algorithm enables to obtain velocity fields.
FIG. 2 - Illustration of the principle of the PTV method
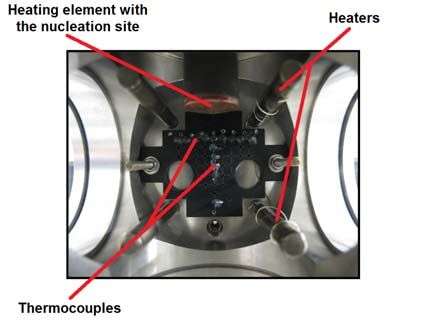
The system of velocimetry used in this study is illustrated in FIG. 3. A suitable optical system allowed to
obtain a light sheet from a pulsed Nd:YAG laser (with a wavelength of 532 nm). The seeding particles used
were hollow glass beads coated with silver. Images were recorded in 12 bits by a CCD camera (TSI
PIVCAM 13-8) with a resolution of 12801024 pixel. The camera lens used for this study was a Nikon AF
micro nikkor, 60 mm 1:2.8 D. A synchronizer was used to harmonize the laser pulses with image acquisition.
FIG. 3 - Picture of PTV system on the experimental setup
In the following section, we will present the operating conditions of this study as well as the different results
obtained.
3 Results - Discussion
The only parameter that varied in this study was a thermal one: the level of subcooling ΔTsub. It corresponds
to the temperature difference between the liquid bulk and the saturation. The temperature of the liquid bulk
used was obtained by an average of values delivered by the thermocouples in the liquid bath (cf. FIG. 1 b).
The pressure was the atmospheric one, and the associated saturation temperature of the FC-72 was 329.8 K.
321ème Congrès Français de Mécanique Bordeaux, 26 au 30 août 2013
Three levels of subcooling were investigated: 16.9 K, 18.8 K and 20.8 K. The heating power for the
nucleation surface was set at 1.62 W. These parameters were selected based on a previous study [8] that
showed the presence of Marangoni convection around a vapor bubble in similar operating conditions.
The FIG. 4 represents an example of velocity field obtained for a level of subcooling equal to 18.8 K. We can
see in this figure the vapor bubble and, on its left side, a convective roll. The liquid near the interface was
driven from the base (hot spot located near the heating wall) to the top (cold spot, in the subcooled liquid) of
the bubble. The liquid displacement was thus due to the surface tension gradient that existed along the liquid-
vapor interface. This phenomenon is characteristic of Marangoni convection.
Heating wall
Convective Vapor
roll Bubble
Subcooled
liquid
FIG. 4 - Velocity fields obtained for a level of subcooling of 18.8K (heating power: 1.62 W)
One can also see on FIG. 4 that the roll is not symmetrical: it isn’t visible on both sides of the vapor bubble.
On this picture, operating conditions (thermal and geometrical parameters) corresponded to the observation
of the oscillatory state. Indeed, the Marangoni convection is a three dimensional phenomenon. Depending on
various parameters (such as thermal or geometrical) there is a transition from steady state to an oscillatory
mode [9]. Reynard et al. [10] used tracer particles to observe those modes around an air bubble injected in a
silicone oil layer. Concerning the vapor bubble, those authors used the shadowgraphy method to emphasize
the presence of oscillatory mode. For small bubbles and/or lower temperature difference between the heated
wall and the liquid, the steady state corresponded to a symmetrical tore existing around the bubble. Then for
larger bubbles and/or higher temperature gradients, 3D oscillations were observed. They corresponded to a
distortion of the roll into several patterns: the roll structure was composed of outward and inward extrema
which were periodically space and time dependent.
FIG. 5 - Maximum velocity of rolls versus a bubble diameter for the different levels of subcooling ΔTsub
421ème Congrès Français de Mécanique Bordeaux, 26 au 30 août 2013
From the velocity vector fields, maximum velocities were determined for convective rolls and found to be
between 0.1 cm/s and 0.2 cm/s. The order of magnitude of these velocities was found to be identical to the
one measured around an air bubble injected into an alcohol and a glycerol liquid layer [11]. On the FIG. 5,
maximum velocities are given versus the bubble diameter (here corresponding to the major axis of the
bubble). First, during the bubble growth (i.e. bubble’s diameter increase), velocities increased. Then, the
velocity decreased after the bubble reached a diameter we’ll call “critical diameter”: 1.58 mm, 1.94 mm and
2.20 mm for levels of subcooling of respectively 20.8, 18.8 and 16.9K. Based on visualisation, this critical
diameter seemed to correspond to the transition from the stationary (axial symmetry) to the oscillatory mode.
The maximum velocities corresponding to these critical diameters were equals to 0.15, 0.17 and 0.19 cm/s.
Thus, we observed an increase in the maximum of velocity when the level of subcooling decreased.
The level of subcooling was directly related to the temperature of the liquid bulk and to the vertical thermal
gradient. An increase of the liquid bulk temperature also implied the decrease of the FC-72 viscosity.
Moreover, when the level of subcooling decreased, the onset of the oscillatory state occurred for larger
bubbles [Reynard 2005]. Combining these effects, the liquid motion should be eased (by the viscosity
decrease) and larger stationary rolls should be observed (larger bubble’s size). This could explain the fact
that the critical velocity increased for smaller levels of subcooling and larger bubble’s diameters. The PTV
can only deliver 2D information whereas the oscillatory state is 3D. To verify our hypothesis, our prospects
will be to carry out experiments using a 3D optical method: the Rainbow Volumic Velocimetry RVV [12].
4 Conclusion
In this study, we used the Particle Tracking Velocimetry (PTV) method to characterize the Marangoni
convection around a single vapor bubble of FC-72. The vapor bubble was generated on a downward facing
heating element in subcooled FC-72. The PTV method allowed us to obtain the velocity fields of the liquid
near the liquid-vapor interface for various levels of subcooling. From these velocity fields we noted the
maximum of velocity in convective rolls related to the Marangoni effect. This maximum of velocity
increased when the level of subcooling decreased. For levels of subcooling equal to 20.8, 18.8 and 16.9 K,
maximum velocities were equal to 0.15, 0.17 and 0.19 cm/s. Marangoni convection is a three-dimensional
hydrodynamic phenomena with different modes (depending on parameters such as bubble’s size and liquid
subcooling). To investigate and characterize the Marangoni convection in the three spatial dimensions,
another optical method will be used: the Rainbow Volumic Velocimetry (RVV) method [12].
References
[1] Scriven L. E. & Sternling C. V., The Marangoni Effects, Nature, 187, 186-188, 1960.
[2] Chun C. H., Raake D. & Hansmann G., Oscillating convection modes in the surroundings of an air
bubble under a horizontal heated wall, Experiments in Fluids, 11, 359-367, 1991.
[3] Wozniak G., Optical whole-field methods for thermo-convective flow analysis in microgravity,
Measurement Science and Technology, 10, 878, 1999.
[4] Straub, J., Origin and Effect of Thermocapillary Convection in Subcooled Boiling, Annals of the New
York Academy of Sciences, 974, 348 - 363, 2002.
[5] Kao Y. S. & Kenning D. B. R., Thermo capillary flow near a hemispherical bubble on a heated wall,
Journal of Fluid Mechanics, 53, 715 - 735, 1972.
[6] Barthès M., Reynard C., Santini R. & Tadrist L., Détermination des caractéristiques géométriques de la
croissance d'une bulle de vapeur et des transferts de chaleur associés: influence des incondensables sur le
déclenchement d'instabilités convectives, Mecanique et Industries, 6, 257, 2010
[7] Wozniak K., Wozniak G. & Rösgen T., Particle-image-velocimetry applied to thermocapillary
convection, Experiments in Fluids, 10, 12-16, 1990.
[8] Carvalho V., Barthès M., Lepiller V. & Bailly Y., Caractérisation de la convection thermocapillaire
autour d'une bulle de vapeur nucléée par la méthode PIV 2D, Congrès Français de Visualisation et de
Traitement d'Images en Mécanique des Fluides, 2011
521ème Congrès Français de Mécanique Bordeaux, 26 au 30 août 2013
[9] Kassemi M. & Rashidnia N., Steady and oscillatory thermocapillary convection generated by a bubble,
Physics of fluids, 12, 3133-3146, 2000.
[10] Reynard C., Barthès M., Santini R. & Tadrist L., Experimental study of the onset of the 3D oscillatory
thermocapillary convection around a single air or vapor bubble: Influence on heat transfer, Experimental
Thermal and Fluid Science, 29, 783 - 793, 2005.
[11] Baranenko, V. I. & Chichkan, L. A. Thermocapillary Convection in the Boiling of Various Fluids, Heat
Transfer, Soviet Research, 12, 40 - 44, 1980.
[12] Prenel, J. & Bailly, Y., Recent evolutions of imagery in fluid mechanics: From standard tomographic
visualization to 3D volumic velocimetry, Optics and Lasers in Engineering, Optical Methods in Heat
Transfer and Fluid Flow Optical Methods in Heat Transfer and Fluid Flow, 44, 321-334, 2006.
6You can also read