Characterization of the public transit air microbiome and resistome reveals geographical specificity
←
→
Page content transcription
If your browser does not render page correctly, please read the page content below
Leung et al. Microbiome      (2021) 9:112
https://doi.org/10.1186/s40168-021-01044-7

 RESEARCH                                                                                                                                          Open Access

Characterization of the public transit air
microbiome and resistome reveals
geographical specificity
M. H. Y. Leung1†, X. Tong1†, K. O. Bøifot2,3†, D. Bezdan4, D. J. Butler4, D. C. Danko4, J. Gohli2, D. C. Green3,
M. T. Hernandez5, F. J. Kelly3, S. Levy6, G. Mason-Buck3, M. Nieto-Caballero5, D. Syndercombe-Court3, K. Udekwu7,
B. G. Young4, C. E. Mason4,8,9,10*, M. Dybwad2,3* and P. K. H. Lee1*

  Abstract
  Background: The public transit is a built environment with high occupant density across the globe, and identifying
  factors shaping public transit air microbiomes will help design strategies to minimize the transmission of
  pathogens. However, the majority of microbiome works dedicated to the public transit air are limited to amplicon
  sequencing, and our knowledge regarding the functional potentials and the repertoire of resistance genes (i.e.
  resistome) is limited. Furthermore, current air microbiome investigations on public transit systems are focused on
  single cities, and a multi-city assessment of the public transit air microbiome will allow a greater understanding of
  whether and how broad environmental, building, and anthropogenic factors shape the public transit air
  microbiome in an international scale. Therefore, in this study, the public transit air microbiomes and resistomes of
  six cities across three continents (Denver, Hong Kong, London, New York City, Oslo, Stockholm) were characterized.
  Results: City was the sole factor associated with public transit air microbiome differences, with diverse taxa
  identified as drivers for geography-associated functional potentials, concomitant with geographical differences in
  species- and strain-level inferred growth profiles. Related bacterial strains differed among cities in genes encoding
  resistance, transposase, and other functions. Sourcetracking estimated that human skin, soil, and wastewater were
  major presumptive resistome sources of public transit air, and adjacent public transit surfaces may also be
  considered presumptive sources. Large proportions of detected resistance genes were co-located with mobile
  genetic elements including plasmids. Biosynthetic gene clusters and city-unique coding sequences were found in
  the metagenome-assembled genomes.
  (Continued on next page)

* Correspondence: chm2042@med.cornell.edu; marius.dybwad@ffi.no;
patrick.kh.lee@cityu.edu.hk
†
 M. H. Y. Leung, X. Tong and K. O. Bøifot contributed equally to this work.
4
 Department of Physiology and Biophysics, Weill Cornell Medicine, New York,
NY, USA
2
 Comprehensive Defence Division, Norwegian Defence Research
Establishment FFI, Kjeller, Norway
1
 School of Energy and Environment, City University of Hong Kong, Hong
Kong SAR, China
Full list of author information is available at the end of the article

                                       © The Author(s). 2021 Open Access This article is licensed under a Creative Commons Attribution 4.0 International License,
                                       which permits use, sharing, adaptation, distribution and reproduction in any medium or format, as long as you give
                                       appropriate credit to the original author(s) and the source, provide a link to the Creative Commons licence, and indicate if
                                       changes were made. The images or other third party material in this article are included in the article's Creative Commons
                                       licence, unless indicated otherwise in a credit line to the material. If material is not included in the article's Creative Commons
                                       licence and your intended use is not permitted by statutory regulation or exceeds the permitted use, you will need to obtain
                                       permission directly from the copyright holder. To view a copy of this licence, visit http://creativecommons.org/licenses/by/4.0/.
                                       The Creative Commons Public Domain Dedication waiver (http://creativecommons.org/publicdomain/zero/1.0/) applies to the
                                       data made available in this article, unless otherwise stated in a credit line to the data.
Leung et al. Microbiome (2021) 9:112 Page 2 of 19 (Continued from previous page) Conclusions: Overall, geographical specificity transcends multiple aspects of the public transit air microbiome, and future efforts on a global scale are warranted to increase our understanding of factors shaping the microbiome of this unique built environment. Keywords: Microbiome, Metagenomics, Microbial ecology, Air microbiology, Bioinformatics, High-throughput sequencing Background regarding the functional potential and resistome profiles The built environment (BE) plays host to a diverse assem- of public transit air, and no systematic and comprehensive blage of microorganisms collectively termed the micro- study to compare and contrast public transit air micro- biome [1]. The advent of metagenomic sequencing has biome across multiple cities. Characterization of the air expanded our understanding of how different environmen- microbiomes and resistomes across public transit systems tal, geographical, and anthropogenic factors shape the BE is of paramount importance to ultimately identify build- microbiome [2–5]. In particular, the recent application of ing, environmental, and anthropogenic factors that have shotgun metagenomics sequencing has further deepened an impact on the public transit air microbiome and resis- our insights into the functional, adaptive, and resistance po- tome, which will help experts in public health and engin- tentials of the indoor microbiome [5–7], as well as potential eering fields in implementing strategies to minimize transmission events between BEs and occupants [8–10]. occupants’ exposure to pathogens in public transits. Of different urban BEs, public transit systems are among Recently, the Metagenomics and Metadesign of Sub- the most common infrastructures, through which more ways and Urban Biomes (MetaSUB) International Con- than 160 million individuals pass every day [11], exchan- sortium [24] have performed a large-scale ging microorganisms with each other, as well as with pub- characterization of the surface microbiomes and resis- lic transit surfaces and air. The high occupant density tomes of different global public transit systems [25], pro- within a typical public transit environment may present a viding an account of the biogeography of public transit public health concern, by facilitating the transmission of surface microbiomes and resistomes. Here, we matched microorganisms between commuters via fomites [12] or the large-scale surface study with a seminal, comprehen- via airborne routes [13]. As urbanization and sive characterization of the public transit air micro- modernization take place, the number of individuals trav- biomes of six geographically distinct locations (Denver, elling on global public transit systems will surely increase Hong Kong, London, New York, Oslo, and Stockholm) for decades to come. Therefore, a greater understanding by using shotgun metagenomics, combined with stan- of the assembly mechanisms of the public transit micro- dardized air sampling and centralized sample processing biome and its repertoire of antibiotic resistance (AR) and bioinformatics methodologies. We hypothesize that genes, i.e. resistome, as well as potential factors governing geographical specificity transcends multiple aspects of the relationships between the public transit environment, the public transit air microbiome, from community commuters, and microbial community, will pave the way composition to functional and resistome profiles. towards minimizing the transmission of pathogens and the resistome in public transits [14, 15]. Results As much as the dire need for a comprehensive under- Overall community overview of the public transit air standing of the public transit microbiome using shotgun microbiome metagenomics is appreciated, shotgun metagenomics se- A total of 468 species-level taxa were identified in the public quencing has only been applied to profile public transit transit networks. As expected, the majority of the community surfaces [16, 17]. These studies have collectively shed were assigned bacteria (average relative abundance of the en- light into the dynamics of the public transit surface tire dataset (96.5%), followed by virus (3.21%), fungi (0.19%), microbiomes and resistomes, and its potential relation- and archaea (0.043%) (Fig. 1a). The core microbiome con- ships with commuters. However, as in other BEs [18], sisted of 17 species (species-level taxa detected in ≥ 75% of public transit surface communities represent only a par- the dataset) and included commensals of human skin (Cuti- tial illustration of the overall public transit microbiome. bacterium acnes, Micrococcus luteus, Propionibacterium On the other hand, investigations of the public transit granulosum, Staphylococcus hominis), as well as species of microbiome are limited to single cities using amplicon environmental origins (Kocuria rhizophila) (Fig. 1b). The en- sequencing [19–23], which has limited our understand- richment of Enhydrobacter aerosaccus in Hong Kong is con- ing of the public transit microbiome to taxonomic com- sistent with previous observations suggesting that the public position. As a result, there is currently no information transit air microbiome in general is influenced by the human
Leung et al. Microbiome       (2021) 9:112                                                                                                 Page 3 of 19

 Fig. 1 Effects of geography and related factors in driving public transit air microbiome. Colours represent each city: Denver (orange), Hong Kong
 (red), London (purple), New York (blue), Oslo (yellow), Stockholm (green). a Relative abundance of bacteria, fungi, virus, and archaea across cities.
 b Density plot of core species-level taxa (present in ≥ 75% of all samples). c and d Significant differences between c Shannon diversity index
 (Wald chi-square test p = 2.3 × 10⁻²⁶) and d normalized richness (Wald chi-square test p = 5.5 × 10⁻²⁵) of public transit air microbiomes were
 detected. Asterisks above horizontal bars indicate mixed model pairwise comparison significance following Tukey method p-value adjustment: *p
 < 0.05, **p < 0.01, ***p < 0.001. e Principal coordinates analysis plot of community composition based on Bray-Curtis dissimilarity of public transit
 air microbiomes grouped by city. The normal confidence ellipses indicate the confidence level at 95%

skin [19, 20], and that members of Enhydrobacter may be                       316,994 reads, both Shannon diversity and richness were
more abundant and prevalent in Asian individuals [26, 27].                    significantly different among cities (Fig. 1c, d and Add-
Pathogens as classified by the National Institute of Allergy                  itional file 1: Table S1), and also between outdoor and
and Infectious Diseases (NIAID) were not detected in this                     indoor subway stations (p = 0.025 for Shannon, p = 1.0
dataset.                                                                      × 10−4 for richness). The number of transit connections
                                                                              through a station was not significantly associated with
Public transit air microbiome exhibited geographical                          Shannon diversity (p = 0.065) but was associated with
variations                                                                    differences in microbial richness (p = 0.05). Julian day
A linear mixed model was adopted to compare microbial                         and whether the public transit station was aboveground
diversity across cities and public transit characteristics                    or underground were not significant predictors of micro-
(Additional file 1: Table S1). Following normalization to                     bial diversity and richness.
Leung et al. Microbiome (2021) 9:112 Page 4 of 19
A nested PERMANOVA analysis revealed that city (GRiD < 2.5), consistent with those inferred from BE
was the single greatest factor in explaining community dust [29]. Specifically, taxa of Micrococcus exhibited
compositional and membership differences (Additional GRiD values > 1 across cities (i.e. suggestive of potential
file 1: Table S1 and Fig. 1e). A pairwise PERMANOVA active replication), while some other genera and species
analysis across the six cities also showed significant dif- were only inferred to be replicating in certain public
ferences between all city pairs (FDR-adjusted p = 0.001 transits (e.g. taxa of Gordonia, Roseomonas, Dermacoccus
for all comparisons). Building design factors, ground in Hong Kong, a number of Kocuria, Dietzia, and Arsini-
level, indoor/outdoor, and the number of transit connec- cicoccus species in New York, and Acinetobacter in
tions in the public transit networks had no significant London) (Fig. 2a). Members of Enhydrobacter were de-
influence on the overall public transit air microbiome tected in public transits of larger metropolises (Hong
(Additional file 1: Table S1). Julian day had also no sig- Kong, London, New York), but its inferred growth ap-
nificant effect on changes in community composition peared to be more cosmopolitan among Hong Kong
and membership. Indicator species analysis revealed that metagenomes. Interestingly, taxa with the highest GRiDs
the public transit air microbiome in Hong Kong was typ- are of soil and plant origins (Sphingomonas sp. Ant20,
ically characterized by high abundance of Gordonia ter- Paracoccus sphaerophysae, Deinococcus wulumuqiensis)
rae, and Corynebacterium halotolerans was uniquely (Fig. 2a).
enriched in the public transit air in London. For a given species, the GRiDs are potentially the aver-
age inferred rates of multiple strains. Therefore, to dis-
Community- and subspecies-level in situ growth rate cern inferred rates of individual strains that differ by
inference SNPs, strain-level estimation of growth (SMEG) was per-
Growth Rate InDex (GRiD), a growth rate estimation formed for the skin commensals C. acnes and M. luteus
method based on coverage ratios between ori and ter re- (Fig. 2b). SMEG showed both single strains of M. luteus
gions [28], was used to infer bacterial growth within the (cluster 1) and C. acnes (cluster 1) being present across
public transit air community. Overall, the majority of de- public transits at growth rate ratios near 1. However,
tected species presented low inferred growth rates metagenomes in Hong Kong had distinct strains (M.
Fig. 2 Inferred species- and strain-level growth rates showed geographically specific profiles. GRiD and SMEG were respectively applied to infer
the a species- and b strain-level growth rates. GRiD was shown for species-level taxa with indices detected in greater than 10% of samples in the
dataset. Samples with coverage below the default threshold for each species could not have their growth rates inferred and are indicated as
white spaces on the plotsLeung et al. Microbiome (2021) 9:112 Page 5 of 19
luteus cluster 3 and C. acnes cluster 4) with higher rates. the genus (Additional file 2: Figure S1a). Contributional
These results suggest that there are potential geograph- diversity analysis suggested that some functional poten-
ical variations in bacterial growth profiles at a species tials may be conserved between public transit air micro-
level, but different closely related strains within a species biomes that are otherwise taxonomically heterogeneous
may be active in a particular public transit system. (Additional file 2: Figure S1b, c and Additional file 3:
Table S2).
Geographical differences in gene contents of strains
associated with adaptive functions Identification of taxonomic drivers of functional shifts in
Two skin commensals (C. acnes and M. luteus) alone public transit air microbiome across cities
made up nearly 50% of the public transit air microbiome Having identified functional differences across the public
abundance across the six cities, recapitulating results from transit air microbiome, FishTaco [32] was applied to
previous studies highlighting the important influence of identify species estimated to drive the observed differ-
the skin microbiota in public transit air [19, 20]. As bio- ences (Additional file 4: Figure S2 and Additional file 5:
geographical patterns in human source microbiota may Table S3). The majority of geographical shifts were re-
contribute to observed geography-based microbiome vari- lated to the metabolism of sugars, lipids, and amino
ations [18], strain-level clustering patterns of C. acnes and acids. Interestingly, geographically-specific enrichments
M. luteus were examined. StrainPhlAn phylogenetic ana- of functions related to the biosynthesis of secondary me-
lysis revealed extensive strain heterogeneity; strains with > tabolites (geraniol (ko00281) and limonene (ko00903) in
99% non-polymorphic sites (i.e. single strains) were identi- Hong Kong, carotenoid (ko00906) and stilbenoids
fied in 69.5% and 29.9% of the samples in which C. acnes (ko00945) in New York, and novobiocin (ko00401) in
and M. luteus were detected, respectively (Fig. 3a). These Oslo were observed. In addition, a number of pathways
findings suggest that multiple strains of M. luteus may co- associated with the degradation of xenobiotic com-
exist within the samples, while C. acnes tended to be dom- pounds nitrotoluene (ko00633) in Denver, xylene
inated by a single strain in the majority of the samples. (ko00622) and caprolactam (ko00930) in Hong Kong,
Geographical specificity was also inferred at the strain and bisphenol (ko00363) in New York) were detected to
level for the two skin commensals (Fig. 3b, c), consistent be among the strongest influencers of functional varia-
with the release of commuter-associated microbiota, tions between public transits.
which is known to show geographical differences [18, 30]. For each city and differential pathway, a large number
Clustering patterns according to geography were also of taxa appeared to drive its enrichment or attenuation,
present at the phylogenomic level. Based on gene content, but a number of specific taxa had greater influences.
C. acnes strains detected in public transit air were most Overall, the most influential driving taxa belonged to
similar to the IA-1 and IB-2 subclades associated with indi- those present in all public transits but differed in abun-
viduals without acne [31] (Fig. 3d). M. luteus in public tran- dances across cities. In Denver, enrichment and attenu-
sit air resembled strains detected in other BEs including ation of microbial functions appeared to be driven by
farms and intensive care units, and less similar to those as- the skin colonizers C. acnes and M. luteus (Additional
sociated with plants and type strains (Fig. 3e). Multiple file 4: Figure S2a). In Hong Kong, the presence of the in-
metabolic and transport proteins, as well as genes encoding dicator species G. terrae drove the enrichment of a var-
transposases (K07492 and K07493) and resistance (K03325 iety of pathways related to degradation of steroids,
and K01551), were among the strongest markers for differ- caprolactam, and limonene (Additional file 4: Figure
entiating strains of M. luteus across cities (Fig. 3f, g). S2b). In London, K. rhizophila and related species of the
genus drove the enrichment of genes linked to caffeine
Functional potentials of public transit air microbiomes metabolism, while K. rhizophila and the skin bacterium
As with community composition, city was the factor Staphylococcus epidermidis drove the enrichment of
most strongly associated with functional profile differ- genes associated with D-arginine/D-ornithine metabolism
ences among public transit air microbiomes (Additional (Additional file 4: Figure S2c). Also in London, enrich-
file 1: Table S1). HUMAnN2 was applied to quantify the ment of functions related to chemotaxis and flagellar as-
abundance of KEGG Orthologues (KOs) for the public sembly, as well as lipopolysaccharide biosynthesis and
transit air microbiomes, and revealed that 13.3% of the two-component systems, appeared to be driven by differ-
observed KOs (1,172/8,503) were shared by > 90% of all ent species of Pseudomonas. In New York, Pseudomonas
samples across cities. KO-based indicator feature ana- stutzeri, which was previously documented as the most
lysis revealed that the public transit community in Hong abundant species [16], was a major influencer for the en-
Kong was distinctively characterized by mtfabH beta- richment of genes related to the biosynthesis of bile acid,
ketoacyl-[acyl-carrier-protein] synthase III (K11608), carotenoid, lipopolysaccharides, and polyketide sugars
mostly contributed by G. terrae and related members of (Additional file 4: Figure S2d). In Oslo, enrichment ofLeung et al. Microbiome (2021) 9:112 Page 6 of 19 Fig. 3 Strain-level geographical specificity in public transit air microbiome for bacteria C. acnes and M. luteus based on phylogenetic and phylogenomic analyses. a Percentages of non-polymorphic sites present within strains of C. acnes and M. luteus within metagenomes. b and c StrainPhlAn phylogenetic clustering of b C. acnes and c M. luteus. d and e Principal coordinates analysis plot of PanPhlAn phylogenomic gene content analysis of geography-based clustering based on Jaccard distances between strains within metagenomes. d C. acnes and e M. luteus genomes from different natural and built environments were included in the plot. f and g Geography-level KO biomarkers ranked by mean decrease in accuracy, with each KO colour coded by gene functional family (f), and the prevalence of the KO biomarkers in each city (light green and purple bars represent markers of C. acnes and M. luteus, respectively) (g) functions related to homologous recombination, pyrimi- Figure S2f). A full list of enriched taxa and estimated dine metabolism, and pantothenate/CoA biosynthesis taxonomic drivers are presented in Additional file 5: were contributed by M. luteus and a species of Nocar- Table S3. dioides (Additional file 4: Figure S2e). In Stockholm, C. acnes appeared to drive functional shifts by the enrich- Public transit air resistome largely sourced from human ment of pathways related to the biosynthesis and deg- skin, soil, and wastewater radation of glycan and glycan-containing compounds, as ShortBRED [33] identified 527 AR protein families well as simple and complex sugars (Additional file 4: across the public transit air microbiomes (Fig. 4). The
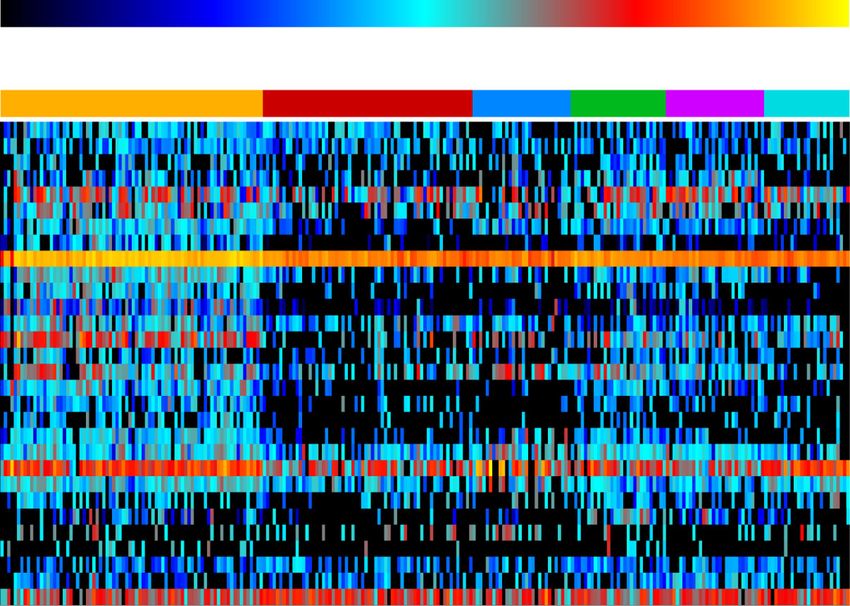
Leung et al. Microbiome       (2021) 9:112                                                                                              Page 7 of 19

 Fig. 4 Geographical specificity in public transit air resistome. Heatmap of the top 30 AR protein families based on average reads per kilobase per
 million (RPKM) reads across metagenomes. Core AR protein families (those detected in ≥ 75% of the entire dataset) are indicated in red
 and asterisks

core resistome (AR protein families detected in ≥ 75% of                    marine sediment/water (287), human oral cavity (262),
all samples) represented 1.3% (7/527) of the entire resis-                  and soil (251).
tome, suggesting immense heterogeneity of resistomes                           Resistomes of human skin, soil, and wastewater signifi-
across public transit networks. These core families                         cantly overlapped with public transit air, accounting on
encoded resistance against common antibiotics including                     average for 35.5 ± 15.6%, 31.9 ± 19.1%, and 15.6 ±
aminoglycoside, elfamycin, fluoroquinolone, macrolide,                      12.8%, respectively (Additional file 7: Figure S4). Human
and tetracycline. Consistent with our taxonomic and                         oral cavity (1.1 ± 3.0%) and gut (0.8 ± 2.5%) overlapped
functional observations, geographical differences were                      minimally with the AR genes detected in all cities. In
also observed for public transit resistomes (Additional                     addition, AR genes originating from animal faeces
file 1: Table S1 and Additional file 6: Figure S3) (p =                     shared a higher proportion of the air resistome in Den-
0.02 and 0.005, R2 = 0.06 and 0.07 for Bray-Curtis dis-                     ver than other cities, while Hong Kong and Stockholm
similarity and Jaccard distance respectively). Similar to                   appeared to harbour a sizeable fraction of AR genes that
community composition, the resistome of each city was                       may have been sourced from aquatic environments.
significantly different from every other city (FDR-ad-                         We also hypothesized that a major portion of the pub-
justed p = 0.001 for all pairwise comparisons).                             lic transit air resistome would be shared with adjacent
   To estimate the relative contributions by different po-                  public transit surfaces. To this end, we performed a sep-
tential putative resistome sources to the public transit                    arate SourceTracker analysis, including surface samples
air resistome, Bayesian sourcetracking [34] was per-                        collected from the complementary large-scale global
formed by including a global collection of resistome data                   public transit microbiome profiling work as putative
as putative sources. SourceTracker analysis has been                        sources [25]. Geographically specific ShortBRED
used previously to infer the estimated contribution by                      markers were detected on public transit surfaces with
putative sources of a resistome, based on the extent to                     London harbouring the most (466), followed by New
which a user-specified resistome source overlaps with                       York (435), Hong Kong (402), Denver (233), Oslo (223),
that of a metagenome sample as the sink [35]. In total,                     and Stockholm (160). When public transit surfaces were
1,402 ShortBRED markers (i.e. representative peptide se-                    included, they presented the greater source proportion,
quences for protein families) were detected among the                       surpassing that of human skin (Fig. 5a). Also, compared
182 source samples selected for this study. Specifically,                   with aboveground stations, human oral sources over-
source metagenomes from wastewater-activated sludge                         lapped with a greater proportion of the resistome in the
harboured 849 markers, which was the highest of the                         air of underground stations in Hong Kong (Mann-Whit-
ecotypes included for source analysis, followed by hu-                      ney test, p = 0.034; Fig. 5b), a pattern not observed for
man skin (643), animal faeces (607), human gut (495),                       other cities. Overall, the extensive overlap of resistomes
Leung et al. Microbiome      (2021) 9:112                                                                                              Page 8 of 19

 Fig. 5 Bayesian sourcetracking estimated public transit surface, human skin, and soil as major AR sources for public transit air resistome.
 Estimated proportions of resistome sources of different ecotypes in the public transit air microbiomes faceted by city (a) and by above- and
 underground stations within the Hong Kong public transit system (b)

between public transit air and those of adjacent public                     matching the Resfam [37] database. Of the AR gene-
transit surfaces, human skin, soil, and wastewater sug-                     containing contigs, 17.1% (8,899/52,004) also contained
gests that these putative sources have major influences                     plasmid determinants (Fig. 6a). Some of these plasmid
on the public transit resistome.                                            and/or AR gene-containing contigs also contained inte-
                                                                            gron components such as integrases, att sites, and CALI
Assembled contigs detected both AR genes as well as                         N (cluster of attC site lacking integron-integrase) sites
mobile genetic elements                                                     (Additional file 8: Table S4). Genes conferring a wide
Transmission of AR genes across the public transit air                      range of resistance mechanisms were detected across
microbiome may be facilitated by mobile genetic ele-                        chromosomal and plasmid-containing contigs, with
ments (MGEs) such as plasmids and integrons [5, 36].                        genes encoding transporter and acetyltransferase pro-
Therefore, identifying the co-localization of AR genes                      teins being the most prevalent regardless of genetic con-
and MGEs will allow a greater understanding on the                          text (Fig. 6b). For the antibiotic classes detected, the
mobilizable component of the public transit resistome.                      majority of them were detected in both chromosomal
Co-assembly and dereplication of assembled contigs                          and plasmid-containing contigs, and across all cities (Fig.
generated 243,718 non-duplicated contigs with a total of                    6c). Genes conferring resistance to nitroimidazole were
52,004 (21.3%) containing AR genetic determinants                           not detected on plasmid-containing contigs.
Leung et al. Microbiome (2021) 9:112 Page 9 of 19 Fig. 6 Public transit air resistome contained both chromosome- and plasmid-associated AR genes encoding multiple functional mechanisms of resistance to diverse antimicrobial classes. a Detection of AR genes and their genomic context (chromosomal or plasmid-based). b Histogram showing the number of contigs containing AR genes encoding genes conferring different mechanisms of resistance, faceted by genetic context in which the AR genes were detected. c Abundance data (in RPKM) of genes conferring resistances to different antibiotic classes detected across different cities and genetic contexts Metagenome-assembled genome analysis reveals city- recent work on the Moscow public transit system [38], unique coding sequences in which members of this genus were detected. Following city-based co-assembly, metagenome- Reads of each sample were mapped to the 26 MAGs assembled genomes (MAGs) were generated. Between to identify coding sequences (CDSs) in MAGs that were Denver, Hong Kong, London, New York, and Oslo, a only detected in samples from a particular city (i.e. city- total of 26 MAGs (genome completeness of ≥ 75% and unique CDSs, cuCSDs). A total of 15,523 cuCDSs from contamination of ≤ 5%) with taxonomic classification the MAGs were identified (Additional file 9: Table S5). were generated (co-assembled contigs from Stockholm The number of cuCDSs ranged from 0.06% (Oslo_ did not generate any MAGs). The MAGs encompassed bin.107 classified as Kocuria rosea) to over 78% (HKG_ diverse phyla (Additional file 9: Table S5). MAGs be- bin.6 classified as Actinobacteria bacterium DSM 45722) longing to species commonly associated with humans of all CDSs in a MAG. The cuCDSs encode broad mi- (e.g. C. acnes, Corynebacterium accolens, Micrococcus crobial functions (Additional file 10: Figure S5), with the flavus, Dermacoccus nishinomiyaensis, Roseomonas mu- breadth of functional diversity including resistance to cosa, and Kocuria species), as well as from the environ- antimicrobials and metals particularly apparent in Hong ment were detected. We also identified a MAG Kong and Oslo, possibly due to multiple MAGs each belonging to Arsenicicoccus bolidensis, consistent with a containing a high proportion of cuCDSs (e.g. HKG_bin.6
Leung et al. Microbiome      (2021) 9:112                                                                                           Page 10 of 19

and Oslo_bin.39, Additional file 9: Table S5). MAGs                        that encode non-ribosomal peptide synthetases (NRPSs)
with taxonomic affiliation commonly associated with                        and NRPS-like proteins. MAGs identified as species as-
humans presented a lower percentage of cuCDSs in their                     sociated with the human microbiota (Fig. 7, species in
genomes (e.g. C. acnes, Micrococcus flavus, Lawsonella                     red) had a lower average (non-significant difference) of
clevelandensis, Kocuria species, Dermacoccus nishino-                      BGCs compared with other MAGs identified. Bacterio-
miyaensis) compared with MAGs with presumptive en-                         cins, which have been shown to be important for com-
vironmental origins (e.g. Arsenophonus nasoniae,                           petition amongst skin colonizers [39], were detected in
Sandaracinus amylolyticus, Azorhizobium doebereinerae,                     MAGs of skin-associated bacteria including C. acnes, K.
Rubrobacter species). A large number of cuCDSs encode                      rosea, and Dermacoccus nishinomiyaensis.
yet unknown functions, suggesting that much of the geo-
graphical uniqueness in microbial functional potentials                    Discussion
remains to be understood.                                                  This large-scale and comprehensive characterization of
                                                                           the public transit air microbiome and resistome, employ-
Detection of biosynthetic gene clusters in MAGs from                       ing standardized air sampling as well as centralized sam-
public transit                                                             ple processing and bioinformatics methodologies,
Given that genes associated with the synthesis of sec-                     demonstrates a novel approach towards the
ondary metabolites were strong indicators for                              characterization and mapping of bioaerosols in the BE.
geography-based functional variations (based on Fish-                      We identified factors associated with airborne micro-
Taco), characterization of biosynthetic gene clusters                      biome composition, microbial functional, and resistance
(BGCs) in public transit air may inform us of the poten-                   profiles across public transit environments. Our analyses
tial for the expression of secondary metabolites by the                    indicated that the public transit air microbiome presents
public transit microbiome and environments in which                        geographical variations that may give rise to differences
the public transit microbiome was sourced. From the 26                     in functional potentials at both community and sub-
MAGs with species taxonomy identified in public transit                    species levels. An international study to profile the mi-
air, a total of 111 secondary metabolite BGCs were de-                     croorganisms in the air of indoor environments such as
tected, encoding proteins associated with the synthesis                    the public transit is important, because of not only the
of 20 types of metabolites (Fig. 7). The most prevalent                    potential indoor fomite-mediated and airborne transmis-
BGCs found in MAGs of different taxonomies encode                          sion of microorganisms [12, 13] but also the need to
proteins associated with the synthesis of terpenes, bacte-                 understand associations between the public transit envir-
riocins, polyketides (polyketide synthases), and those                     onment and its microbiome across geographical

 Fig. 7. MAGs within the public transit air microbiome contained a diverse collection of gene clusters encoding proteins involved in biosynthesis
 of secondary metabolites. MAGs with secondary metabolite BGCs. Species known to colonize the human skin, nasal, and urogenital tracts are
 indicated in red. Types of metabolites synthesized by BGCs in MAGs are indicated by filled tiles. The number of BGCs detected in MAGs, with bars
 coloured by type of metabolite
Leung et al. Microbiome (2021) 9:112 Page 11 of 19 locations. Such knowledge will enable scientists to in indoor air was slow if not negligible [29]. Despite its understand how building designs can potentially affect prevalence and abundance, skin-associated bacteria C. occupants’ health and well-being via changes in the pub- acnes and M. luteus appeared to be slowly replicating, lic transit microbiome on a global scale. Our mirroring the in situ results obtained for these species characterization of the public transit air microbiome from their primary habitat [28]. On the other hand, the suggests that pathogens included in the NIAID list were taxa inferred to be most active in public transit air have not present or were below the detection limit of the environmental origins by taxonomy, likely from adjacent study. However, systematic follow-up investigations with outdoor environments. Activity and cultivability of bac- increased sensitivity (e.g. quantitative PCR) can be per- teria have been demonstrated in indoor air [5], but formed to further examine the abundance of pathogens whether these taxa are actively metabolizing in public in the public transit environment. In addition, given that transit air, or whether they were active in their predom- the most abundant species in the study, C. acnes, can be inant habitats (e.g. commuter skin, soil, plants) then sus- considered an opportunistic pathogen [31], careful con- pended into public transit air, is not known and cannot siderations must be placed in future works involving bio- be deduced solely from this study. Importantly, the esti- assays and resistance testing to ascertain the risks of mated community-level growth rate showed geograph- exposure to this otherwise human commensal in public ical variations, while multiple subspecies of C. acnes and transits. M. luteus may be active within public transit air of par- As in other BEs [25, 40–43], different cities appeared ticular cities. These findings further exemplify that geo- to be associated with variations in the composition, the graphical specificities in public transit air microbiome growth profile, functional and AR potentials of the pub- extend to not only the community composition but also lic transit air microbiome. Our resistome sourcetracking the predicted species- and strain-level growth (and po- observation, where the resistome of public transit air ex- tentially metabolic) profiles. Future cultivation and hibited the greatest similarities with that of the human metatranscriptomics [46] works will be required to pro- skin and soil, reinforces the notion that the public transit vide a comprehensive assessment of growth profiles and air microbiome and resistome are predominantly gene expression of taxa in public transit air, so that they sourced from the outdoors and public transit com- can complement the in situ resistome and BGCs results muters. The high abundance of skin commensals in pub- detected in this study. lic transit air is likely the result of direct skin shedding Public transit air microbiome differences between cit- and particle re-suspension [44]. In addition, we per- ies were concomitant with functional differences at com- formed a separate sourcetracking analysis including adja- munity, particularly at species and strain levels. cent surface resistomes, as overlapping between the Geographically unique functional pathways contributed microbiomes of indoor air and nearby surface environ- by indicator species may reflect differences in functional ments has been documented [45]. We identified that ad- potentials across the public transits examined. Our ran- jacent surfaces, when considered a separate putative dom forest analysis between strains of C. acnes and M. resistome source, became the most prominent putative luteus suggests that adaptive genes may be important sources of the public transit air resistome. While indoor markers for explaining strain-level microbiome differ- surface microbiomes in urban environments are known ences in public transit air. In our indicator species and to be predominantly sourced from outdoor air and occu- MAGs analyses, the majority of geographical specificities pant skin [18, 41], our air sourcetracking results includ- arose due to genes encoding metabolic, replication, ing public transit surface resistome data did not transport, and maturation functions. However, future completely remove the contribution from skin and out- cultivation works are required to discern whether the door sources (Fig. 5). Surface microbiomes of BEs may identified metabolic functions are a reflection of incom- be sourced from environments other than those analysed plete genomes, partial reconstruction of MAGs present here [41], and could therefore contribute to surface- in the communities or a truly biological observation po- unique microbial members in the sourcetracking ana- tentially addressing the adaptive capabilities of different lysis. In any case, inclusion of surface resistomes along- public transit air microbiomes. To date, no work has side other predicted environmental and anthropogenic been conducted to assess the effects of sequencing depth sources as performed here, in combination with longitu- and/or a hybrid approach combining short- and long- dinal sampling efforts [3, 4], could help better under- read sequencing [9], on the extent to which metage- stand the flow of AR genes between adjacent nomics reads are assembled into contigs and MAGs for environments, commuters, and the public transit air. air samples. Given that this is the first study to report Our growth rate estimation results are congruent with MAGs from air metagenomes, optimization of sequen- previous works predicting bacterial growth in aircraft cing conditions in the future may allow additional dust samples in that the inferred growth of most bacteria MAGs to be reconstructed. Notwithstanding, the results
Leung et al. Microbiome   (2021) 9:112                                                                         Page 12 of 19

presented in this study reinforce the notion that geo-         processing of this class of compounds contributed to
graphical variations transcend multiple facets of micro-       geographical specificity. BGCs detected in this study in-
bial functions and physiologies.                               cluded genes associated with the synthesis of terpenes,
   Most existing works on discerning functional differ-        bacteriocins, polyketide synthases, and NRPSs, all of
ences in microbiomes do not attempt to identify linkages       which may contain antimicrobial and cell-to-cell inter-
between taxonomic and functional data [47]. By explor-         action potentials [54]. Depending on the presumptive
ing linkages of these two aspects of the public transit        sources of the BGC-containing microbes (e.g. skin, soils,
microbiome, we have identified specific taxa estimated         marine sources), the BGCs may play roles in shaping the
to drive the enrichment or attenuation of various func-        ecology of the source microbiomes [51–54]. Currently,
tional pathways that defined microbiome differences be-        there is little information regarding the repertoire of
tween the public transits examined. More importantly,          BGCs and the expression of secondary metabolites in
by combining our indicator species and FishTaco ana-           urban air. Future works should be focused on how the
lyses, both abundant (such as skin-associated bacteria C.      diversity and abundance of BGCs in the public transit
acnes and M. luteus, and environmental taxa P. stutzeri)       air can be influenced by biogeography and other human
and rare taxa played potential roles in driving functional     and building factors.
differences between public transit systems. Furthermore,
given that the identified taxa have diverse presumptive
sources (collection of human and environmental taxa), a        Conclusions
greater understanding of how occupant and adjacent             In summary, this study presented for the first time an
microbiomes feed into the public transit air microbiome        in-depth account of the microbiome and resistome of
will allow us to gain insights not only into the public        public transit air across multiple cities. The results high-
transit microbial communities from a compositional per-        light the specificities associated with the geography of
spective, but also into how the functional potentials will     public transit air microbiomes from community to strain
vary across public transits.                                   levels. In addition, public transit air is found to be a res-
   Resistome characterization has been performed previ-        ervoir of AR genes potentially sourced from commuters
ously in public BEs including public transit surfaces [7,      and the environment including adjacent public transit
16, 25, 48], and AR genes that were co-associated with         surfaces. While informative, further work is warranted in
MGEs have been characterized in dusts to understand            ascertaining the viability of the observed microbial com-
the mobilization potential of AR genes in BEs [5, 49, 50].     munities, as the detected functional potentials and resis-
We detected both chromosomal-based and MGE-based               tome will not necessarily be manifested phenotypically
AR genes across the air of all public transits examined,       in this atmospheric environment. Such information
and genes of all but one drug class (nitroimidazole only       could provide greater insights into commuter health
found in chromosomes) were detected in both chromo-            risks associated with the transmission of potential patho-
somes and near MGEs. While this is the first resistome         gens and AR across public transit environments [14, 15].
characterization of public transit air at a continental        Future works should also expand upon the current
scale, results from this study alone will not be able to as-   methods and findings to include microbiome and resis-
sess the health risks associated with the transmission of      tome data from additional cities of both developed and
resistant and pathogenic organisms in the public transit       developing countries in different climate zones so that
[5]. Subsequent works on characterizing the global pub-        comprehensive socioeconomic, clinical, and anthropo-
lic transit resistome should also focus on the phenotypic      genic factors can be included to better explain the
detection of resistance, so as to better inform building       observed microbiome differences as recently per-
and engineering experts of the health implications asso-       formed in sewage [55, 56]. Additional public transit
ciated with the dissemination of resistance in public          factors (e.g. occupancy and ridership, temperature,
transit air.                                                   humidity) should be included in correlative analyses
   There have been recent interests in detecting micro-        to extend our understanding of how different envir-
bial BGCs that encode proteins synthesizing secondary          onmental attributes shape the public transit air
metabolites (including those with antimicrobial poten-         microbiome. Longitudinal and seasonal investigations
tials) from different ecosystems [51–54]. To our under-        of public transit environments, when integrated with
standing, this is the first account of the detection of        clinical [57] and agricultural [58] microbial commu-
BGCs in BE air. The FishTaco results have identified           nity and antibiotics usage data, can broaden our un-
pathways of secondary metabolite production as among           derstanding of the roles of time, climate, urbanization
the strongest indicators for geography-based functional        rate, ethnicity, population density, and antibiotic use
variations, suggesting that the abundance variations           may play shaping the public transit air microbiome
across public transits in genes responsible for the            and resistome at local, regional, and global scales.
Leung et al. Microbiome   (2021) 9:112                                                                     Page 13 of 19

Methods                                                       Sample processing and sequencing
Air sample collection                                         All air samples were shipped on dry ice to a single loca-
A total of 259 public transit air samples were collected      tion (Norwegian Defence Research Establishment FFI,
in Denver (n = 30), Hong Kong (n = 80), London (n =           Kjeller, Norway) for processing and DNA isolation ac-
30), New York (n = 29), Oslo (n = 64), and Stockholm          cording to a previously described protocol [59]. Briefly,
(n = 26) from June to September 2017 (Additional file         filter-collected particulates were extracted into liquid
11: Table S6). Samples from Denver were collected in          using NucliSENS Lysis Buffer (10 ml, BioMérieux,
the city’s rail and bus system, while samples from the        Marcy-l’Étoile, France), and pelleted by centrifugation
other cities were from subway systems. All samples were       (7000×g, 30 min). The resulting supernatant and pellet
collected during weekdays and within working hours            fractions were intermediately separated. The pellet was
(where the occupancy was typical of a working day). Sta-      subjected to additional lysis steps including enzymatic
tions were selected based on varying geographical prop-       lysis (35 °C, 1 h) with a multi-enzyme cocktail (0.3 mg/
erties/contexts (e.g. proximity to coastline, elevation)      ml, MetaPolyzyme, Sigma-Aldrich, St. Louis, MO, USA),
and building characteristics (e.g. number of transit con-     followed by mechanical lysis involving bead beating
nections at a station, indoor/outdoor stations, above-        (max intensity, 3 min) in a Mini Bead Beater-8 (BioSpec
ground/underground stations). A detailed description of       Products, Bartlesville, OK, USA) using ZR BashingBead
how the number of transit connections at a station was        Lysis Tubes (0.1/0.5-mm beads, Zymo Research, Irvine,
defined is provided below. Air samples were collected         CA, USA) filled with PowerBead Solution and Solution
with SASS 3100 Dry Air Samplers (Research Inter-              C1 (550 and 60 μl, respectively, Qiagen, Hilden,
national, Monroe, WA, USA) for 30 min at a flowrate of        Germany). Bead tubes were centrifuged (13,000×g, 2
300 L/min using electret microfibrous filters. Air sam-       min) and inhibitors were removed from the lysate with
plers were mounted on a tripod with the inlet ~ 1.5 m         Solution C2 (250 μl) and C3 (200 μl) according to the
above floor level and facing downward (45°) to avoid dir-     Dneasy PowerSoil protocol (Qiagen). The lysed pellet
ect deposition of large particles. Air filters were immedi-   sample was recombined with the original supernatant
ately placed into sterile 50-ml conical centrifuge tubes      fraction and DNA isolated according to the manual
and stored at − 80 °C after each collection day. Field        protocol of the NucliSENS Magnetic Extraction Re-
negative control samples (Additional file 11: Table S6)       agents kit (BioMérieux) with two modifications; mag-
were generated by placing a new filter on the air sampler     netic silica suspension volume was increased to 90 μl
at the sampling locations and removing it without oper-       and incubation time was increased to 20 min. Eight re-
ating the sampler. Laboratory control samples (Add-           agent (samples that had gone through the DNA extrac-
itional file 11: Table S6) were generated by placing a        tion process but not the sampling and filter extraction
piece of a new filter directly in 10 ml lysis buffer before   process), laboratory, and field negative controls and two
the filter extraction process.                                positive controls (10 μl, ZymoBIOMICS Microbial Com-
                                                              munity Standard, Zymo Research) were included and
Criteria for defining the number of transit connections at    processed in parallel with the air samples. The DNA
a station                                                     samples were quantified on a Qubit 3.0 Fluorometer
The number of transit connections was a cumulative            (Thermo Fischer Scientific, Waltham, MA, USA) using
score based on the following criteria: every subway line      Qubit dsDNA HS assays (Thermo Fischer Scientific). All
in and/or out of a station was counted as one transit         DNA samples were shipped on dry ice to the HudsonAl-
connection; every train station where an interchange to/      pha Genome Center (Huntsville, AL, USA) for library
from a subway station was logical was counted as a tran-      preparation and paired-end 150-bp shotgun sequencing
sit connection (i.e. the closest subway station and rea-      according to a previously described protocol [16, 25].
sonable walking distance); every bus station (defined as
an allocated space for buses and closed for other traffic     Sequence quality control; taxonomic, functional, and
where several bus lines runs from) where an interchange       resistome classification; growth rate inference; and
to/from a subway station was logical, counted as one          identification of contaminating taxa
transit connection; interchange indicated on the subway       Adapters were removed from raw sequences using
map between nearby stations, which served different           AdapterRemoval (v2.2.2) [60], and quality-filtered using
lines, was counted as one connection (regardless of how       Kneaddata (https://huttenhower.sph.harvard.edu/
many lines ran through the nearby station); if a subway       kneaddata/) with default parameters, using the human
line had several different end stations, this was             genome hg38 and phiX as references to remove human
accounted for as it increased the connections to/from         and phiX DNA sequences [17]. MetaPhlAn2 (v.2.6.0)
the station (e.g. a line with two different end station       [61] was used to provide species-level taxonomic infor-
counted as two lines).                                        mation to short reads. Based on the MetaPhlAn2
Leung et al. Microbiome (2021) 9:112 Page 14 of 19 taxonomic classification, the prevalence option and approach) using SMEG (v1.1.1) [68]. Default settings stringent mode of decontam [62] (Oct 2018 release) were applied for both inference tools. GRiD and SMEG were used to identify potential contaminating species. values indicate the ori to ter coverage ratio for a given Four taxa, Stenotrophomonas maltophilia, Streptomyces species or strain, respectively. albus, Afipia broomeae, and another unidentified species of Afipia, were identified as potential contaminants Alpha- and beta-diversity analysis (Additional file 12: Figure S6). With the exception of S. Clean sequences were rarefied to 316,994 reads per sam- maltophilia, the relative abundance of each of the three ple using the “seqtk” tool (v.1.3-r106) [69] for taxonomic species was < 0.05% across the experimental samples, alpha-diversity analysis. The rarefaction depth corre- and they were deemed negligible to warrant removal in sponded to the sample with the lowest number of reads. experimental samples. S. maltophilia, however, had an Taxonomic richness was calculated as the number of average relative abundance of 77.1% in the negative con- species identified in a sample, and abundance-based trols, and was abundant in all experimental samples. As Shannon diversity index was calculated using the func- a result, co-assembly, binning, and bin refinement were tion “diversity” in R package “vegan” (v2.5.3). The signifi- performed for eight negative controls using MetaWRAP cance of different factors (i.e. city) on the alpha-diversity [63], resulting in one Xanthomonadaceae MAG (> 99.5% of public transit air microbiomes was determined using completeness, < 0.05% contamination), a classification the function “lmer” in R package “lme4” (v.1.1-21). Mul- consistent with S. maltophilia. The bin was used as a tiple samples were collected at each subway station custom reference to remove reads belonging to the po- (Additional file 11: Table S6) to account for temporal tential contaminant (S. maltophilia) from the entire and stochastic variability. Public transit station was thus dataset using Kneaddata. Other species-level taxa were included as a random effect in the alpha-diversity ana- also detected in the negative control samples (average lysis to account for the effect of pseudoreplication, and relative abundance of 0.06% to 9.5%) (Additional file 12: for the unequal number of samples among stations. The Figure S6). However, these taxa were not considered alpha-diversity post hoc comparisons on city pairings contaminants according to decontam and were retained were studied using the “emmeans” function in R package for downstream analyses. Following quality control and “emmeans” (v.1.4.4). The marginal coefficient of deter- human and contamination read removal, a total of 9.5 × mination (R2), which computes only the variance of fixed 1010 bases (average 3.7 × 10⁸ ± 1.2 × 10⁸ bases per sam- factors explained in the linear mixed model, was calcu- ple) or 6.8 × 10⁸ reads (average 2.6 × 10⁶ ± 9.0 × 10⁵ lated using the r.squaredGLMM function in the R pack- reads per sample) were generated for the entire dataset. age “MuMIn” (v.1.43.15). MetaPhlAn2 was repeated on the retained clean se- Bray-Curtis dissimilarity and Jaccard distance were cal- quences for taxonomic classification. Taxonomic classifi- culated for the taxonomic composition, functional po- cation was also performed using Kraken (v2.0.7-beta) tentials, and resistance profiles of the public transit air [64] and Bracken (v2.5) [65]. The relative abundances of microbiome using the function “vegdist” in the R pack- major species C. acnes and M. luteus were highly con- age “vegan.” Regardless of whether rarefaction was ap- gruent between the two classification methods (C. acnes: plied, significant differences in public transit air Pearson’s correlation = 0.819, p = 4.97 × 10−64; M. microbiomes among cities were detected (Additional file luteus: Pearson’s correlation = 0.951, p = 1.22 × 10−133). 13: Figure S7), indicating that the rarefaction depth The two classification methods also did not affect the in- adopted was sufficient [70]. In addition, the choice of terpretation of geographical variations in the overall taxonomic classification tool did not change the inter- community composition (see below). Given the recent pretation of microbiome differences across cities, as geo- use of MetaPhlAn2 for another study on urban air graphical factor was still significant in explaining microbiomes [49], we decided to adopt MetaPhlAn2 as community compositional differences based on Bracken the classification method for this work. HUMAnN2 classification (non-rarefied PERMANOVA F-value = (v0.11.1) [66] and ShortBRED (v.0.9.5) [33] were used to 25.53, R2 = 0.28, rarefied PERMANOVA F-value = profile the functional and resistance potentials of meta- 18.29, R2 = 0.25, both p = 0.005). The significance of genomes, respectively. The Comprehensive Antibiotic community clustering based on MetaPhlAn2, Resistance Database (CARD, mid-2017 release) [67] was HUMAnN2, and ShortBRED data by public transit net- employed as the reference database to detect and iden- works and environmental factors was tested using the tify AR protein families. The core taxa and resistance function “adonis.II” in R package “RVAideMemoire” protein families were defined as those present in ≥ 75% (v0.9-74). In addition, pairwise PERMANOVA compari- of the dataset. Species-level growth rates were inferred sons between cities were computed using the function using GRiD (v1.3) [28], and growth rates were inferred “pairwise.perm.manova” in “RVAideMemoire” for both for strains of C. acnes and M. luteus (using a SNP-based the community and resistome data. Given the repeated
Leung et al. Microbiome   (2021) 9:112                                                                        Page 15 of 19

sampling at individual public transit stations, a nested      diversity, while a function contributed equally by mul-
design with restricted permutations was performed to          tiple species would result in a high within-sample contri-
account for pseudoreplication, with factors such as city,     butional diversity (complex). If a function is contributed
Julian day, transit connections, indoor vs. outdoor,          proportionally by the same groups of species across sam-
aboveground vs. underground, and latitude included as         ples, it would result in a low (conserved) between-
fixed effects in the nested model. To eliminate the im-       sample contributional diversity. On the other hand, a
balance caused by an unequal number of samples be-            function contributed by different groups of species
tween sampling locations, two samples were randomly           would result in a high (variable) between-sample contri-
selected from each location. This resulted in 70 locations    butional diversity. For each function, the mean within-
from six cities comprising 140 samples that were in-          sample and between-sample contributional diversity
cluded in the final statistical analysis.                     were calculated respectively.
   The indicator value index of taxonomy (i.e. species),
function (i.e. KOs), and resistance (i.e. AR protein fam-     Identification of taxonomic drivers of functional shifts
ilies) of public transit air microbiomes were determined      To identify taxa driving the observed microbial func-
using the “multipatt” function in R package “indicspe-        tional differences between cities, FishTaco (v1.1.3,
cies” (v.1.6.7) [71] with 999 permutational tests. Species,   single-taxa mode) was employed using default settings,
KOs, and AR protein families that were associated with        with the addition of the “-inf” option to infer the gen-
one particular city or groups of cities with sensitivity      omic content of taxa detected [32]. For each city, enrich-
and specificity both > 90% were defined as strong             ment of functions and identification of taxa driving the
indicators.                                                   functional shifts associated with that city (e.g. sample
                                                              groups were divided into Denver vs. non-Denver sam-
Strain-level single nucleotide variant                        ples to observe taxa driving functional changes associ-
Reads assigned to C. acnes and M. luteus, the two most        ated with Denver) were performed. Species-level taxa
abundant species of the public transit microbiome as          with an average relative abundance of ≤ 0.1% according
identified by MetaPhlAn2, were included for strain-level      to MetaPhlAn2 and KOs with abundance of ≤ 5 RPKM
analysis by examining single-nucleotide polymorphisms         according to HUMAnN2 were excluded from these
using StrainPhlAn [72] with the option “relaxed_param-        analyses.
eters3”. The strain-level phylogenetic trees were con-
structed using the R package “ggtree” (v.2.0.1).              Bayesian sourcetracking of microbiomes and resistomes
PanPhlAn (v.1.2.2.3) [73] was used to compare gene            A total of 182 metagenomic datasets were used as the
content differences between strains of C. acnes and M.        potential resistome sources of AR genes detected in pub-
luteus using the very sensitive mode (--min_coverage 1        lic transit air (Additional file 14: Table S7). These source
--left_max 1.70 --right_min 0.30). Jaccard distances were     samples were chosen to cover diverse ecotypes including
calculated between sample-pairs based on the gene-            gut, skin, and oral cavity from healthy human individ-
content output of PanPhlAn, and principal coordinates         uals, animal faeces, soil, wastewater-activated sludge,
analysis plots were generated to visualize geography-         and marine water/sediments. In addition, 16 datasets
based strain-level gene repertoire differences between        from a parallel shotgun metagenomics study of public
cities. Centroid sequences for each reference species         transit surfaces in each of the same cities [25] (a total of
were subjected to Random Forest analysis using the R          96 surface datasets from the six cities) were included to
package “randomForest” (v.4.6-14) [74] to identify geo-       represent the public transit surface resistome. With the
graphically specific markers for strain differentiation       exception of the marine dataset, 24–30 samples from
within the two species. Identified markers were sub-          each source type were selected equally from the three
jected to EggNOG-mapper (v.4.5.1) [75] to convert             continents (Asia, Europe, and North America). This was
markers to KO families.                                       performed to account for any potential geography-based
                                                              heterogeneity in the source resistomes and the resistome
Functional contributional diversity analysis for              data from different geographical locations were com-
geographically specific core metabolic pathways               bined as one representative global ecotype source. Also,
Within-sample and between-sample diversity were cal-          given the dynamic nature of seawater, 31 marine sam-
culated using the Gini-Simpson index and Bray-Curtis          ples were chosen worldwide to potentially reduce re-
dissimilarity metric by the function “diversity” in R pack-   gional biases. Raw sequences in .fastq format were
age “diverse” (v.0.1.5) and the function “vegdist” in R       retrieved from public databases including NCBI and
package “vegan”, respectively. Within a sample, a func-       MG-RAST. Quality filtering, taxonomic, and resistome
tional pathway contributed by a single species would re-      profiles of the source datasets were processed using the
sult in a low (simple) within-sample contributional           same methods as described above. Representative
You can also read


