CHILE CLIMATE RISK COUNTRY PROFILE
←
→
Page content transcription
If your browser does not render page correctly, please read the page content below
CLIMATE RISK COUNTRY PROFILE

          CHILE
COPYRIGHT
© 2021 by the World Bank Group
1818 H Street NW, Washington, DC 20433
Telephone: 202-473-1000; Internet: www.worldbank.org

This work is a product of the staff of the World Bank Group (WBG) and with external contributions. The opinions, findings,
interpretations, and conclusions expressed in this work are those of the authors and do not necessarily reflect the views or the
official policy or position of the WBG, its Board of Executive Directors, or the governments it represents.

The WBG does not guarantee the accuracy of the data included in this work and do not make any warranty, express or implied,
nor assume any liability or responsibility for any consequence of their use. This publication follows the WBG’s practice in
references to member designations, borders, and maps. The boundaries, colors, denominations, and other information shown
on any map in this work, or the use of the term “country” do not imply any judgment on the part of the WBG, its Boards, or the
governments it represents, concerning the legal status of any territory or geographic area or the endorsement or acceptance
of such boundaries.

The mention of any specific companies or products of manufacturers does not imply that they are endorsed or recommended
by the WBG in preference to others of a similar nature that are not mentioned.

RIGHTS AND PERMISSIONS
The material in this work is subject to copyright. Because the WBG encourages dissemination of its knowledge, this work may
be reproduced, in whole or in part, for noncommercial purposes as long as full attribution to this work is given.

Please cite the work as follows: Climate Risk Profile: Chile (2021): The World Bank Group.

Any queries on rights and licenses, including subsidiary rights, should be addressed to World Bank Publications, The World Bank
Group, 1818 H Street NW, Washington, DC 20433, USA; fax: 202-522-2625; e-mail: pubrights@worldbank.org.

Cover Photos: © Mariano Mantel, “Montañas del altiplano” Marc 29, 2014 via Flickr, Creative Commons CC BY-NC-ND 2.0.
© Ieosoueu, “Sky Costanera, Santiago, Chile” January 1, 2018 via Flickr, Creative Commons CC BY-NCND 2.0.

Graphic Design: Circle Graphics, Inc., Reisterstown, MD.

CLIMATE RISK COUNTRY PROFILE: CHILE                                                                                           ii
ACKNOWLEDGEMENTS
This profile is part of a series of Climate Risk Country Profiles developed by the World Bank Group (WBG). The country profile
synthesizes most relevant data and information on climate change, disaster risk reduction, and adaptation actions and policies
at the country level. The country profile series are designed as a quick reference source for development practitioners to better
integrate climate resilience in development planning and policy making. This effort is managed and led by Veronique Morin
(Senior Climate Change Specialist, WBG) and Ana E. Bucher (Senior Climate Change Specialist, WBG).

The Chile profile was written by Andrea Cristina Ruiz (Climate Change Consultant, WBG) and MacKenzie Dove (Senior Climate
Change Consultant, WBG). Additional support was provided by provided by Jason Johnston (Operations Analyst, WBG) and
Yunziyi Lang (Climate Change Analyst, WBG).

Climate and climate-related information is largely drawn from the Climate Change Knowledge Portal (CCKP), a WBG online
platform with available global climate data and analysis based on the latest Intergovernmental Panel on Climate Change (IPCC)
reports and datasets. The team is grateful for all comments and suggestions received from the sector, regional, and country
development specialists, as well as climate research scientists and institutions for their advice and guidance on use of climate
related datasets.

CLIMATE RISK COUNTRY PROFILE: CHILE                                                                                           iii
CONTENTS

FOREWORD  .  .  .  .  .  .  .  .  .  .  .  .  .  .  .  .  .  .  .  .  .  .  .  .  .  .  .  .  .  .  .  .  .  .  .  . 1

COUNTRY OVERVIEW .   .   .   .   .   .   .   .   .   .   .   .   .   .   .   .   .   .   .   .   .   .   .   .   .   .   .   .   .   .   .  2

CLIMATOLOGY  .   .   .   .   .   .   .   .   .   .   .   .   .   .   .   .   .   .   .   .   .   .   .   .   .   .   .   .   .   .   .   .   .   .   5
   Climate Baseline .  .  .  .  .  .  .  .  .  .  .  .  .  .  .  .  .  .  .  .  .  .  .  .  .  .  .  .  .  .  .  .  .  .  .  .  .  .  .  . 5
      Overview  .  .  .  .  .  .  .  .  .  .  .  .  .  .  .  .  .  .  .  .  .  .  .  .  .  .  .  .  .  .  .  .  .  .  .  .  .  .  .  .  .  . 5
      Key Trends .  .  .  .  .  .  .  .  .  .  .  .  .  .  .  .  .  .  .  .  .  .  .  .  .  .  .  .  .  .  .  .  .  .  .  .  .  .  .  .  . 7
   Climate Future .  .  .  .  .  .  .  .  .  .  .  .  .  .  .  .  .  .  .  .  .  .  .  .  .  .  .  .  .  .  .  .  .  .  .  .  .  .  .  .  . 8
      Overview  .  .  .  .  .  .  .  .  .  .  .  .  .  .  .  .  .  .  .  .  .  .  .  .  .  .  .  .  .  .  .  .  .  .  .  .  .  .  .  .  .  . 8
      Key Trends .  .  .  .  .  .  .  .  .  .  .  .  .  .  .  .  .  .  .  .  .  .  .  .  .  .  .  .  .  .  .  .  .  .  .  .  .  .  .  .  . 10

CLIMATE RELATED NATURAL HAZARDS .   .   .   .   .   .   .   .   .   .   .   .   .   .   .   .   .   .   .   .   .   . 11
   Overview .  .  .  .  .  .  .  .  .  .  .  .  .  .  .  .  .  .  .  .  .  .  .  .  .  .  .  .  .  .  .  .  .  .  .  .  .  .  .  .  .  .  . 11
   Key Trends .  .  .  .  .  .  .  .  .  .  .  .  .  .  .  .  .  .  .  .  .  .  .  .  .  .  .  .  .  .  .  .  .  .  .  .  .  .  .  .  .  . 13
   Implications for DRM .  .  .  .  .  .  .  .  .  .  .  .  .  .  .  .  .  .  .  .  .  .  .  .  .  .  .  .  .  .  .  .  .  .  .  .  .  . 14

CLIMATE CHANGE IMPACTS TO KEY SECTORS .   .   .   .   .   .   .   .   .   .   .   .   .   .   .   .   .   .   . 15
   Agriculture  .  .  .  .  .  .  .  .  .  .  .  .  .  .  .  .  .  .  .  .  .  .  .  .  .  .  .  .  .  .  .  .  .  .  .  .  .  .  .  .  .  . 15
   Water  .  .  .  .  .  .  .  .  .  .  .  .  .  .  .  .  .  .  .  .  .  .  .  .  .  .  .  .  .  .  .  .  .  .  .  .  .  .  .  .  .  .  .  . 18
   Energy  .  .  .  .  .  .  .  .  .  .  .  .  .  .  .  .  .  .  .  .  .  .  .  .  .  .  .  .  .  .  .  .  .  .  .  .  .  .  .  .  .  .  .  . 21
   Health .  .  .  .  .  .  .  .  .  .  .  .  .  .  .  .  .  .  .  .  .  .  .  .  .  .  .  .  .  .  .  .  .  .  .  .  .  .  .  .  .  .  .  . 24
   Coastal Zones .  .  .  .  .  .  .  .  .  .  .  .  .  .  .  .  .  .  .  .  .  .  .  .  .  .  .  .  .  .  .  .  .  .  .  .  .  .  .  . 26

ADAPTATION .   .   .   .   .   .   .   .   .   .   .   .   .   .   .   .   .   .   .   .   .   .   .   .   .   .   .   .   .   .   .   .   .   .   . 28
   Institutional Framework for Adaptation .  .  .  .  .  .  .  .  .  .  .  .  .  .  .  .  .  .  .  .  .  .  .  .  .  .  .  .  . 28
   Policy Framework for Adaptation  .  .  .  .  .  .  .  .  .  .  .  .  .  .  .  .  .  .  .  .  .  .  .  .  .  .  .  .  .  .  .  . 29
   Recommendations .  .  .  .  .  .  .  .  .  .  .  .  .  .  .  .  .  .  .  .  .  .  .  .  .  .  .  .  .  .  .  .  .  .  .  .  .  . 30
      Research Gaps .  .  .  .  .  .  .  .  .  .  .  .  .  .  .  .  .  .  .  .  .  .  .  .  .  .  .  .  .  .  .  .  .  .  .  .  .  .  . 30
      Data and Information Gaps .  .  .  .  .  .  .  .  .  .  .  .  .  .  .  .  .  .  .  .  .  .  .  .  .  .  .  .  .  .  .  .  .  . 31
      Institutional Gaps  .  .  .  .  .  .  .  .  .  .  .  .  .  .  .  .  .  .  .  .  .  .  .  .  .  .  .  .  .  .  .  .  .  .  .  .  .  . 31

CLIMATE RISK COUNTRY PROFILE: CHILE                                                                                                                  iv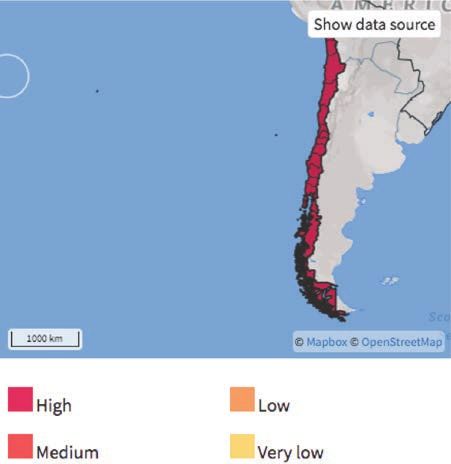
FOREWORD

Climate change is a major risk to good development outcomes, and the World Bank Group is committed to playing
an important role in helping countries integrate climate action into their core development agendas. The World
Bank Group is committed to supporting client countries to invest in and build a low-carbon, climate-resilient future,
helping them to be better prepared to adapt to current and future climate impacts.

The World Bank Group is investing in incorporating and systematically managing climate risks in development
operations through its individual corporate commitments.

A key aspect of the World Bank Group’s Action Plan on Adaptation and Resilience (2019) is to help countries
shift from addressing adaptation as an incremental cost and isolated investment to systematically incorporating
climate risks and opportunities at every phase of policy planning, investment design, implementation and evaluation
of development outcomes. For all IDA and IBRD operations, climate and disaster risk screening is one of the
mandatory corporate climate commitments. This is supported by the Bank Group’s Climate and Disaster Risk
Screening Tool which enables all Bank staff to assess short- and long-term climate and disaster risks in operations
and national or sectoral planning processes. This screening tool draws up-to-date and relevant information from
the World Bank’s Climate Change Knowledge Portal, a comprehensive online ‘one-stop shop’ for global, regional,
and country data related to climate change and development.

Recognizing the value of consistent, easy-to-use technical resources for client countries as well as to support
respective internal climate risk assessment and adaptation planning processes, the World Bank Group’s Climate
Change Group has developed this content. Standardizing and pooling expertise facilitates the World Bank Group in
conducting initial assessments of climate risks and opportunities across sectors within a country, within institutional
portfolios across regions, and acts as a global resource for development practitioners.

For developing countries, the climate risk profiles are intended to serve as public goods to facilitate upstream
country diagnostics, policy dialogue, and strategic planning by providing comprehensive overviews of trends
and projected changes in key climate parameters, sector-specific implications, relevant policies and programs,
adaptation priorities and opportunities for further actions.

It is my hope that these efforts will spur deepening of long-term risk management in developing countries and our
engagement in supporting climate change adaptation planning at operational levels.

Bernice Van Bronkhorst
Global Director
Climate Change Group (CCG)
The World Bank Group (WBG)

CLIMATE RISK COUNTRY PROFILE: CHILE                                                                                  1
COUNTRY OVERVIEW

C
        hile is located in western South America, with a
        total land area of 2,006,096 square kilometers                         FIGURE 1.  Elevation of Chile3
        (km2) and is neighbored by Peru to the north,
Bolivia to the northeast, Argentina to the east and
south, and the Pacific Ocean, with coasts that extend
over 8,000 km. Chile experiences a wide-ranging
topography (Figure 1) and its area extends across the
western and southern part of South America, spreads
in to the oceanic region via Easter Island, and extends
south towards Antarctica. Chile’s has four macro-
bioclimates: tropical, Mediterranean, temperate, and
antiborealis, which are produced primarily due to the
country’s latitude and altitude. Within these climates
are a diverse 127 terrestrial ecosystems, with 96 marine
ecosystems along the country’s coast.1 Chile experiences
mostly dry southern hemisphere summers (November
and January) and wet winters (May and August). 29.21%
of the land area does not have vegetation, 38.74%
of the land is grassland and scrub, 25.55% is forest,
4.57% is agricultural land; only 0.75% of the Chile’s
area is urban or industrial.2

Chile is a high-income country and has been one of
Latin America’s fastest growing economies over recent
decades.4 Chile has a population of 19.1 million people
(2020) that has been growing at a rate of 0.9%. 89.7%
of the population lives in urban areas concentrated in the
center of the country near the capital city of Santiago,
which is home to 40.1% of urban population. It is one of three Latin American countries that are members of the
Organization for Economic Cooperation and Development (OECD),5 with a Gross Domestic Product (GDP) of
$252.94 billion and growth rate of 1.1% in 2019. In 2020, GDP contracted 6.0% and more than one million jobs
were lost, affecting mostly women and workers in commerce, agriculture, and hospitality, further undermining the
country’s fragile middle class. In conjunction with the economic contraction, the fiscal deficit increased to 7.5% of

1
    Chile (2016). Third National Communication to the UNFCCC. URL: https://unfccc.int/sites/default/files/resource/NC3%20Chile_
    19%20December%202016.pdf
2
    Ministerio de Agricultura (2020). Anuario Forestal. Chilean Statistical Yearbook of Forestry 2020. URL: https://wef.infor.cl/publicaciones/
    anuario/2020/Anuario2020.pdf
3
    World Bank (2021). Climate Migration Profile – Chile.
4
    World Bank (2021). Overview – Chile. URL: https://www.worldbank.org/en/country/chile/overview
5
    Merco Press (2020). Costa Rica becomes 38th Member of OECD. [May 19, 2020]. URL: https://en.mercopress.com/2020/05/19/
    costa-rica-becomes-38th-member-of-oecd

CLIMATE RISK COUNTRY PROFILE: CHILE                                                                                                           2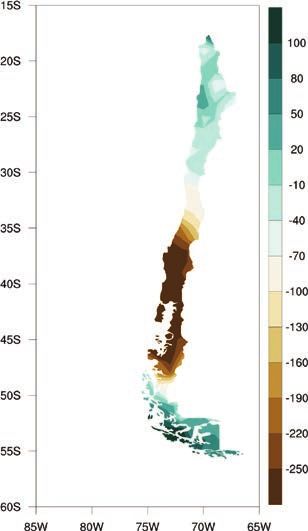
GDP in 2020, the largest in over three decades. Although the authorities tapped into fiscal buffers, public debt rose
from 28% in 2019 to 33% in 2020. Poverty is expected to have increased from 8.1% to 12%, with approximately
an additional 780,000 people expected to have fallen into poverty during this time.6

Chile is primarily a service economy, as of 2020, services producing 56.5% of value added as a percentage of GDP
and 68.8% of employment.7 Industry, mainly represented by mining, provides 31.4% value added as a percentage of
GDP and 22.8% of employment. Agriculture contributes 3.9% of value added as a percentage of GDP and 9.6% of
employment. Growth in recent years has been driven by commodity markets, primarily mining activity.8 In 2019, total
natural resource rents represented 2.3% of GDP, of which mineral rents was the largest natural resource, comprising
9.82% of GDP (Table 1). Despite economic growth and the country’s strong poverty reduction efforts, more than
30% of the population is recognized as economically vulnerable and the country’s inequality remains high.9

TABLE 1.  Data Snapshot: Key Development Indicators10

     Indicator
     Life Expectancy at Birth, Total (Years) (2019)                                        80.2
     Population Density (People per sq. km Land Area) (2018)                               25.2
     % of Population with Access to Electricity (2019)                                    100%
     GDP per Capita (Current US$) (2020)                                             $13,231.70

The ND-GAIN Index11 ranks 181 countries using a score which calculates a country’s vulnerability to climate change
and other global challenges as well as their readiness to improve resilience. This Index aims to help businesses
and the public sector better identify vulnerability and readiness in order to better prioritize investment for more
efficient responses to global challenges. Due to a combination of political, geographic, and social factors,
Chile is recognized as vulnerable to climate change impacts, and overall, is ranked 29th out of 181 countries in the
2020 ND-GAIN Index. Within the Index, Chile is also ranked 22nd in terms of vulnerability and 36th in terms of
readiness. The more vulnerable a country is the lower their score, while the more ready a country is to improve its
resilience the higher it will be. Norway has the highest score and is ranked 1st. Figure 2 is a time-series plot of
the ND-GAIN Index showing Chile’s progress in relation to the two other Latin American countries that are also
OECD members, Costa Rica and Mexico.

6
      World Bank (2021). Overview – Chile. URL: https://www.worldbank.org/en/country/chile/overview
7
      World Bank (2021). World Development Indicators. DataBank. URL: https://databank.worldbank.org/source/world-development-
      indicators
8
      World Bank Open Data (2021). Data Bank: Population Estimates and Projections, Chile. URL: https://databank.worldbank.org/data/
      reports.aspx?source=health-nutrition-and-population-statistics:-population-estimates-and-projections
9
      World Bank (2021). Overview – Chile. URL: https://www.worldbank.org/en/country/chile/overview
10
      World Bank (2021). DataBank – World Development Indicators. URL: https://databank.worldbank.org/source/world-development-
      indicators
11
      University of Notre Dame (2020). Notre Dame Global Adaptation Initiative. URL: https://gain.nd.edu/our-work/country-index/

CLIMATE RISK COUNTRY PROFILE: CHILE                                                                                                3
FIGURE 2.  ND-GAIN Index for Chile
         64
         62
         60
         58
         56
         54
Score

         52
         50
         48
         46
         44
         42
         40
          1995 1997 1999 2001 2003 2005 2009 2011 2013 2015 2017
                 Chile         Costa Rica          Mexico

Chile is highly vulnerable to the impacts of climate change, with key sectors such as fisheries and aquaculture,
forestry, agriculture and livestock, and the country’s water resources identified as vulnerable sectors.12 Chile’s Third
National Communication on Climate Change (NC3) (2016) also includes energy, infrastructure, cities, and tourism
as additional important sections.13 Chile submitted its Initial Nationally Determined Contribution in 2015 and its
Updated Nationally Determined Contribution (NDC) in 2020. Through these documents, Chile has confirmed
its commitment to climate actions and support to international climate agreements and identified key mitigation
and adaptation efforts. Chile is also working to increase the country’s resilience by improving water management
and sanitation, and its disaster risk management, identified through its National Climate Change Adaptation Plan
(2014). Chile’s Updated NDC highlights sectoral plans for key sectors, identifying financing sources to implement
sectoral plans, build synergies between adaptation and mitigation, strengthen institutional capacity on adaptation,
and prepare metrics to evaluate sectoral planning.14

Green, Inclusive and Resilient Recovery
The coronavirus disease (COVID-19) pandemic has led to unprecedented adverse social and economic impacts.
Further, the pandemic has demonstrated the compounding impacts of adding yet another shock on top of the multiple
challenges that vulnerable populations already face in day-to-day life, with the potential to create devastating health,
social, economic and environmental crises that can leave a deep, long-lasting mark. However, as governments
take urgent action and lay the foundations for their financial, economic, and social recovery, they have a unique
opportunity to create economies that are more sustainable, inclusive and resilient. Short and long-term recovery
efforts should prioritize investments that boost jobs and economic activity; have positive impacts on human, social
and natural capital; protect biodiversity and ecosystems services; boost resilience; and advance the decarbonization
of economies.

12
        Chile (2020). Nationally-Determined Contribution – Updated 2020. URL: https://www4.unfccc.int/sites/ndcstaging/PublishedDocuments/
        Chile%20First/Chile%27s_NDC_2020_english.pdf
13
        Chile (2016). Third National Communication to the UNFCCC. URL: https://unfccc.int/sites/default/files/resource/NC3%20Chile_
        19%20December%202016.pdf
14
        Chile (2020). Nationally-Determined Contribution – Updated 2020. URL: https://www4.unfccc.int/sites/ndcstaging/PublishedDocuments/
        Chile%20First/Chile%27s_NDC_2020_english.pdf

CLIMATE RISK COUNTRY PROFILE: CHILE                                                                                                     4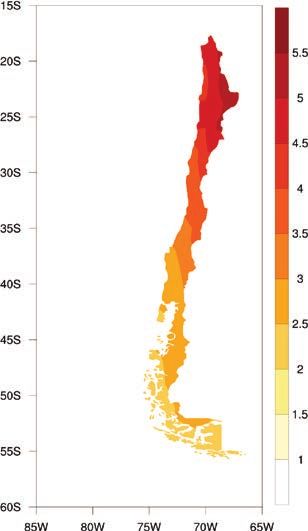
CLIMATOLOGY

Climate Baseline
Overview
Chile’s unique geography and topographical features result in a wide range of climates and environments. Chile
has the Atacama Desert in the north, one of the most arid deserts in the world, the ice-capped Andes mountains in
the east, the Pacific Ocean on the west, and Antarctic region in the south. Thus, Chile’s unique climate zones range
from tropical in the north, Mediterranean in the center, and Antarctic (antiboreal oceanic) in the South, with unique
regional climates such as the arid Atacama Desert or the high peaks of the Andean mountains.

On average, Chile experiences mild southern hemispheric summers between November and January, with mean annual
temperatures of 10°C–12°C, and wet winters between May and August, with precipitation of 72 millimeters (mm)
to 90 mm per month.15 Chile’s climate is primarily influenced by the El Niño Southern Oscillation (ENSO), Pacific
Decadal Oscillation (PDO), and the Antarctic Oscillation (AAO). In Chile, years with ENSO have higher probability of
precipitation; together with PDO, ENSO considerably affects snow accumulation and mountain flow regimes.16 The
Andean mountains influence precipitation patterns across the country, affecting both temperature and precipitation.
Chile’s extensive coast benefits from upwelling, the movement of dense, cool, and nutrient rich water to the surface,
is also influenced by wind and ocean temperature patterns.17

Temperatures in Chile vary depending on latitude and altitude, with higher temperatures occurring during southern
summer months (November-February). Temperatures tend to be lower in areas with high elevations and close to
the Antarctic south and warmer in areas with tropical climates. Precipitation follows a seasonal pattern; most
precipitation occurs during winter and more arid conditions are experienced in the summer. Some areas, such as
the Atacama Desert, seldom receive rainfall, often during winter months. Southern areas have more precipitation,
primarily during the southern winter. In the central region, near Santiago, there is a large range in precipitation with
most of the precipitation falling during May and July and almost no precipitation between October and March. The
country is highly vulnerable to climate change as its long coastline is exposed to sea level rise, with historically
high exposure to natural disasters, drought-prone areas, mountain glaciers and river systems affected by rising
temperatures, forests and fragile ecosystems. Additionally, several sectors and industries remain closely tied to
changes in ocean and environmental health.

15
     WBG Climate Change Knowledge Portal (CCKP, 2021). Chile – Historical Data. URL: https://climateknowledgeportal.worldbank.org/
     country/chile/climate-data-historical
16
     Chile (2016). Third National Communication to the UNFCCC. URL: https://unfccc.int/sites/default/files/resource/NC3%20Chile_
     19%20December%202016.pdf
17
     Kämpf, J. and Piers C. (2016). The Peruvian-Chilean Coastal Upwelling System. Chapter 5. Upwelling Systems of the World. Springer,
     Cham, 2016. 161–201. Web. URL: https://link.springer.com/content/pdf/10.1007%2F978-3-319-42524-5_5.pdf

CLIMATE RISK COUNTRY PROFILE: CHILE                                                                                                  5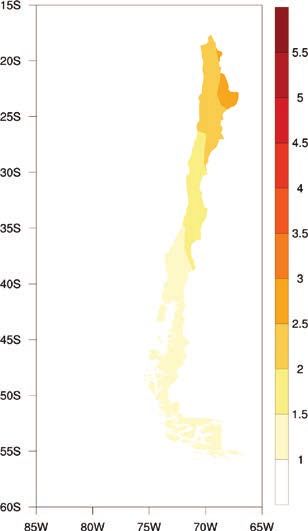
Analysis of data from the World Bank Group’s Climate Change Knowledge Portal (CCKP) (Table 2) shows the
 most recent historical climatology, 1991–2020. Mean annual mean temperature for Chile is 8.3°C, with average
 monthly temperatures ranging between 11°C (December) and 4°C (July). Mean annual precipitation is 647.4 mm,
 with rainfall occurring throughout the year, peaking from May to August. (Figure 3).18 Figure 4 presents the spatial
 variation of observed average annual precipitation and temperature across Chile.

 TABLE 2.  Data Snapshot: Summary Statistics

        Climate Variables                                                                 1991–2020
        Mean Annual Temperature (°C)                                                       9.0°C
        Mean Annual Precipitation (mm)                                                    530.1 mm
        Mean Maximum Annual Temperature (°C)                                              14.3°C
        Mean Minimum Annual Temperature (°C)                                               3.8°C

 FIGURE 3.  Average Monthly Temperature and Rainfall of Chile for 1991–202019
                    20                                                                               100

                    15                                                                               75
Temperature (°C)

                    10                                                                               50    Rainfall (mm)

                     5                                                                               25

                     0                                                                               0
                         Jan   Feb    Mar   Apr   May    Jun   Jul   Aug    Sep   Oct   Nov    Dec
                                                  Rainfall       Temperature

 18
                   WBG Climate Change Knowledge Portal (CCKP, 2021). Chile. URL: https://climateknowledgeportal.worldbank.org/country/chile/
                   climate-data-historical
 19
                   WBG Climate Change Knowledge Portal (CCKP, 2021). Chile. URL: https://climateknowledgeportal.worldbank.org/country/chile/
                   climate-data-historical

 CLIMATE RISK COUNTRY PROFILE: CHILE                                                                                                           6
Key Trends
FIGURE 4. Map of Average Annual Temperature
Temperature
(°C) (left); Annual Precipitation (mm) (right) of
The range of climates in Chile make it important
Chile, 1991–202020
to consider regional variations in climate change.
Observations in the northern regions show warming
in the central valley and Andes and a cooling in
the coastal regions associated with changes in
the surface temperature of the Pacific Ocean.21
Mountain glaciers have also been adversely
impacted by increasing temperature, changing
snow melt and runoff. The number of ‘hot nights’ in
Chile increased approximately by 20.3 nights per
year between 1960 and 2006.22 Figure 5 shows
mean annual observed temperature for the country.
Precipitation
Rainfall patterns vary by region. The Northern
(18–30°S) and Central (30–35°S) zones show
significant inter-decadal and intra-decadal variation,
respectively, while the Southern (37–43°S) has
experienced a decrease in precipitation. Recent
research suggests that historical changes have
altered the flow of low elevation rivers, a trend
FIGURE 5. Observed Temperature for Chile, 1901–202023
9.5
Temperature (°C)
9
8.5
8
7.5
1901 1911 1921 1931 1941 1951 1961 1971 1981 1991 2001 2011 2020
Annual mean Smoothed
20
WBG Climate Change Knowledge Portal (CCKP, 2021). Chile. URL: https://climateknowledgeportal.worldbank.org/country/chile/
climate-data-historical
21
Chile (2016). Third National Communication to the UNFCCC. URL: https://unfccc.int/sites/default/files/resource/NC3%20Chile_
19%20December%202016.pdf
22
UNDP (2012). Climate Change Country Profiles – Chile. URL: https://www.geog.ox.ac.uk/research/climate/projects/undp-cp/
UNDP_reports/Chile/Chile.hires.report.pdf
23
WB Climate Change Knowledge Portal (CCKP, 2021). Chile. URL: https://climateknowledgeportal.worldbank.org/country/chile/
climate-data-historical
CLIMATE RISK COUNTRY PROFILE: CHILE 7toward a decrease in glacial cover.24 Annual precipitation in coastal regions has decreased by 15% to 30% in the
last century. Chile experienced a severe drought again in 2008–2015 with an average deficit of 50%, however,
several regions experienced deficits between 75% to 100% (concentrated near the Coquimbo province). The
Atacama Desert has become more arid and advanced, gaining 0.4 km each year during the twentieth century.25
Climate Future
Overview
The main data source for the World Bank Group’s Climate Change Knowledge Portal (CCKP) is the CMIP5
(Coupled Inter-comparison Project No.5) data ensemble, which builds the database for the global climate change
projections presented in the Fifth Assessment Report (AR5) of the Intergovernmental Panel on Climate Change
(IPCC). Four Representative Concentration Pathways (i.e. RCP2.6, RCP4.5, RCP6.0, and RCP8.5) were selected
and defined by their total radiative forcing (cumulative measure of GHG emissions from all sources) pathway
and level by 2100. The RCP2.6 for example represents a very strong mitigation scenario, whereas the RCP8.5
assumes business-as-usual scenario. For more information, please refer to the RCP Database. For simplification,
these scenarios are referred to as a low (RCP2.6); a medium (RCP4.5) and a high (RCP8.5) emission scenario
in this profile. Table 3 provides CMIP5 projections for essential climate variables under high emission scenario
(RCP 8.5) over 4 different time horizons. Figure 6 presents the multi-model (CMIP5) ensemble of 32 Global
Circulation Models (GCMs) showing the projected changes in annual precipitation and temperature for the periods
2040–2059 and 2080–2099.
TABLE 3. Data Snapshot: CMIP5 Ensemble Projection
CMIP5 Ensemble Projection 2020–2039 2040–2059 2060–2079 2080–2099
Annual Temperature Anomaly (°C) 0.40 to 1.43 0.95 to 2.32 1.64 to 3.47 2.21 to 4.69
(+0.87°C) (+1.54°C) (+2.38°C) (+3.26°C)
Annual Precipitation Anomaly (mm) -19.73 to 15.47 -22.84 to 16.08 -27.58 to 17.56 -32.84 to 19.30
(−2.04 mm) (−4.36 mm) (−6.41 mm) (−8.85 mm)
Note: The table shows CMIP5 ensemble projection under RCP8.5. Bold value is the range (10th–90th Percentile) and values in parentheses
show the median (or 50th Percentile).
24
Chile (2016). Third National Communication to the UNFCCC. URL: https://unfccc.int/sites/default/files/resource/NC3%20Chile_
19%20December%202016.pdf
25
Ministerio de Agricultura (2016). Oficina y Políticas Agrarias. El cambio climático y los recursos hídricos de Chile. December 2016.
Web. URL: https://www.odepa.gob.cl/wp-content/uploads/2016/12/RecursosHidricosCambioClimatico.pdf
CLIMATE RISK COUNTRY PROFILE: CHILE 8FIGURE 6. CMIP5 Ensemble Projected Change (32 GCMs) in AnnualTemperature (top) and
Precipitation (bottom) by 2040–2059 (left) and by 2080–2099 (right), Relative to 1986–2005
Baseline Under RCP8.526
26
WBG Climate Change Knowledge Portal (CCKP, 2021) Chile Projected Future Climate. URL: https://climateknowledgeportal.
worldbank.org/country/chile/climate-data-projections
CLIMATE RISK COUNTRY PROFILE: CHILE 9Key Trends
Temperature
In Chile, average annual temperatures are expected to increase by 1.4°C–1.7°C by mid-century and by as much
as 3°C–3.5°C by the end of the century. Northern areas of the country that currently experience tropical climates
are expected to see a greater increase in temperature compared to the southern regions. Regional climate models
project that temperature increases will be highest in the central regions.27 The number of frost days, days when
the minimal temperature is below 0°C, is projected to decrease by 12–42 days by the 2050s and 37–69 days
by the 2090s. Effects are projected to occur during winter months and be most pronounced in July and August.
The number of summer days (maximum temperature above 25°C) are expected to begin earlier and increase by
2–27 days by the 2050s and 17–61 days by 2090s.
Across all emission scenarios, temperatures will continue to increase for Chile throughout the end of the century.
As seen in Figure 7, under a high-emission scenario, average temperatures will increase rapidly by mid-century.
Across the seasonal cycle (Figure 8), temperature increases will be felt from October to April. Increased heat and
heat conditions will result in significant implications for human and animal health, agriculture, water and energy
resources, and ecosystems.
FIGURE 7. Projected Average Temperature FIGURE 8. Projected Change in Summer Days
for Chile (Reference Period, 1986–2005)28 (Tmax >25°C) (RCP8.5, Reference Period,
1986–2005)29
13.0 14
12.5
12
12.0
11.5 10
Temperature (°C)
11.0
8
Days
10.5
10.0 6
9.5 4
9.0
2
8.5
8.0 0
1980 2000 2020 2040 2060 2080 2100 Jan Feb Mar Apr May Jun Jul Aug Sep Oct Nov Dec
Year
Historical RCP 2.6 RCP 4.5 RCP 6.0 RCP 8.5
Precipitation
While precipitation in Chile is highly variable, it is projected to decrease consistently by 1.5 mm to 9.3 mm per month
by the 2050s, to 5.5 mm to 11 mm by the 2090s. Together with growing temperatures and expected increased
intensity in winds, there could be an increase in evapotranspiration pressures, which would impact surface
water reservoirs. Chile’s central region is expected to experience significantly greater degrees of a reduction in
27
Chile (2016). Third National Communication to the UNFCCC. URL: https://unfccc.int/sites/default/files/resource/NC3%20Chile_
19%20December%202016.pdf
28
WBG Climate Change Knowledge Portal (CCKP, 2021). Interactive Climate Indicator Dashboard - Agriculture. Chile. URL https://
climatedata.worldbank.org/CRMePortal/web/agriculture/crops-and-land-management?country=CHL&period=2080-2099
29
WBG Climate Change Knowledge Portal (CCKP, 2021). Interactive Climate Indicator Dashboard - Agriculture. Chile. URL https://
climatedata.worldbank.org/CRMePortal/web/agriculture/crops-and-land-management?country=CHL&period=2080-2099
CLIMATE RISK COUNTRY PROFILE: CHILE 10precipitation than other regions.30 Expected reduced
precipitation and increased temperature are expected FIGURE 9. Projected Annual Average
to impact evaporation, water balance as well as Precipitation in Chile (Reference Period,
drought conditions. Water access, storage and other 1986–2005)32
management options can be highly varied depending 1500
if the precipitation input comes frequently or with long 1400
1300
periods of aridity in between rainfall. Overall, annual
Precipitation (mm)
1200
mean precipitation is expected to decrease through 1100
the end of the century. This is also likely to impact 1000
reservoirs from hydroelectric plants, which have already 900
800
decreased energy generation due to increased aridity
700
and drought conditions. It is highly likely, under these 600
conditions that fossil fuels will replace a considerable 1980 2000 2020 2040
Year
2060 2080 2100
share of hydroelectric generation, and thus increase Historical RCP 2.6 RCP 4.5 RCP 6.0 RCP 8.5
emission and electricity prices. Figure 9 below,
shows the change in the projected annual average
precipitation for Chile.31
CLIMATE RELATED NATURAL HAZARDS
Overview
Chile is highly exposed and vulnerable to multiple hazards such as earthquakes, volcanic activity, and tsunamis as
well as hazards which can change due to climate impacts, such as wildfires, floods, landslides, and droughts. Chile is a
part of the ‘Pacific Ring of Fire’ and is highly exposed to the occurrence of geological and hydrometeorological
disasters.33 Chile has suffered many instances of drought. Over the period, 1965–2019, there were four
major droughts with losses that, on average exceeded US $1,000 million in losses for each occurrence. Their
macroeconomic impact was relevant, to the point that in the most severe case it represented 0.77% of the GDP for
the year. The social and economic development of the country has not only been affected by precipitation shortages
but also by floods. Over the same period, Chile has lost over US $ 5 billion from 37 events, the most important
representing a loss of approximately US $ 2 billion, equivalent to 0.62% of GDP for the year.34
30
Ministerio de Agricultura (2016). Oficina y Políticas Agrarias. El cambio climático y los recursos hídricos de Chile. December 2016.
Web. URL: https://www.odepa.gob.cl/wp-content/uploads/2016/12/RecursosHidricosCambioClimatico.pdf
31
WBG Climate Change Knowledge Portal (CCKP, 2021): Chile Water Dashboard. Data Description. URL: https://climateknowledgeportal.
worldbank.org/country/chile/climate-sector-water
32
WBG Climate Change Knowledge Portal (CCKP, 2021): Climate Data-Projections. Chile. URL: https://climateknowledgeportal.
worldbank.org/country/chile/climate-sector-water
33
Villalobos, J.A. and Perez, A. (2021). Pacific Alliance countries analyze the hydrometeorological risk impacts. World Bank Blogs,
[6 January, 2021]. URL: https://blogs.worldbank.org/latinamerica/pacific-alliance-countries-analyze-hydrometeorological-risk-impacts
34
World Bank (2020). Catastrophic risk modeling and analysis for the Pacific Alliance (Chile, Colombia, Peru, Mexico). Component 1,
Stage 1. Database on historical events of hydrometeorological origin – Chile. (Unpublished).
CLIMATE RISK COUNTRY PROFILE: CHILE 11Changes in precipitation and water management can leave forested areas vulnerable to wildfires during the fire
season which ranges from October to April/ May. The area between Santiago and Puerto Montt is most exposed
to fire with an average 3,000–5,000 fires each season.35 Chile was recently affected by extensive wildfires in 2017
which impacted approximately 1,000,000 acres of vegetation and reached record proportions. Precipitation patterns,
land use, wind, glacial and snow melt, and other climatic conditions will affect the country’s river systems, impacting
in other sector such as irrigation for agriculture, water for human consumption, and hydroelectric generation. Most
flooding occurs during the rainy season between April and September. However, Chile has recently experienced
flash flooding in connection to temperature changes and snow melt. Coastal areas are also vulnerable to flooding
from sea level rise, though impacts will vary along the countries’ coast and can range between 0.2–0.3 meters
by the end of the century.36 Temperature related hazards are mostly connected with cold temperatures and cold
fronts; in 2011, a cold front impacted an estimated 25,000 people in vulnerable conditions.37 Flooding and wildfire
events occur with higher frequency while earthquakes, the third most frequent disaster, represents a significant
percentage of mortality and economic damages caused by natural disasters.
Data from the Emergency Event Database: EM-Dat, presented in Table 4, shows the country has endured various
natural hazards, including floods, landslides, epidemic diseases, and storms.
TABLE 4. Natural Disasters in Chile, 1900–202038
Natural Hazard Events Total Total Damage
1900–2020 Subtype Count Deaths Total Affected (Million USD)
Drought Drought 2 0 120,000 255,000
Ground movement 27 58,852 6,568,929 4,712,070
Earthquake
Tsunami 3 591 3,353,055 30,800,000
Cold wave 5 2 35,150 20,000
Extreme temperature Severe winter 4 6 50,950 1,000,000
conditions
Flash flood 3 195 336,548 1,530,000
Flood
Riverine flood 19 352 875,144 736,700
Avalanche 1 32 30 —
Landslide Landslide 3 78 142 —
Mudslide 1 141 82,811 6,000
Storm Convective storm 6 156 276,451 —
Volcanic activity Ash fall 9 110 86,650 615,000
Epidemic Bacterial Disease 1 1 40 0
35
CONAF (2021). Forest Fires in Chile. Historical Statistics – National Summary Occurrence and Damage. URL: https://www.conaf.cl/
incendios-forestales/incendios-forestales-en-chile/estadisticas-historicas/
36
Chile (2016). Third National Communication to the UNFCCC. URL: https://unfccc.int/sites/default/files/resource/NC3%20Chile_
19%20December%202016.pdf
37
Center for Excellence in Disaster Management & Humanitarian Assistance (2017). Chile – Disaster Management Reference
Handbook. URL: https://www.cfe-dmha.org/LinkClick.aspx?fileticket=XALlrf4ItFg%3d&portalid=0
38
EM-DAT: The Emergency Events Database – Universite catholique de Louvain (UCL) – CRED, D. Guha-Sapir, Brussels, Belgium.
URL: http://emdat.be/emdat_db/
CLIMATE RISK COUNTRY PROFILE: CHILE 12Key Trends
As discussed, climate change is expected to change the frequency, intensity, exposure, and magnitude of multiple
hazards that have historically affected Chile, namely, wildfires, floods and landslides, droughts, and impacts of sea
level rise. Existing trends indicate population growth will occur in vulnerable areas such as the Central region of
the country, further exacerbating impacts. Changes in the frequency of El Niño events could impact temperatures
and generate increased precipitation that could expose the country to extreme precipitation events and flooding
as well as increased winds.39 Projected decreases in precipitation levels, heightened during La Niña years, in the
northern and central areas of the country could expose Chile to increased periods of drought. A more arid climate
and changes in land use can also expose these parts of the country to higher risk for wildfires. Reductions or wider
ranges in seasonal precipitation can also change traditional river flows and increase the risk of flooding. Changes
in land use, land affected by wildfires, and areas with steep slopes are most vulnerable to landslides. Models
estimate that temperatures will increase, changing the isothermal lines causing changes in river flow and potentially
instances of flash flooding. Changes in snowmelt and glaciers can affect existing water systems and reservoirs. The
accumulation of risks, exposure, and multiple hazards can have important implications for economic growth and
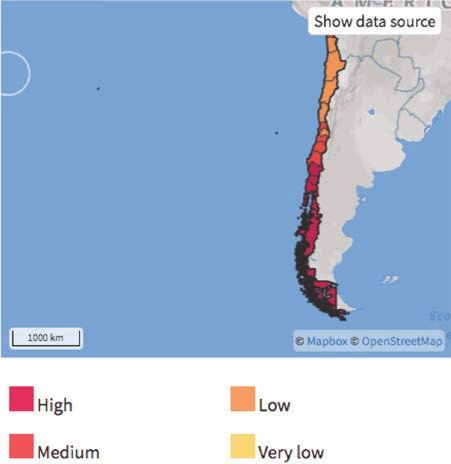
achieving development, disproportionately affecting vulnerable populations. Figure 10 presents the risk of coastal
flooding and water scarcity for Chile.
FIGURE 10. Risk of Urban Flood (left)40; Risks of Wildfires (right)41
39
Ministerio del Interior y Seguridad Pública (2016). Plan Estratégico Nacional parap la Gestión del Riesgo de Desastres 2015–2018.
URL: https://siac.onemi.gov.cl/documentos/PLAN_ESTRATEGICO_BAJA.pdf
40
ThinkHazard! (2020). Chile – Urban Flooding. URL: http://thinkhazard.org/en/report/51-chile/UF
41
ThinkHazard! (2020). Chile – Wildfire. URL: http://thinkhazard.org/en/report/51-chile/WF
CLIMATE RISK COUNTRY PROFILE: CHILE 13Implications for DRM
Chile has extensive experience and institutional capacity with disaster risk management (DRM) due to the historical
abundance of seismic based natural disasters. The National Office of Emergency (ONEMI), within the Ministry of
Interior and Public Safety, is the Chilean lead institution for the governance of critical risks. The ONEMI’s mission is
to plan, promote, coordinate, and implement preventive actions, response, and rehabilitation against collective risk
situations, emergencies, and disasters caused by natural or human action.42 ONEMI coordinates the functioning of
the National Civil Protection System activities at national and local level, and the National Platform for Disaster Risk
Reduction (PNRRD). ONEMI is in charge of elaborating the National Policy for Disaster Risk Management (PNGRD).
Chile’s strategic plan to address disaster risk focuses on four pillars that include institutional strengthening, strengthening
monitoring and early warning systems, developing a culture of prevention and resilience building, addressing transversal
aspects of disaster risk (including climate change) and investing in preparedness to achieve an effective response
when disasters arrive.43 Additionally, risk management is included in sectoral plans as is the case with the National
Energy Strategy, National Water Strategy, and the National Strategy for Climate Change and Vegetation Resources
(Forestry). While Chile has taken important steps to address disaster risk, it recognizes the importance of addressing
social, economic, and other underlying risk factors that lead to vulnerability. It also identifies the need to invest in local
capacity as well as train and retain experts that can support technical data collection, analysis, and research needs
for disaster risk management.
Disaster Risk Finance is one of the pillars within a comprehensive approach to Disaster Risk Management. Financial
protection public policy and financial instruments support governments to become effective risk managers and
help fiscal and macroeconomic goals protect lives, livelihoods, investments, and development progress. Direct
and indirect financial effects of disasters can seriously affect the government finances, as the government fiscal
balance become more weak expenditures rises and taxes base shrinks, the fiscal deficit increases.
Disaster Risk Finance enables the country (at regional, national and subnational levels) to understand their
contingent liabilities and be prepared ex ante. Based on the timeliness of the needs of funds, the sovereigns can
access different sources for facing the event in each stage, depending on the costs of use, amount available and
speed of access. This is a tradeoff between cost and risks to the government. Therefore, they need to combine
different instruments in a risk layer approach to protect themselves against disasters depending in the frequency
and severity. This will ensure value for money as all financial instruments bear a cost.
For example, Chile issued in 2018 within the Pacific Alliance (PA) framework, a seismic cat bond in 2018 (already
due), as part of their financial strategy. Currently, the PA countries are seeking a way to protect themselves against
the economic and social impact of hydrometeorological risks, through a transfer instrument that could become the
first Hydrometeorological Cat Bond or, if the seismic risk is included, in the first Multi-Risk Cat Bond.44,45
42
ONEMI (2014). National Platform for Disaster Risk Reduction, ONEMI. URL: https://www.onemi.gov.cl/plataforma-de-reduccion-
de-riesgos-de-desastres/
43
Ministerio del Interior y Seguridad Pública (2016). Plan Estratégico Nacional parap la Gestión del Riesgo de Desastres 2015–2018.
URL: https://siac.onemi.gov.cl/documentos/PLAN_ESTRATEGICO_BAJA.pdf
44
Gomez, J.P., Huerta, M. J. and Martínez, G. (2020). Contingent Liabilities Report, 2020. Publication of the Directorate of Budgets of
the Ministry of Finance. (Unpublished).
45
Villalobos, J. A. and Pérez, A. (2021). Pacific Alliance countries analyze the hydrometeorological risk impacts. [January 06, 2021]. World
Bank Blogs. URL: https://blogs.worldbank.org/latinamerica/pacific-alliance-countries-analyze-hydrometeorological-risk-impacts
CLIMATE RISK COUNTRY PROFILE: CHILE 14CLIMATE CHANGE IMPACTS TO KEY SECTORS
C
hile is highly vulnerable to climate variability and change in the immediate as well as longer-term, particularly
for the country’s water, agriculture, energy, and health sectors as well as its coastal zones. Water scarcity and
increased aridity for many areas are expected to continue to increase risks of food insecurity and increase
needs for appropriate resource management. The country faces increasing challenges to agriculture, health, and
the tourism sector, which are expected to be further compounded by climate stressors Furthermore, environmental
degradation, impacted water resources, and loss of biodiversity and the increased vulnerability to risks and natural
hazards constitute significant obstacles to the country’s continued development and poverty reduction efforts and
increases the importance for sustainable adaptation and resilience measures.46
Gender
An increasing body of research has shown that climate-related disasters have impacted human populations in many
areas including agricultural production, food security, water management and public health. The level of impacts
and coping strategies of populations depends heavily on their socio-economic status, socio-cultural norms, access
to resources, poverty as well as gender. Research has also provided more evidence that the effects are not gender
neutral, as women and children are among the highest risk groups. Key factors that account for the differences
between women’s and men’s vulnerability to climate change risks include: gender-based differences in time use;
access to assets and credit, treatment by formal institutions, which can constrain women’s opportunities, limited
access to policy discussions and decision making, and a lack of sex-disaggregated data for policy change.47
Agriculture
Overview
Agriculture is a priority sector for the Chilean economy. The country’s diverse climate allows it to produce a wide
range of crops and is one of the largest exporters of agricultural products, as of 2019, valued at over $15.6 billion
in food exports. Chile is the world leading exporter of fresh blueberries, cherries, grapes, and dehydrated plums and
apples.48 While innovation in the sector is relatively low, Chile has made strategic investments in its agricultural value
chains with significant advances in efficiencies in the agroindustry.49. Agricultural production has been a consistent
key element of GDP and the sector employs approximately 6.3% of the population.50 On average, agricultural
income is lower than average country incomes.51 Agricultural employment and GDP contributions are concentrated in52
the O’Higgins, Maule and Bio-Bio region, where agriculture accounts for 18%, 13.8% and 15.6% of regional GDP
46
Chile (2016). Third National Communication to the UNFCCC. URL: https://unfccc.int/sites/default/files/resource/NC3%20Chile_
19%20December%202016.pdf
47
World Bank Group (2016). Gender Equality, Poverty Reduction, and Inclusive Growth. URL: https://openknowledge.worldbank.org/
handle/10986/23425
48
FAO (2019). Chile Country Profile. URL: http://www.fao.org/countryprofiles/index/en/?iso3=CHL
49
InvestChile (2019). Food Industry – Foreign Investor’s Guide. URL: https://investchile.gob.cl/key-industries/food-industry/
50
World Bank Open Data (2021). Data Bank: Population Estimates and Projections, Chile. URL: https://databank.worldbank.org/data/
reports.aspx?source=health-nutrition-and-population-statistics:-population-estimates-and-projections
51
Reforma Agraria (2018). Sector Contribution to the Economy of Chile by 2030 – First Section Reflection and Challenges by 2030:
Institutional Perspective of PASO. URL: https://www.odepa.gob.cl/wp-content/uploads/2018/01/economia4parte.pdf
52
These statistics do not account for Chile’s newly added Ñuble Region, established in 2017.
CLIMATE RISK COUNTRY PROFILE: CHILE 15and 13.9%, 18.3%, and 15.9% of employment, respectively;53 for the center-south, agriculture represents
6%–11% of GDP.54 Agricultural production and forestry are responsible for 73% of water extraction used to irrigate
approximately 1.1 million hectares located almost completely between the Coquimbo and Los Lagos regions.55
The agricultural sector has been affected by episodes of drought, particularly in 2013, which led to updates to
the National Commission on Irrigation which incentivized private investments in irrigation technology and advance
water management infrastructure.56 In addition to managing water to ensure availability for irrigation, the sector is
challenged by the need to manage contaminated water and runoff from agricultural land.57
Climate Change Impacts
Climate change is expected to not only change climatic conditions and the seasonality suitable for agriculture, but
also increase the occurrence of extreme events, such as the extreme rainfall in the 2020–2021 season estimated
to have impacted more that 50% of fruit harvests.58 Climate change models predict that the average daily maximum
temperatures in Chile will increase by around 2C° by the 2050s. Precipitation patterns are also predicted to vary
across north and south of the country, with decreases in precipitation in the north and minimal to positive changes
in precipitation in the south. Projected change in annual rainfall seasonality for the country is expected to remain
unchanged by mid-century and increase slightly to 0.06 mm by the end of the century. Days of consecutive
dry spells are expected to be higher in the central-north compared to the south, with stronger effects between
November and March. Changes in temperature is likely to also reduce risks of freeze, while also challenging crops
and livestock who are sensitive to high temperatures, particularly in northern, arid regions. Northern and central
regions face the challenge of decreased precipitation, which could challenge both rain-fed and irrigated agriculture.
In southern regions of the country, where temperatures are colder on average, increases in temperature could
make these regions more suitable for agricultural production. Southern areas of the country are also expected to
experience minimal to positive changes in precipitation patterns. Climate models project that the average growing
season length in Chile will grow by 26 days by the 2040s and 54 days by the 2090s.59 Changes in ocean currents,
such as the Humboldt current, are resulting in lower sea surface temperatures, which reduced precipitation in
coastal areas by 15–30% in the last century.60 Changing climatic conditions are also predicted to impact erosion
levels by increasing erosion particularly in the Bío-Bío region, where agricultural practices are increasing pressure
on soil health.61
53
Ficha Nacional (2020). National and Regional Statistics. Oficina de Estudios y Polïticas Agrarias. URL: https://www.odepa.gob.cl/
estadisticas-del-sector/ficha-nacional-y-regionales
54
Reforma Agraria (2018). Sector Contribution to the Economy of Chile by 2030 – First Section Reflection and Challenges by 2030:
Institutional Perspective of PASO. URL: https://www.odepa.gob.cl/wp-content/uploads/2018/01/economia4parte.pdf
55
Chile (2013). Chile Cuida su Agua, Estrategia nacional de Recursos Hídricos 2012–2025 (National Water Resources Strategy).
URL: https://www.mop.cl/Documents/ENRH_2013_OK.pdf
56
FAO (2015). Country Programming Framework. FAO Technical Assistance (2015–2018). URL: http://www.fao.org/3/a-bp548s.pdf
57
Chile (2013). Chile Cuida su Agua, Estrategia nacional de Recursos Hídricos 2012–2025 (National Water Resources Strategy).
URL: https://www.mop.cl/Documents/ENRH_2013_OK.pdf
58
Villena, M. (2021). Rains impact more than 50% of th3 harvests of some fruits in the central zone. PULSE. [January 31, 2021].
URL: https://www.latercera.com/pulso/noticia/lluvias-impactan-mas-de-50-de-la-cosecha-de-algunas-frutas-en-la-zona-centro/
AM2Z56UBWBERTL56NGKB5NQVPA/
59
WBG Climate Change Knowledge Portal (CCKP, 2021). Chile Projections. URL: https://climateknowledgeportal.worldbank.org/country/
chile/climate-data-projections
60
Reforma Agraria (2018). Chilean Agriculture Reflections and Challenges by 2030 – Second Section Reflections and Challenges by
2030. URL: https://www.odepa.gob.cl/wp-content/uploads/2018/01/cambioClim12parte.pdf
61
Chile (2013). Plan de Adaptacion al Cambio Climatico del Sector. URL: https://www.scribd.com/document/176284308/Plan-Adaptacion-
CC-S-Silvoagropecuario
CLIMATE RISK COUNTRY PROFILE: CHILE 16Decreased water availability is likely to reduce yields
and the reduction in soil moisture may alter suitable FIGURE 11. Projected Change in Average
areas for agriculture or the production of specific Daily Maximum Temperature for Chile
crops. Increased heat and water scarcity conditions (RCP8.5, (Reference Period, 1986–2005)62
are likely to increase evapotranspiration, expected to 6.5
6.0
contribute to crop failure and overall yield reductions.
5.5
This may also result in the need for increased cooling 5.0
Temperature (°C)
and cold chain management to preserve and maintain 4.5
feedstock at points of production as well as at ports 4.0
3.5
while awaiting export. Figure 9 shows the average
3.0
daily max temperature across the seasonal cycle. 2.5
These higher temperatures have implications for 2.0
1.5
impacts to soil moisture and crop growth and as seen Jan Feb Mar Apr May Jun Jul Aug Sep Oct Nov Dec
in Figure 11, Chile will experience increased average
temperatures of approximately 3.5°C throughout
the year.
Adaptation Options
While climate change impacts present a source of risk to agricultural production, these changes could also result
in opportunities for diversification as well as the adoption of Climate Smart Agriculture Technologies. Changes in
climatic conditions are expected to have a strong impact in agricultural production in southern regions of the country
which currently have low population density and little economic activity.63 In response to agricultural emergencies
such as extreme temperature, precipitation events, or other natural stressors, the government established a National
Advisory Commission for Agricultural Emergencies, which supports the implementation of agrometeorological and
early warning systems. This commission supports coordination with the private sector as well as ministries to develop
policies that reduce risk and damages from such events.64 Additionally, the Department for Risk Management in
the Ministry of Agriculture connects the public to updated information with agricultural relevant information,65
risk sharing products, early warnings, capacity building, and dissemination of preventive and adaptive measures
through sharing best practices and agricultural extension.66 The proposed climate change sectoral adaptation plans
for both fisheries and agricultural production, introduces more efficient use in natural resources, especially in the
case of water, energy, and fertilizer usage. Increasing the diversity of agricultural production, an increase use of
local inputs, and diversifying approaches to pest management are also proposed. The proposal also considers the
62
WBG Climate Change Knowledge Portal (CCKP, 2021). Chile Agriculture. Dashboard URL: https://climatedata.worldbank.org/CRMePortal/
web/agriculture/crops-and-land-management?country=CHL&period=2080-2099
63
Reforma Agraria (2018). Chilean Agriculture Reflections and Challenges by 2030 – Second Section Reflections and Challenges by
2030. URL: https://www.odepa.gob.cl/wp-content/uploads/2018/01/cambioClim12parte.pdf
64
Ministry of Agriculture (2019). Agriculture Emergency Unit, Chile. URL: https://www.odepa.gob.cl/emergencia-agricola
65
The Ministry has developed the Atlas de Reisgos Climaticos (ARCLIM), launched in 2020, which analyzes threats, exposition and
crop suitability for 14 agricultural value chains. ARCLIM can be found at this link: https://arclim.mma.gob.cl/atlas/sector_index/
agricultura/
66
Ministry of Agriculture (2018). Soil and Water Conservation Practices and their Adaptive Effects on Impacts of Climate Change in
the Drylands of Chile. URL: http://dgir.minagri.gob.cl/wp-content/uploads/2017/05/Pr%C3%A1cticas-Conservacionistas-de-Suelo-
y-Agua-y-sus-Efectos-Adaptativos-sobre-los-Impactos-del-Cambio-Clim%C3%A1tico-en-el-Secano-de-Chile.pdf
CLIMATE RISK COUNTRY PROFILE: CHILE 17importance of sustainable soil use practices and measures to reduce erosion as well as investing in crops that are
resilient to extreme heat, water, or salinity conditions. In regard to extreme events, the proposal highlights a focus
on emergency response and early warning systems.
Water
Overview
Chile is endowed with abundant water resources with 1,251 rivers, 101 watersheds, and 15,000 lakes and ponds.
Water systems in Chile are as diverse as the number of ecosystems and environments in the country. The country
has an annual per capita water availability of 53,000 m3/year; however, availability varies regionally with ranges
from 52 m3/year to 2.9 million m3/year in others.67 The Atacama Desert in Northern Chile is one of the most
arid areas of the world. Water availability increases gradually toward southern latitudes and becomes abundant
near Aysén. Chile is currently in the midst a mega-drought, with Chile’s recurring drought scenarios becoming
the new normal. Central Chile has experienced an uninterrupted sequence of dry years since 2010, with mean
rainfall deficits of 20% to 40%. This has resulted in direct consequences for water security, with growing conflict
over accessibility, supply and ultimately livelihoods. Furthermore, the droughts have in turn impacted forest fires.68
Additionally, water scarcity in Chile has also impacted electricity prices and increase in emissions. Energy is already
the highest emitting sector, and decreased precipitation and/or increased drought conditions impact hydroelectric
generation being replaced by fossil fuels.
National water usage in 2010 amounted to 4,710 m2 annually. An estimated 99% of urban and 87% of rural
populations in 2015 had access to running water (98% country wide) and 99% of urban and 79% of rural areas
had access to sanitation services.69 The agricultural sector requires the most water resources (approximately 73%
of extracted water), followed by industry (12%), mining (9%), and sanitation (6%).70 Chile uses water resources
to produce hydroelectricity with reservoirs, and run-of-of river plants, with a hydroelectric energy potential of
9GW/h. Water is a strategic input to productive sectors and forms the backbone of the country’s water-intensive
economy. As such, the Chilean economy that has shifted towards a water intensive, export-orientated economy.
Historical trends point to challenges of water distribution and availability between regions which may become
more pronounced with a changing climate. Precipitation and water availability in Chile are closely connected to
the El Niño Southern Oscillation cycle. La Niña years tend to experience higher precipitation while El Niño years
are associated with lower levels of precipitation. The Pacific Decadal Oscillation can also influence sea surface
67
Chile (2013). Chile Cuida su Agua, Estrategia nacional de Recursos Hídricos 2012–2025 (National Water Resources Strategy).
URL: https://www.mop.cl/Documents/ENRH_2013_OK.pdf
68
Garreaud, R. et al. (2020). The Central Chile Mega Drought (2010–2018): A climate dynamics perspective. International Journal of
Climatology. DOI: https://doi.org/10.1002/joc.6219
69
Chile (2017). Agenda 2030 Objetivos de Desarrollo Sustentable. Sustainable Development Goal Report, September 2017.
URL: www.cl.undp.org/content/dam/chile/docs/ods/undp_cl_ODS_Informe_ODS_Chile_ante_NU_Septiembre2017.pdf
70
Chile (2013). Chile Cuida su Agua, Estrategia nacional de Recursos Hídricos 2012–2025 (National Water Resources Strategy).
URL: https://www.mop.cl/Documents/ENRH_2013_OK.pdf
CLIMATE RISK COUNTRY PROFILE: CHILE 18You can also read