China's Search for Blue Skies - Understanding LNG's Role Batt Odgerel Research Associate - IICEC
←
→
Page content transcription
If your browser does not render page correctly, please read the page content below

China’s Search             Batt Odgerel
                           Research Associate
for Blue Skies
                           William Pack
Understanding LNG’s Role   Senior Research
                           Analyst

                           April 2019
ABOUT THIS REPORT

      Bringing an LNG project to final investment decision has traditionally required addressing the large
financial risks inherent in the massive capital commitments needed to construct an appropriate scaled
liquefaction facility and organize an assured long-term supply of natural gas feedstock. LNG project
development investors have historically addressed these risks through long-term contracts in which both
the supplier and consumer provide adequate long-term commitments to overcome the financial risks from
a lumpy investment.
      Many consuming centers in Asia are potentially new buyers of LNG given its effective role in
addressing air pollution concerns. These consuming centers remain cautious and risk-averse making
agreements for long-term LNG purchase commitments difficult to conclude. At the same time, the U.S.
and other potential producing centers offer the potential to provide long-term and stable supplies of LNG
at competitive prices. In response to these concerns, LNG suppliers are working through strategies to
expand supply volumes under these new market conditions.
      Although China has made long-term commitments for LNG imports, the country is also very active in
the short-term or “spot” market. China’s potential as a very large LNG demand center remains uncertain.
Estimating long-term LNG demand from China faces two unique challenges. First, China is a very large
consumer of natural gas which is supplied from domestic production, overland pipelines, and LNG.
Understanding the interrelationship of these supply sources is not straightforward. Second, because of the
size of the Chinese market, relatively modest shifts in national priorities and government policy can have
an outsized outcome on LNG demand in Asia leading to volatility in both prices and supply patterns.
      This report examines China’s role as a demand center for LNG and evaluates how a range of
conditions and policy initiatives could change the scale and scope of China’s demand profile in the Asian
LNG market.

ABOUT EPRINC
      The Energy Policy Research Foundation, Inc. (EPRINC) was founded in 1944, and is a not-for-profit,
non-partisan organization that studies energy economics and policy issues with special emphasis on oil,
natural gas, and petroleum product markets. EPRINC is routinely called upon to testify before Congress
as well as to provide briefings for government officials and legislators. Its research and presentations
are circulated widely without charge through postings on its website. EPRINC’s popular Embassy Series
convenes periodic meetings and discussions with the Washington diplomatic community, industry
experts, and policy makers on topical issues in energy policy.
      EPRINC has been a source of expertise for numerous government studies, and both its chairman and
president have participated in major assessments undertaken by the National Petroleum Council. In recent
years, EPRINC has undertaken long-term assessments of the economic and strategic implications of the
North American petroleum renaissance, reviews of the role of renewable fuels in the transportation sector,
and evaluations of the economic contribution of petroleum infrastructure to the national economy. Most
recently, EPRINC has been engaged on a joint assessment with the Institute of Energy Economics, Japan
(IEEJ) of the future of U.S. LNG exports to Asia.
      EPRINC receives undirected research support from the private sector and foundations, and it has
undertaken directed research from the U.S. government from both the U.S. Department of Energy and the
U.S. Department of Defense. EPRINC publications can be found on its website: www.eprinc.org.

© Copyright 2019
Energy Policy Research Foundation, Inc. 1031 31st Street, NW Washington, DC 20007
▶ +1 202.944.333 ▶ eprinc.org

                         EPRINC China’s Search for Blue Skies: Understanding LNG’s Role
TABLE OF CONTENTS

Executive Summary                                                                                1
        History of LNG in Chinese Markets      				                                              3
        Evolution of the Chinese Natural Gas Policy                                              5
Important Actors in the Sector                                                                   8
        Bureaucracy                                                                              8
        The Big Three and Other Enterprises                                                     10
        Local Authorities                                                                       13
Current Market Environment                                                                      14
        Environmental and Climate Factors                                                       16
        Current Policy and Implementation                                                       18
        Projections Through 2020                                                                19
        Domestic Production and Shale Gas Potential                                             20
        Natural Gas Supply and Storage Security and Capacity                                    22
Market-Based Reforms                                                                            27
        Pricing Mechanism                                                                       27
        Third-Party Access                                                                      34
        Trading Hubs                                                                            35
Conclusion                                                                                      36
Appendices                                                                                      37
        Appendix 1: Proposed LNG Receiving Terminals                                            37
        Appendix 2: The NDRC Natural Gas Pricing Policy, 2010-2018                              38
        Appendix 3: Medium- and Long-Term LNG Contract                                          40
        Appendix 4: Three Separate Phases of CNPC Planned UGSs Starting in 2022                 41
        Appendix 5: The “2+26” Key Cities Have Different Types of Natural Gas Heating Methods   41
        Appendix 6: LNG Receiving Terminals and Storages Operating in China                     42
        Appendix 7: LNG Receiving Terminals and Storages Under Construction/Planned in China    43
        Appendix 8: Natural Gas Distribution Pipelines and Supplies in Chinese Cities,
           1998-2016 (km, bcm)                                                                  43
        Appendix 9: Short-Term and Spot Market Trade in 2017                                    44
        Appendix 10: Beijing Historical Weather, 2013-2017 (Celsius degrees)                    45
Abbreviations                                                                                   46
Bibliography                                                                                    47

FIGURES AND TABLES
      Figure 1: Natural Gas Consumption and Production in China,
         2007-2017 (billion cubic meters)                                                        3
      Figure 2: LNG vs. PNG, 2011-2016 (bcm, %)                                                  4
      Figure 3: Average Annual Economic Growth and Energy Consumption Growth,
         1991-2016 (%)                                                                           5
      Figure 4: Average Annual Economic Growth and Natural Gas Consumption Growth,
         1991-2016 (%)                                                                           6
      Table 1: Natural Gas Production Planning and Performance
         (billions of cubic meters and percent)                                                  7
      Figure 5: Chinese Natural Gas Governance Structure                                         8
      Figure 6: China’s Domestic Natural Gas Production by NOCs (2017)                          10
      Figure 7: China’s LNG Imports by NOCs (2017)                                              11
      Figure 8: Composition of Energy Consumption, 1990-2016 (%)                                14

                       EPRINC China’s Search for Blue Skies: Understanding LNG’s Role
TABLE OF CONTENTS continued

    Figure 9: Natural Gas Consumption by Sector, 2000-2015 (bcm)                            15
    Figure 10: PM 2.5 Air Pollution, Mean Annual Exposure in China (micrograms/cm)          16
    Figure 11: Bimonthly Domestic Gas Production 2013-2017 (bcm)                            17
    Table 2: Natural Gas Provisions of the 13th Five-Year Plan Goals and Progress           18
    Figure 12: China’s Proven Natural Gas Reserves by Region (2006)                         21
    Figure 13: Small-Scale LNG in Operation in 2015 (mtpa)                                  25
    Figure 14: Annual Average City Gate Gas Prices in the U.S. and China,
       USD/thousand cu.ft (2007-1H2018)                                                     28
    Figure 15: Timeline of the Reforms in Non-Residential Natural Gas Pricing by the NDRC   29
    Figure 16: Timeline of the Reforms in Residential Natural Gas Pricing by the NDRC       30
    Figure 17: China’s Natural Gas Pricing Composition                                      31
    Figure 18: LNG Supply via Medium- and Long-Term Contracts in China 2006-2040 (mtpa)     32
    Figure 19: Monthly Imports and Average Values of LNG and PNG in China
       (Jan 2016 - Sep 2018)                                                                33
    Figure 20: Short-Term and Spot LNG Imports in China, 2011-2017                          34

                   EPRINC China’s Search for Blue Skies: Understanding LNG’s Role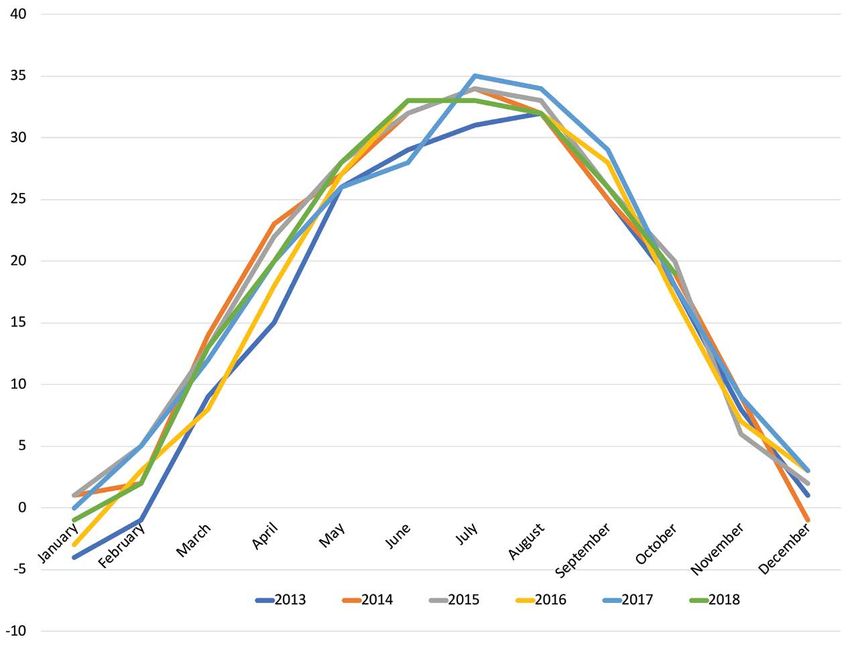
EXECUTIVE SUMMARY

      A small change in the Chinese natural gas sector can lead to an oversized impact on global markets.
Indeed, China’s “coal-to-gas” switching policy led to a spike in spot Asian LNG prices in the winter of
2017. The resulting opportunity for arbitrage attracted an unprecedented number of LNG vessels from the
Atlantic Basin to the Pacific Basin, ushering in the beginning of a new era in the Asian gas industry. Driven
by a rising political imperative to reduce air pollution, record growth has been observed in natural gas
demand in China over the past decade. China surpassed South Korea as the second largest LNG importer
in 2017 and is projected to surpass Japan as the world’s largest natural gas importer in 2019. China’s LNG
import trends reflect official policy on improving air quality, concerns over energy security, the pace at
which nuclear power and renewables can be deployed and the role of domestic supplies and foreign
pipeline imports.

Key Findings

▶ Political commitment to clean energy has driven growth in natural gas demand in China.
      The State Council, adhering to the guidance of the Communist Party, has put a great emphasis on
natural gas in official government documents, including in its five-year plans and various “notices” and
“opinions” as published by the Council. Despite the absence of a unified energy ministry, the Chinese
economic planning agency, the National Development and Reform Commission (NDRC), has delivered
strong results in promoting natural gas and LNG. In accordance with the 13th Five-Year Plan, the
combined efforts of other state ministries as well as municipal and provincial governments are moving
forward on national policy in this area. Even with growth in natural gas pipeline imports and continued
expansion of domestic natural gas production, local and national policies will drive rising demand
for LNG. Small scale LNG, expansion of LNG storage capacity, and the political imperative to improve
air quality will likely drive LNG imports from 71.6 bcm in 2018 to 119 bcm by 2020. This is roughly
equivalent to 90% of the expected U.S. export capacity by 2021 according to the EIA.

▶ Despite the emergence of new players, national oil and gas companies (NOCs) will remain dominant in
the natural gas and LNG sector.
     Beneath the bureaucracy lie more autonomous and commercialized state-owned oil and gas groups:
CNPC, Sinopec and CNOOC. These monopolistic enterprises constitute the entire domestic gas production
and natural gas imports by pipelines and fully or partially own over 90% of the total LNG receiving
capacity in China. Against this backdrop, the National Development and Reform Commission (NDRC)
and local governments pursued more competitive market policies, which prompted the emergence of the
so-called “second-tier” players. Public utilities and private enterprises have begun engaging in the LNG
business by leasing receiving terminals or constructing their own facilities. These second-tier players are
advancing their presence in unconventional technologies such as small-scale LNG and LNG trucking.
Independent entities are also engaging in spot markets to a greater extent than in the past, but these players
only amount to a small volume of total Chinese LNG demand.

▶ Environmental pollution and seasonal fluctuations are the biggest exogenous factors in both the long
and short run, respectively.
     Air pollution in large cities has been the main cause of China’s insistence on crafting clean energy
policy. Along with other types of pollution, air pollution may determine the long-term growth of
natural gas demand in the country. In the short run, however, seasonal fluctuations, especially winter
temperatures, have demonstrated a direct impact on household consumption and the movement
of LNG vessels.

                         EPRINC China’s Search for Blue Skies: Understanding LNG’s Role
                                                    Page 1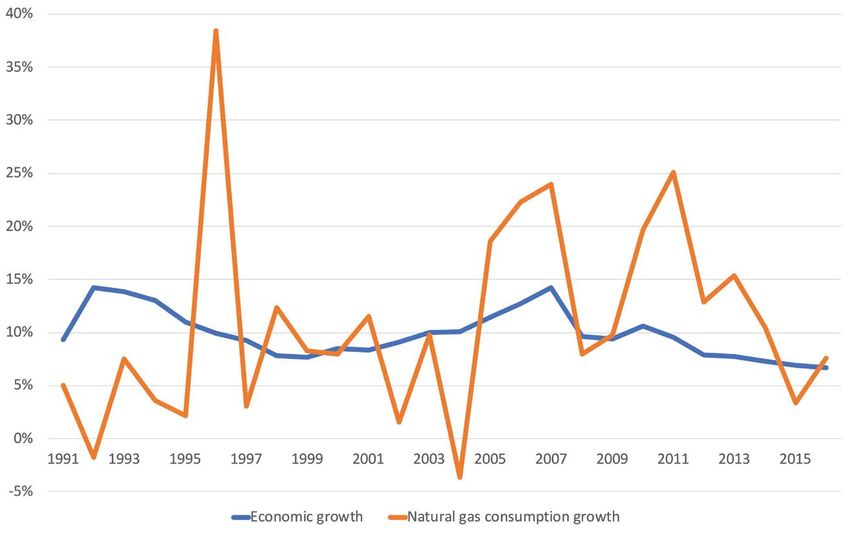
EXECUTIVE SUMMARY continued
Key Findings (continued)

▶ Chinese dependence on LNG and PNG imports will continue to grow unless major breakthroughs occur
in shale gas technologies.
      China has shale gas reserves that could dwarf those in the United States. Unfortunately, due to
technological barriers, geological difficulties, and lack of investment, the NOCs have not been able to tap
into this potential. Unless major breakthroughs occur in shale gas, growth in domestic conventional and
unconventional production will likely remain modest in the foreseeable future and lead to a growing
dependence on LNG and PNG imports.

▶ LNG will be the main driver of growth in natural gas use through 2020; however, China faces
substantial hurdles to increase the share of natural gas from its current levels to official guidance of
8.3%-10%.
      China’s natural gas policy can be divided into three components: substantial growth in natural gas
use, security and stability of supply, and market-based reforms. Growth in natural gas use and LNG imports
is projected to stay on track, but the 13th Five-Year Plan’s goal to raise the share of natural gas in energy
mix may slightly fall short of its planned percentage. This is largely due to China’s insufficient growth in
domestic output, the stalling of piped natural gas (PNG) pipeline projects and the country’s overall limited
upstream capacity. Imports are expected to constitute nearly half of total demand by 2020, with LNG driving
that growth before the expected moderating effects of new PNG projects such as the Power of Siberia.

▶ Following a demand shock in 2017, official policies will be directed at obtaining supply stability
through an improved storage and peak shaving system.
      Approximately four million households switched from coal to gas or electricity for heating in the
winter of 2017, contributing to extremely tight gas markets and high LNG prices. The transition came at
the expense of societal wellbeing as a number of households and schools had to endure the winter without
sufficient heating. To ensure supply security and stability, China is leveling up its storage and peak shaving
capacity, particularly with regard to its underground gas storage facilities (UGSs) and LNG receiving stations
and is implementing strict requirements and punishments for violations. An improved peak shaving system
will smooth out the effects of seasonal variations and help to maintain a more robust LNG sector.

▶ Long-term LNG contracts will remain strong despite steady growth in spot trading.
     Although the conventional view is that spot LNG markets are on the rise, the share of medium- and
long-term contracts in total imports have remained at the same level due to recent deals with large companies
such as Qatargas. This trend is supported by government policy to ensure national gas supply security.

▶ China has continuously shown progress in its market-based reforms, but it continues to trail far behind
the gas markets in the United States and Europe.
      China is striving towards more liberalized natural gas markets with improved pricing mechanisms,
open access to infrastructure, and transparent gas trading hubs. The State Council has taken steps such as
the unification of residential and non-residential gas prices and has initiated policy to open up third-party
access (TPA) to LNG receiving terminals. China has established trading hubs in Shanghai and Chongqing
to continue the liberalization of gas pricing and to set price benchmarks for Asian natural gas markets.
Despite China’s recent initiatives, Chinese gas pricing mechanisms are yet to be fully market-based and lag
far behind those of the United States and Europe. That is, domestic gas prices remain pegged to alternative
fuels and long-term LNG contracts are linked to oil prices in the Asian market; despite the first public
TPA slot auction this year, it remains to be seen whether challenges stemming from a limited number of
facilities and window periods could be addressed in the near future. The full maturity of Chinese trading
hubs is likely to take a long time, with little interest generated internationally at the moment.

                         EPRINC China’s Search for Blue Skies: Understanding LNG’s Role
                                                    Page 2
HISTORY OF LNG IN CHINESE MARKETS

      Prior to its first LNG imports in 2006, China’s       2007 and 2017. The rapid increase in Chinese
natural gas governance emphasized domestic                  natural gas consumption was in large part due to
output, but the efforts were largely unsuccessful,          concerns over air pollution in large cities. In 2016,
and gas remained an insignificant proportion of             as some gains were achieved in domestic natural
China’s energy mix. Up until the early 2000s,               gas production, growing consumption required
natural gas consumption accounted for less than             China to obtain additional supply by importing
3% of the country’s energy consumption.                     natural gas through pipelines and in the form of
      As shown in Figure 1, China’s energy mix              LNG.1 By 2017, the share of LNG imports surpassed
started changing dramatically in the second half of         that of PNG, and natural gas imports nearly reached
the decade, and natural gas consumption in China            40% of total consumption (Figure 2).
grew at an annual average rate of 14.7% between

                                      Figure 1
    Natural Gas Consumption and Production in China, 2007-2017 (billion cubic meters)2

1
 Higashi, Nobuyuki. June 2009. “Natural Gas in China: Market evolution and strategy.” International Energy Agency
Working Paper Series. p. 4.
2
 BP Statistical Review of World Energy, 2007-2017

                          EPRINC China’s Search for Blue Skies: Understanding LNG’s Role
                                                     Page 3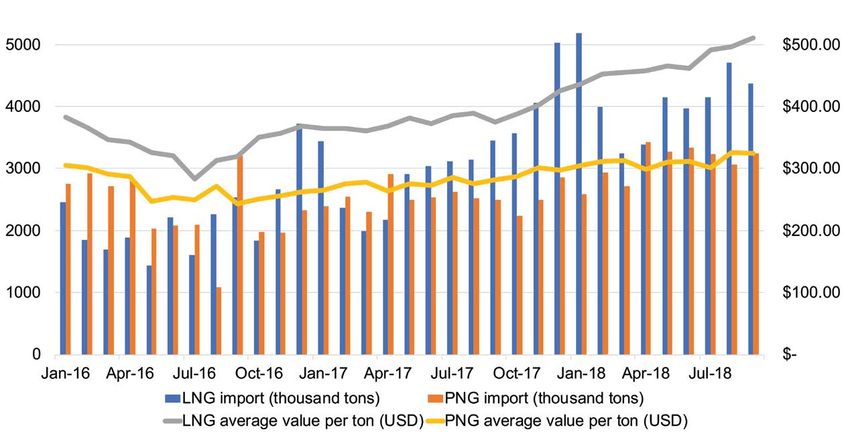
HISTORY OF LNG IN CHINESE MARKETS continued

                                             Figure 2
                                  LNG vs. PNG, 2011-2016 (bcm, %)3

     In 1998, the State Council decided to                enterprise (SOE) CNOOC. After more than two years
introduce a pilot LNG project. This pilot project         of negotiations with the Australian government and
resulted in the establishment of Guangdong Dapeng         BP and the completion of the country’s first LNG
LNG Co., Ltd. in 2014. The company is 33% owned           receiving terminal, Dapeng LNG, the first LNG cargo
by the large Chinese oil and gas state-owned              arrived in Guangdong in 2006.4

BP Statistical Review of World Energy Full Report 2013-2017.
3

Guangdong LNG. n.d. “Project Milestones” (in Chinese). http://www.gdlng.com/static/gd-lng-milestrone.html
4

                         EPRINC China’s Search for Blue Skies: Understanding LNG’s Role
                                                    Page 4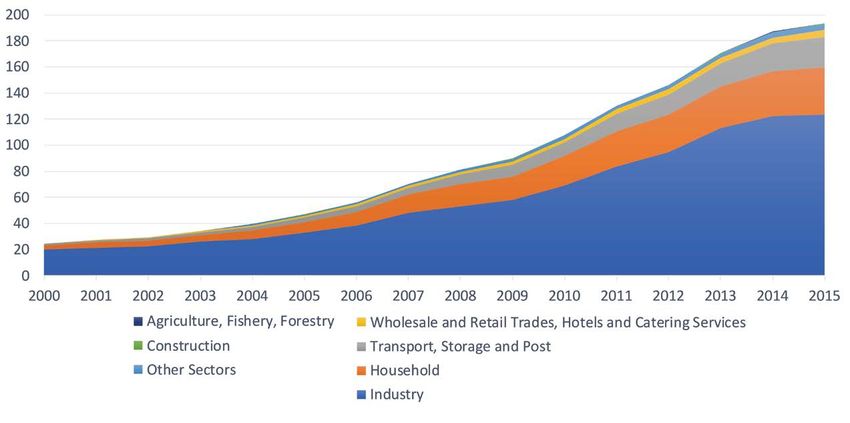
HISTORY OF LNG IN CHINESE MARKETS continued

Evolution of the Chinese Natural Gas Policy                 Instead of economic growth, state policy drove
     In the absence of state policy, natural gas            the changes towards increased natural gas
consumption in China would have had very modest             consumption, as Figures 3 and 4 below show.
growth or have been substantially constrained.

                                      Figure 3
    Average Annual Economic Growth and Energy Consumption Growth, 1991-2016 (%)5

5
 Data derived from the World Bank data on China’s economic growth, National Bureau of Statistics’ data on energy
consumption, UN data on natural gas consumption, and BP data on natural gas consumption

                          EPRINC China’s Search for Blue Skies: Understanding LNG’s Role
                                                     Page 5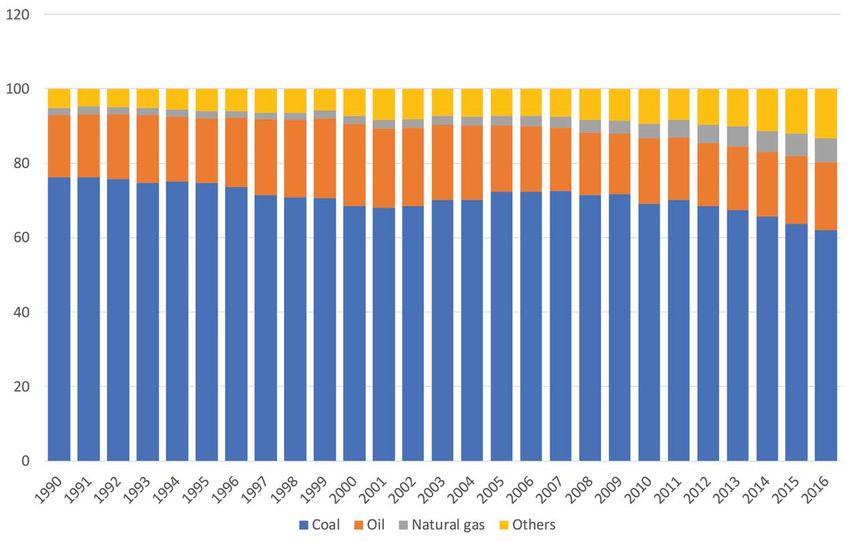
HISTORY OF LNG IN CHINESE MARKETS continued

                                           Figure 4
                               Average Annual Economic Growth
                      and Natural Gas Consumption Growth, 1991-2016 (%)6

      China’s natural gas policy has rapidly evolved        2010) targeted an increase in the share of natural
since the early 2000s. This fact is reflected in            gas to 5.3% of total primary energy consumption in
China’s five-year plans and other state economic            2010. As a result, natural gas production showed
and development policies. The five-year plans               the fastest growth rate after wind power during this
before 2000 did not draw a distinct line between            period, averaging 14 percent.
the oil and natural gas sectors; the ninth plan only              LNG was first considered extensively in the
briefly mentioned natural gas.                              12th Five-Year Plan (2011-2015), which covered
      Starting with the 10th Five-Year Plan (2001-          topics including LNG hybrid vehicles and ships.
2005), China placed a greater emphasis on natural           Annual LNG receiving capacity was planned to
gas. The government acknowledged the lack of                rise by over 50 million tons per annum (mtpa)
competition in the natural gas sector and even              and the number of LNG storage facilities were
discussed reforming pricing mechanisms based on             set to increase in coastal areas. Despite some
the market.7 The plan proposed developing clean             achievements, the plan failed to fulfill its target of
technology to reduce environmental pollution and            increasing the share of natural gas to 7.5% of total
increase foreign collaboration on overseas oil and          energy consumption by 2015.
gas exploration. The 11th Five-Year Plan (2006-

6
 Data derived from the World Bank data on China’s economic growth, National Bureau of Statistics’ data on energy
consumption, UN data on natural gas consumption, and BP data on natural gas consumption
7
 People’s Daily. 2001. “China’s ‘Tenth Five-Year’ Special Plan for Energy Development (Full Text)” (in Chinese).
http://www.people.com.cn/GB/jinji/31/179/20010813/533877.html

                          EPRINC China’s Search for Blue Skies: Understanding LNG’s Role
                                                     Page 6
HISTORY OF LNG IN CHINESE MARKETS continued
During the 10th and 11th plan periods when import ratio. Table 1 demonstrates that not all five-
China was more self-sufficient in natural gas, the year plans were achieved within their timeframe,
planned production targets were fulfilled. However, and when the actual production level failed to
in the 12th plan period implementation fell short of fulfill the planned level in 2010-2015, imported
the goals, bringing forth an even greater production- natural gas increased to a much greater extent.
Table 1
Natural Gas Production Planning and Performance
(billions of cubic meters and percent)8
Planned Planned Actual
Beginning achievement annual Actual annual
Plan level (year) (year) growth achievement growth Fulfillment
10th 27.2 bcm 50 bcm 13.19% 49.3 bcm 12.63% Almost
(2001-2005) (2000) (2005)
11th 49.3 bcm 92 bcm 13.3% 95.2 bcm 14% Yes
(2006-2010) (2005) (2010)
12th 95.2 bcm 156.5 bcm 10.5% 135 bcm 7.2% No
(2011-2015) (2010) (2015)
13th 135 bcm 207 bcm 8.9% N/A 5% (2017) N/A
(2016-2020) (2015) (2020)
Source: Five-Year plans from #10 to #13
8
EPRINC China’s Search for Blue Skies: Understanding LNG’s Role
Page 7IMPORTANT ACTORS IN THE SECTOR
China’s gas sector development in the past (SOEs) have dominated the entire sector with
decade can be attributed to state policy driven by little competition from other public and private
social and health considerations rather than pure sector entities that have begun to appear in the
markets forces. The State Council and its agencies gas markets lately. The governance of the natural
strive to fulfill the environmental ambitions of the gas sector in China reflects the government’s
Communist Party of China (CPC) and have shown hierarchical structure (Figure 5), but competing
unwavering support for the natural gas sector policies and interests exist at different levels of the
in recent years. Large state-owned enterprises national and local governments.
Figure 5
Chinese Natural Gas Governance Structure
CPC
State Council
SASAC NDRC NEC Other Ministries
NOCs NEA Local DRCs
Oil & Gas Division Local Energy Bureaus
Bureaucracy to fall apart in 1993. During the 1990-2000 period, a
In China, a series of both centralizing multitude of ministries and planning commissions
and separating efforts were made in its energy were established. After the State Administration of
governance over the past decades.9 Its first attempt Coal Industry was formed under the State Economic
to centralize energy governance came with the and Trade Commission (SETC), the energy industry
establishment of the Ministry of Fossil Fuels was no longer overseen by a single super agency
in 1953. The ministry was then dismantled in at a ministerial level. The SETC went through a
1960 into separate ministries that specialized in number of changes and eventually became the
electricity, coal and petroleum. This process of National Development and Reform Commission
separation continued until the establishment of the (NDRC).
State Energy Commission to centralize the sector Today, the State Council10 holds the ultimate
in the mid-1980s. The Ministry of Energy replaced control over national issues and ensures the
previous ministries as a single unified agency, only cohesion of policy implementation across agencies.
9
Cunningham, Edward A. 2015. “The State and the Firm: China’s Energy Governance in Context.” GEGI Working Paper:
Paper 1 (March). pp. 1-44. https://ash.harvard.edu/files/chinas-energy-working-paper.pdf
10
According to the government website: “The State Council or the Central People’s Government, of the People’s Republic
of China is the executive body of the supreme organ of state power; it is the supreme organ of State administration.”
http://english.gov.cn/archive/china_abc/2014/08/23/content_281474982987314.htm
EPRINC China’s Search for Blue Skies: Understanding LNG’s Role
Page 8IMPORTANT ACTORS IN THE SECTOR continued
Under the State Council, however, there is no institution, the NEA relies on the NDRC in policy
single ministry overseeing national energy policy, implementation as well as when working with the
as energy policy formulation and implementation influential NOCs.14
are spread across several ministries. To address the
lack of unified oversight in energy, the National Other Government Institutions
Energy Commission (NEC) was created as the In addition to the institutions mentioned
highest energy consultative body in 2010. The above which directly manage natural gas, other
NEC formulates broad national energy strategies ministries are mandated to play a role in natural
and guidance11 and its membership includes gas and LNG policy. The Ministry of Commerce
the premier and over a dozen ministers from his conducts international trade negotiations on natural
cabinet.12 However, the NEC’s role does not exceed gas whereas the Ministry of Finance administers
its overly generic role as a consultative body; the a program subsidizing shale gas development.
institution has convened only a handful times since The latter ministry’s Customs Tariff Commission
its inception. imposed 10% sanctions on U.S. LNG amid the
China’s latest round of institutional reforms U.S.-China trade tensions in 2018.15 The Ministry
in March 2018 did not include a long-awaited, of Natural Resources oversees domestic production
specialized energy ministry. However, natural gas of natural gas and shale gas and grants land access
policies are currently in the hands of the powerful to LNG facilities.16 Because of the government’s
economic planning agency NDRC, which plays growing focus on environmental issues, the new
a major role in energy policy formulation and Ministry of Ecology and Environment (MEE) took
implementation. The NDRC issues the country’s control of departments formerly belonged to other
five-year plans, gives orders to the overall energy ministries17 and enforces the implementation
sector, manages natural gas utilization,13 sets of clean energy policy through measures such
prices, and gives approvals to the construction and as inspection of the “coal-to-gas” switch in
operations of LNG terminals, among other roles. Its households. The Ministry of Transport has a role to
sub-agency, the NEA, focuses on industrial policy play as well, due to its oversight of LNG vehicles
research and formulation and manages the day-to- and LNG bunkering policy.
day activities of the NEC. As a deputy-ministerial
11
Zhou, Yingfeng. 2010. “The Creation of the National Energy Commission succeeds the Institutional Reforms” (in
Chinese). Ifeng.com, January 27, 2010. http://finance.ifeng.com/news/special/gjnyw/20100127/1765925.shtml
12
Zhang, Yanling. 2018. “The State Council Makes Changes to the Personnel of the National Energy Commission” (in
Chinese). Chinanews.com, July 21, 2018. http://www.chinanews.com/gn/2018/08-02/8587746.shtml
13
NDRC. 2012. “Order of the National Development and Reform Commission of the People’s Republic of China: Natural
Gas Utilization Policy” (in Chinese). http://www.gov.cn/gongbao/content/2013/content_2313190.htm
14
Bao, Xing’an. 2010. “Zhang Guobao: The Energy Bureau is Small, But State-Business Relationships are Doing Well” (in
Chinese). Ifeng.com, February 4, 2010. http://finance.ifeng.com/news/special/gjnyw/20100204/1795458.shtml
15
Ministry of Finance. 2018. “Notice of the Customs Tariff Commission of the State Council on Adding Tariffs to Certain
Imported Goods Originating in the United States (Second Batch).”
http://gss.mof.gov.cn/zhengwuxinxi/zhengcefabu/201808/t20180803_2980950.html
16
Gov.cn. n.d. “Structure of the State Council.” http://www.gov.cn/guowuyuan/zuzhi.htm
17
Li, Jing. 2018. “China’s new environment ministry unveiled, with huge staff boost.” China Dialogue, April 19, 2018.
https://www.chinadialogue.net/article/show/single/en/10599-China-s-new-environment-ministry-unveiled-with-huge-
staff-boost
18
Ministry of Transport. 2018. “Letter from the General Office of the Ministry of Transport for the Opinions on
Deepening the Advancement of the Application of Liquefied Natural Gas in the Water Operation Industry (Draft for
Comment)” (in Chinese). http://zizhan.mot.gov.cn/zfxxgk/bnssj/syj/201808/t20180810_3056391.html
EPRINC China’s Search for Blue Skies: Understanding LNG’s Role
Page 9IMPORTANT ACTORS IN THE SECTOR continued
The Big Three and Other Enterprises first two were born when upstream and downstream
The Chinese natural gas industry is oil enterprises’ ownership rights were separated
characterized by an oligopolistic structure, from the Ministry of Petroleum Industry (MPI)
dominated by three major national oil companies in the 1980s as part of its corporatization efforts.
(NOCs),19 or the “Big Three”: China National CNOOC was established under MPI in 1982 for
Petroleum Corporation (CNPC), China Petroleum collaboration with foreign enterprises on offshore
and Chemical Corporation (Sinopec), and China business activities.21
National Offshore Oil Corporation (CNOOC).20 The
Figure 6
China’s Domestic Natural Gas Production by NOCs (2017)22
19
With the increasing share of natural gas in their portfolio, the SOEs should now be referred to as national oil and gas
companies (NOGCs). However, we use the established term, NOCs, in this report.
20
The NOCs are under the State-owned Assets Supervision and Administration Commission (SASAC), a powerful
agency directly under the State Council. Tang, Changwei. 2016. “Globalized economy and the Chinese national oil
companies.” IIAS Newsletter: No. 74 (Summer). https://iias.asia/sites/default/files/IIAS_NL74_07.pdf
21
Downs, Erica S. 2010. “Who’s Afraid of China’s Oil Companies?” In Energy Security: Economics, Politics, Strategy, and
Implications, pp. 73-102. Brookings Institution Press.
https://www.brookings.edu/research/whos-afraid-of-chinas-oil-companies/
22
Data derived from the 2017 annual reports and other documents of CNPC, Sinopec, and CNOOC
EPRINC China’s Search for Blue Skies: Understanding LNG’s Role
Page 10IMPORTANT ACTORS IN THE SECTOR continued
Figure 7
China’s LNG Imports by NOCs (2017)23
Initially, the NOCs were separated by volume, CNOOC is the principal player in LNG
specialization in onshore upstream production, imports. Controlling half of the LNG receiving
refining, and offshore oil and gas exploration. terminals in the country, CNOOC imported 54% of
However, the NOCs entered all areas of the gas total LNG in 2017 and reportedly helped stabilize
industry and the distinction between the companies LNG pricing between RMB 4,500-5,100/ton at peak
has waned over the years. Producing 103.3 bcm demand (Figure 7).26 CNPC and Sinopec are playing
in 2017 (Figure 6), CNPC plays a dominant role increasingly important roles in LNG as well, each
in domestic natural gas production,24 followed by showing 84.30% and 43.70% increases in LNG
Sinopec’s 25.84 bcm25 and CNOOC’s 14.3 bcm. imports year-on-year in 2017, respectively.
Although the smallest in terms of production
23
Data derived from the 2017 annual reports and other documents of CNPC, Sinopec, and CNOOC
24
Chengcheng. 2018. “CNPC reports record-high domestic natural gas output at over 100 billion cubic meters.”
Xinhuanet, February 8, 2018. http://www.xinhuanet.com/english/2018-02/08/c_136959638.htm
25
Sinopec 2017 Annual Report and Accounts. pp.12-22.
http://www.sinopec.com/listco/en/Resource/Pdf/20180325036.pdf
26
CNOOC 2017Annual Report. pp. 29-37. http://www.cnooc.com.cn/attach/0/1806141618435805115.pdf
EPRINC China’s Search for Blue Skies: Understanding LNG’s Role
Page 11IMPORTANT ACTORS IN THE SECTOR continued
The NOCs pursued commercialization and city-gas operators, power plants, integrated
international collaboration by creating companies groups and other public and private enterprises
that then were listed on international exchanges. in the industry. These companies have a relative
PetroChina (82.6% owned by CNPC)27, CNOOC advantage over market security, with access to
Limited (64.4%, CNOOC)28, and Sinopec Limited secured markets with high affordability, proximity
(70.9%, Sinopec)29 are listed on the New York and to end users, and existing distribution channels.
Hong Kong Stock Exchanges and oversee their Although these entities have made significant
parent company’s core natural gas operations, progress with local government backing as well
including offshore activities, exploration and as through cooperation with outside partners,
production, pipeline transportation and sales. they are far from competing head-to-head against
However, because the Central Organization the NOCs. SIA Energy reports that the second-
Department of the CPC holds the ultimate rights tier companies are still weaker than the NOCs in
to appoint or dismiss top executives, the NOCs government support, infrastructure access, financial
are heavily influenced by the party.30 On the capability, and professional experience. Disparity
other hand, by leveraging their ties with the party between support from local governments and the
NOC executives influence state policy during its central government and a lack of financial resources
deliberation.31 This has led to corruption cases and professional experience discourage them
linked to some executives in the past.32 The IEA from competing against the NOCs.34 The second-
advised that loosening the links between the NOCs’ tier players are importing LNG in two ways: 1)
leadership and the CPC may help reduce the NOCs’ constructing their own LNG receiving terminals, or
influence over the NEA and NDRC’s decisions. 2) leasing the NOCs’ LNG receiving terminals.
Improvements in the efficiency of the SOEs can also Construction of receiving terminals is the
happen through competition and increased market main indicator of private sector participation. LNG
share of private entities.33 terminals with capacity above three mtpa require
the NDRC’s approval, whereas smaller terminals
Emerging Role of Second-Tier Players only need that of local authorities. A number of
The emergence of so-called “second-tier” entities including Zhejiang Energy, China Huadian,
LNG players has begun to challenge the Big Three’s and Guanghui Energy have planned or proposed
monopoly, thanks to the government’s liberalization terminal projects. Even midstream public utilities
efforts and individual provinces’ strategies to are entering the business, for example Beijing Gas
lessen their dependence on the NOCs. Second-tier plans to construct its own receiving terminal near
companies are provincial distribution companies, Tianjin.35 Nevertheless, acquiring permissions
27
PetroChina 2017 Annual Report.
28
CNOOC Limited 2017 Annual Report.
29
Sinopec Limited 2017 Annual Report.
30
Tang, Changwei. 2016. “Globalized economy and the Chinese national oil companies.” IIAS Newsletter: No. 76
(Summer). https://iias.asia/sites/default/files/IIAS_NL74_07.pdf
31
The executives also head the party committee of their respective companies and remain influential within the
government even after leaving the company. Cunningham, Edward A. 2015. “The State and the Firm: China’s Energy
Governance in Context.” GEGI Working Paper: Paper 1 (March). pp. 20-21.
https://ash.harvard.edu/files/chinas-energy-working-paper.pdf
32
Former CNPC executives Zhou Yongkang and Jiang Jiemin and Sinopec’s Su Shulin were expelled from the CPC and
put in jail for corruption cases.
33
Zhang, Dong, and Owen Freestone. 2017. “China’s Unfinished State-Owned Enterprise Reforms.” p. 3.
https://static.treasury.gov.au/uploads/sites/1/2017/06/5-China-SOE-reforms.pdf
34
Li, Yao. 2016. “China’s Emerging 2nd Tier LNG Players and LNG Import Capacity Outlook.” SIA Energy: China LNG
International Summit. p.9. https://asiapacific.cwclng.com/wp-content/uploads/2016/07/SIA-Energy_Yao-Li_Tier-2-
Chinese-Players-and-LNG-Terminal-Capacity-Outlook_201603161.pdf
35
Chen, Aizhu, and Meng Meng. 2018. “China’s Beijing Gas Figures new direction under helm of Madame Li.” Reuters,
August 2, 2018. https://www.reuters.com/article/us-china-pollution-gas-madame/chinas-beijing-gas-Figures-new-
direction-under-helm-of-madame-li-idUSKBN1KN30Z
EPRINC China’s Search for Blue Skies: Understanding LNG’s Role
Page 12IMPORTANT ACTORS IN THE SECTOR continued
from authorities is challenging and private entities reform commissions and energy bureaus. These
oftentimes fail to meet the requirements such authorities complement national policy with
as attracting enough capital. Today, only three documents suited for their respective localities.
private LNG receiving terminals have been put into Their responsibilities include issuing five-year
operation and only ENN’s LNG receiving terminal plans for energy development, granting permissions
has a capacity of three mtpa, as many other private- for the construction of LNG receiving terminals,
sector-funded projects are kept in the approval and set local natural gas distribution prices. Local
process.36 authorities in the northern regions, including
Leasing the NOCs’ LNG terminals as a third- Beijing and Hebei, pioneered the implementation
party entity liberates private entities from strict of the “coal-to-gas” switching in heating. However,
construction requirements and large upfront capital overly ambitious environmental plans at the
investments. Depending on the owning company’s national level put a strain on local governments
use of its terminal, third-party entities must wait and households. As a result of the NDRC’s decision
for a window of availability. Third-party imports to convert four million households from coal to
constituted 3% of receiving capacity of the CNPC gas in the winter of 2017, natural gas supplies
terminals from 2014 to 2016.37 With tightened became extremely tight, prices surged, and some
supply and a small window of availability, no households and schools had to endure a cold
third-party leases were granted by the Big Three winter without enough heating facilities. In 2018,
in 2017.38 The NDRC is stepping up their effort to the national government set a target to convert
address this issue and allow open and third-party another four million households to natural gas and
access to LNG infrastructure. electricity. However, this was met by opposition
from some local authorities as they considered
Local Authorities this plan unfeasible. For instance, Hebei province,
The coordination between national and which converted a massive 2.54 million households
local authorities is important, but the NDRC has to clean-energy in 2017, stated that no more
been slow to consider local conditions in its households would be required to convert to natural
policy formulation. Like the NDRC and the NEA, gas or electricity in 2018.39
the provinces have their own development and
36
Li, Qian. 2018. “Private Enterprises’ Participation in LNG Receiving Stations” (in Chinese). People.cn, April 9, 2018.
http://paper.people.com.cn/zgnyb/html/2018-04/09/content_1847151.htm
37
Sohu. 2018. “Understanding the LNG Industry, Pricing Mechanism, and Profitability” (in Chinese). Sohu, August 1,
2018. http://www.sohu.com/a/244536796_117959
38
Li, Qian. 2018. “Private Enterprises’ Participation in LNG Receiving Stations” (in Chinese). People.cn, April 9, 2018.
http://paper.people.com.cn/zgnyb/html/2018-04/09/content_1847151.htm
39
Zhou, Tailai, Chen Zhou, and Rongde Li. 2018. “4 Million North China Homes Told to Kick Coal Habit as Nation Seeks
Blue Skies.” Caixin, February 8, 2018. https://www.caixinglobal.com/2018-02-08/4-million-north-china-homes-told-to-
kick-coal-habit-as-nation-seeks-blue-skies-101209259.html
EPRINC China’s Search for Blue Skies: Understanding LNG’s Role
Page 13CURRENT MARKET ENVIRONMENT
China’s energy policy has traditionally in 2017,40 and Chinese natural gas consumption
emphasized production of domestic reserves as reached 237.3 bcm in 2017, up 15% year-on-year
opposed to relying on imports. This policy is part of (y-o-y).41 Domestic production is still able to supply
the reason why the energy mix has been so focused most of the nation’s consumption of natural gas,
on oil and coal, but that will change in the near however as China needs to replace coal and oil in
future. Total proven reserves of Chinese natural the energy mix, they will need to increase imports
gas amount to 5.52 trillion cubic meters (cu.m) of natural gas to make up the difference.
and total domestic gas production of 148.7 bcm
Figure 8
Composition of Energy Consumption, 1990-2016 (%)42
BP (2018), p. 26
40
Abreu, Abache. 2018. “Analysis: China’s expanding underground gas storage may reduce LNG winter price volatility.”
41
S&P Global Platts, July 13, 2018. https://www.spglobal.com/platts/en/market-insights/latest-news/natural-gas/071318-
analysis-chinas-expanding-underground-gas-storage-may-reduce-lng-winter-price-volatility
EPRINC China’s Search for Blue Skies: Understanding LNG’s Role
Page 14CURRENT MARKET ENVIRONMENT continued
As shown in Figure 9 below, industry growth) in 2017, outpacing South Korea as the
usage constituted almost two-thirds of total second largest importer of LNG.43 The share of
consumption in 2015, followed by households natural gas in total energy mix remains at 7.5%,44
(18.6%) and transport (12.3%). While the former while coal and oil continue to dominate 80% of
lost 17 percentage points in 2000-2015, transport total consumption (Figure 8),45 but as the state and
and households showed rapid growths of nine local governments continue to promote natural gas
and five percentage points, respectively. Mainly in households, we anticipate further growth in the
driven by the Chinese government’s decision for share of households in natural gas consumption and
households to switch from coal to gas, the country’s LNG demand.
LNG imports increased to 38.1 million tons (42%
Figure 9
Natural Gas Consumption by Sector, 2000-2015 (bcm)46
42
National Bureau of Statistics of China
43
Zaretskaya, Victoria. 2018. “China becomes world’s second largest LNG importer, behind Japan.” U.S. Energy
Information Administration, February 23, 2018., https://www.eia.gov/todayinenergy/detail.php?id=35072
44
National Energy Administration. 2018. “Notice of the National Energy Administration on Printing and Distributing the
Guiding Opinions on Energy Work in 2018.” http://www.gov.cn/xinwen/2018-03/09/content_5272569.htm
45
Data derived from the BP Statistical Review of World Energy. 2018.
https://www.bp.com/content/dam/bp/en/corporate/pdf/energy-economics/statistical-review/bp-stats-review-2018-full-
report.pdf
46
Data derived from the National Bureau of Statistics of China. http://data.stats.gov.cn/english/easyquery.htm?cn=C01
EPRINC China’s Search for Blue Skies: Understanding LNG’s Role
Page 15CURRENT MARKET ENVIRONMENT continued
Environmental and Climate Factors Air Pollution
Environmental pollution and seasonal Chinese natural gas policy is motivated by
fluctuations play important roles in China’s the need to reduce air pollution, a contributory
natural gas sector in the short and long run. Air source of respiratory infections, heart disease, and
pollution prompted the country to commit to lung cancer, among others.47 Due to excessive coal
energy technologies with low air emissions, and consumption, Chinese cities have been exposed
China’s environmental policies have moved to to smog with high levels of PM 2.5. Prior research
soil and water pollution as well. Climate volatility suggests that in 2004-2008, respiratory deaths per
plays a more direct role in determining the level 10,000 people in Shanghai and Beijing were 2.86
of consumption in the short run. China’s sudden and 2.25, respectively, much higher than in the less
increase in demand in recent years due to colder urbanized Tibet (.05) and Gansu (.17).48
than usual winters led to some spikes in prices in
the Asian LNG market.
Figure 10
PM 2.5 Air Pollution, Mean Annual Exposure in China (micrograms/cm)49
47
World Health Organization. n.d. “Air pollution.”
http://www.wpro.who.int/china/mediacentre/factsheets/air_pollution/en/
48
Cao, Qilong, Ying Liang, and Xueting Niu. 2017. “China’s Air Quality and Respiratory Disease Mortality Based on the
Spatial Panel Model,” International Journal of Environmental Research and Public Health, p.8.
49
World Bank. 2016. “PM2.5 air pollution, mean annual exposure (micrograms per cubic meter).”
https://data.worldbank.org/indicator/EN.ATM.PM25.MC.M3?locations=CN
EPRINC China’s Search for Blue Skies: Understanding LNG’s Role
Page 16CURRENT MARKET ENVIRONMENT continued
Increasing social unrest and demonstrations at the current trend, air pollution in cities would
against pollution drew heightened government remain a central concern of the CCP.
attention. In accordance with the State Council’s
2013 Action Plan on Prevention and Control of Seasonal Climate Variations
Air Pollution,50 China plans on maintaining total Given tight supply and limited global spare-
coal power capacity below 1100 GW by 2020. gas capacity, weather fluctuations significantly
As a result, the number of “smoggy days” in the contribute to Chinese natural gas market volatility.53
Beijing-Tianjin-Hebei area dropped from 71.1 in That is, natural gas consumption in China is high in
2013 to 42.3 in 2017.51 According to the World the colder months of the year, surging in November
Bank, the PM 2.5 level peaked in 2010, but there until sharply dropping in spring (Figure 11). This is
have not been substantial decreases at nationwide associated with price surges and supply shortages
levels (Figure 10). Furthermore, because the State and has become a headache for the natural gas
Council’s environmental focus is shifting beyond sector, most profoundly in the winter of 2017. Data
atmospheric pollution to include other types of from the State-Owned Assets Supervision and
pollution,52 the main environmental motive for Administration Commission (SASAC) indicates that
natural gas consumption is not likely to diminish the average peak-to-valley ratio between summer
any time soon. As we estimate urban population to and winter consumption reached 1.71.54 It is
surpass the one-billion threshold in 2025-2028 imperative for China to expand its peak shaving and
LNG receiving capacity to address this challenge.
Figure 11
Bimonthly Domestic Gas Production 2013-2017 (bcm)55
50
State Council. 2013. “Notice of the State Council on Printing and Distributing the Action Plan for Air Pollution
Prevention and Control” (in Chinese). http://www.gov.cn/zwgk/2013-09/12/content_2486773.htm
51
China Daily. 2018. “Four years on: Beijing-Tianjin-Hebei coordinated development.” ChinaDaily, February 27, 2018.
http://www.chinadaily.com.cn/a/201802/27/WS5a949ab4a3106e7dcc13e348_1.html
52
This is echoed in the State Council’s 2018 “Opinion on Strengthening Ecological Protection and Pollution Prevention.”
53
Bros, Thierry. 2018. “Quarterly Gas Review Analysis of Prices and Recent Events.” Oxford Institute for Energy Studies:
March 2018.
54
CNPC. 2017. “2017 China’s Natural Gas Development White Paper: Promoting Natural Gas as a Main Energy Source.”
SASAC, August 21, 2018. http://www.sasac.gov.cn/n2588025/n2588124/c7767721/content.html
55
Data derived from the National Bureau of Statistics of China http://data.stats.gov.cn/english/easyquery.htm?cn=A01
EPRINC China’s Search for Blue Skies: Understanding LNG’s Role
Page 17CURRENT MARKET ENVIRONMENT continued
Current Policy and Implementation proposed to increase the share of natural gas in total
China’s natural gas and LNG policy is directly energy mix from 6% to 10%, while decreasing coal
linked to its environmental and clean energy efforts from 64% to 58% in the period from 2015 to 2020.
reflected in the current 13th Five-Year Plan (2016- Internationally, China pledged to make natural
2020) and documents such as the 2018 Action Plan gas one of the main energy sources by 2030 in
to Win the Battle for Blue Skies. The 13th Plan accordance with the UN Sustainable Development
states that an increase in the share of natural gas in Goals. 56 Some significant goals and progresses are
the country’s energy mix is “the only way” to create outlined in Table 2 below.
a clean, efficient energy system. The document
Table 2
Natural Gas Provisions of the 13th Five-Year Plan Goals57 and Progress
Goals Progress
Promote market access and implement fair access In 2018, the NDRC issued a draft policy for
to infrastructure Third-Party Access to LNG facilities. CNOOC for
the first time awarded a regasification slot at its
Yuedong terminal via the Shanghai hub.
Set up a market-based price mechanism; reform The NDRC has undertaken a series of pricing re-
the price of non-residential and residential gas forms for residential and non-residential users. The
price parity between different classes is minimized
and a wholesale market pricing mechanism is pro-
moted to a certain extent. Initial efforts were made
in regional gas pricing hubs in China.
Expand the storage capacity of existing LNG Some LNG terminals’ storage capacity has already
receiving terminals; build new terminals in areas been expanded and more facilities like the Ningbo
with high demand (i.e., the Bohai Economic Rim58 terminal expect expansion. Since 2016, five new
and the Yangtze River Delta Economic Zone59) LNG receiving terminals have been put into oper-
ation and over five terminals are approved by the
NDRC or under construction. These new projects
largely conform to the geographical specifications
of the five-year plan.
Replace coal-fired boilers and industrial kilns In 2017, nearly four million households upgraded
with natural gas facilities in large cities their coal-fired boilers and other facilities with
cleaner-burning natural gas facilities in the north-
ern regions such as Hebei province.60
Support natural gas vehicles, including In 2017, a fleet of 200,000 natural gas-fueled public
LNG-fueled vehicles and LNG-fueled transport transport vehicles were added in Beijing. The Min-
ships istry of Transport has announced its intention to
use LNG as a clean marine bunker fuel and develop
necessary standards and network by 2020.
56
Ministry of Foreign Affairs of PRC. 2016. “China’s National Plan on the Implementation of the 2030 Agenda for
Sustainable Development.” p.33. https://www.fmprc.gov.cn/web/zyxw/W020161012709956344295.pdf
57
National Development and Reform Commission of China. The 13th Five-Year Plan for Economic and Social
Development of the People’s Republic of China.”
58
Economic area including Beijing and Tianjin and surrounding areas.
59
Economic area in the Yangtze River Delta region including Shanghai city and Jiangsu, Anhui and Zhejiang provinces.
60
Wang, Changyu. 2018. “Institute of Building Environment and Energy Efficiency, China Academy of Building Research
Director Xu Wei’s Remarks.” Cnenergy.org, August 27, 2018.
http://www.cnenergy.org/yw/201808/t20180827_685175.html
EPRINC China’s Search for Blue Skies: Understanding LNG’s Role
Page 18CURRENT MARKET ENVIRONMENT continued
The five-year plans are supplemented by a and open and fair access to pipeline and LNG
number of policies at the national and local levels. facilities.
“Winter Clean Heating Planning in the Northern
Region” (2017-2021), one of the national policies, Projections Through 2020
imposed restrictions on heating emissions in two A combination of slow development in
municipalities and 26 cities in the coal-ridden unconventional production and delays in the
northern region and planned a 23 bcm increase in implementation of PNG import projects, the share
gas heating. The policy was bolstered by the action of natural gas in the total energy mix will likely
plan to “Win the Battle for Blue Skies” (2018- fall below the NDRC’s target for 2020. The future
2020), which prioritizes urban areas with severe air consumption and imports of LNG is contingent
pollution. At the local level, provincial authorities upon natural gas infrastructure development as
set their own targets tailored to local conditions. well as the construction of LNG terminal projects.
The Hong Kong Special Administrative Region, for China projects the share of natural gas in its energy
example, was targeted to raise the share of natural mix to increase to a range of 8.3%-10%, at around
gas to 50% in its total energy mix while the coal- 353-391 bcm, provided that China manages to limit
dependent Hebei aimed at only 10% in this five- its annual energy consumption within five billion
year plan period. These national and local policies tons of Standard Coal Equivalent (or within 3%
in large part have successfully complemented one annual growth) by 2020.62 For this, China must
another. achieve 13.3% annual average growth in its demand
China’s natural gas policy can be divided from the 2015 level of 193.1 bcm. Real demand
into three main goals — increased use of natural is projected to fall short of this by 2.4 percentage
gas in a coordinated manner, supply side security, points, with the 2018 consumption estimated at
and market-based reforms.61 Increased natural 263.5 bcm.63 In other words, Chinese consumption
gas consumption focuses on growths in reserves is projected to be around 325-330 bcm, slightly
and production, better infrastructure, and below the national target.64
interconnectivity of distribution and transmission In 2016 and 2017, the annual average growth
systems. Additionally, the continuation of the of domestic gas production was only 5%. As of
“coal to gas” switching policy, the introduction of October 2018, China produced 129.5 bcm, up 6.9%
greater distributed natural gas generation, and a y-o-y.65 Given the lagging historical performance of
widespread use of natural gas and LNG vehicles natural gas production, it is likely that domestic
and filling stations all play an important role in output will not exceed 179.3 bcm in 2020 as
increased consumption. For supply side security, contrasted to the five-year plan’s projection of 207
improved peak-shaving systems and construction bcm. PNG imports will likely sustain their recent
of pipeline and LNG receiving facilities as well as growth rate and reach approximately 48.3 bcm in
increased storage capacity are prioritized. The third 2020. If completed in late 2019, however, the Power
main goal, pricing and market reforms, is complex of Siberia pipelines are expected to add up to 5
and has a number of facets: the promotion of direct bcm of PNG imports in the first year. Given that
transactions between suppliers, further reforms domestic natural gas growth has been lagging and
towards a more market-based pricing mechanism, remains insufficient to meet the 30 bcm goal, there
61
2018 Energy Work Guidance of China.
62
Standard coal equivalent. One-ton SCE equals approximately 786.6 bcm natural gas.
63
In 2016 and 2017, China showed an 11.1% annual average growth. NDRC. Regular press conference on October 23,
2018. http://www.china.com.cn/zhibo/content_67728050.htm
64
This is not far from Wood Mackenzie’s forecast that the Chinese natural gas consumption to grow to 330 bcm by 2020.
Wood Mackenzie. 2017. “Will Trump’s Beijing trip win some LNG deals for the US?”
https://www.woodmac.com/press-releases/will-trumps-beijing-trip-win-some-lng-deals-for-the-us/
65
The National Bureau of Statistics of China.
EPRINC China’s Search for Blue Skies: Understanding LNG’s Role
Page 19You can also read