Choice Screen Auctions - Michael Ostrovsky Stanford University and NBER May 27, 2021
←
→
Page content transcription
If your browser does not render page correctly, please read the page content below
Choice Screen Auctions
                                           Michael Ostrovsky∗
                                     Stanford University and NBER
                                        ostrovsky@stanford.edu

                                                May 27, 2021

                                                   Abstract

           Choice screen auctions have been recently deployed in 31 European countries, allowing con-
       sumers to choose their preferred search engine on Google’s Android platform instead of being
       automatically defaulted to Google’s own search engine. I show that a seemingly minor detail
       in the design of these auctions—whether they are conducted on a “per appearance” or a “per
       install” basis—plays a major role in the mix and characteristics of auction winners, and, conse-
       quently, in their expected overall market share. I also show that “per install” auctions distort
       the incentives of alternative search engines toward extracting as much revenue as possible from
       each user who installs them, at the expense of lowering the expected number of such users. The
       distortion becomes worse as the auction gets more competitive and the number of bidders in-
       creases. Empirical evidence from Android choice screen auctions conducted in 2020 is consistent
       with my theoretical results.

   ∗
    I thank John Asker, Anirudha Balasubramanian, Jeremy Bulow, Jacques Crémer, Antoine Dubus, Megan Gray,
Ginger Jin, Aurélien Mähl, Suraj Malladi, Preston McAfee, Katie McInnis, David Salant, Tim Schumacher, Andy
Skrzypacz, Hal Varian, Frank Yang, and seminar participants at Stanford, the University of Maryland–FTC joint
workshop, the 2021 NBER IO Winter Meeting, the 2021 International Industrial Organization Conference, and the
Sixth Marketplace Innovation Workshop for helpful comments and suggestions. The opinions expressed in this paper
are my own, and do not necessarily reflect those of the organizations with which I am currently affiliated or have
been affiliated in the past.
1 Introduction
Optimal regulation of digital platforms is one of the thorniest issues in competition policy. A
particularly challenging dimension for regulation is the fact that dominant platforms are often active
in multiple distinct businesses and may leverage their position in one area into gaining an advantage
in another. The net effect of such leverage on consumer welfare is often ambiguous and hard to
determine. On one hand, a dominant platform’s expertise and technological complementarities may
make the adjacent product genuinely superior to the alternatives. On the other hand, such leverage
may make it harder for other firms to successfully compete, even if their products, on their own,
would be preferred by some consumers to that of the platform.
These linkages across product lines have led regulators to sometimes propose extreme measures
to regulate large digital platforms, all the way to breaking them up and prohibiting them from
entering certain lines of business. Notable examples in the U.S. include the Microsoft case of the
late 1990s, in which the initial court decision was to break up the company,1 and the recently
concluded congressional investigation into the business practices of Amazon, Apple, Facebook, and
Google, which proposes “structural separations and line of business restrictions” as a solution for
“restoring competition in the digital economy.”2 Regulators in the European Union and other parts
of the world have often reached similar conclusions. Of course, the breakup of a company is a very
heavy-handed solution, difficult to implement, rife with potential unintended consequences, and,
unsurprisingly, adamantly opposed by the digital platforms.3
In light of these problems, platforms and regulators have, in some cases, adopted a more
“lightweight” alternative as a compromise solution: choice screens. The logic of a choice screen is
straightforward: instead of having the consumer use the dominant platform’s product automati-
cally and by default, the platform agrees to present the consumer with a menu of choices. This
menu includes the platform’s own product as one of the options, but also includes several competing
products as alternatives. Consumers can then choose whichever products they prefer, leveling the
playing field between the dominant platform and its competitors.
Choice screens for Web browsers on the Windows platform were first proposed by Microsoft in
1999 as a remedy in its negotiations with the U.S. Department of Justice.4 They were not adopted
1
United States v. Microsoft Corp., 97 F. Supp. 2d 59 (D.D.C. 2000), https://law.justia.com/cases/federal/
district-courts/FSupp2/97/59/2339529/.
2
“To address this underlying conflict of interest, Subcommittee staff recommends that Congress consider legislation
that draws on two mainstay tools of the antimonopoly toolkit: structural separation and line of business restrictions.
Structural separations prohibit a dominant intermediary from operating in markets that place the intermediary in
competition with the firms dependent on its infrastructure. Line of business restrictions, meanwhile, generally limit
the markets in which a dominant firm can engage.” (Section VI.A.I, https://judiciary.house.gov/uploadedfiles/
competition_in_digital_markets.pdf.)
3
To give just one recent example (out of many available ones): “A government effort to break up Facebook Inc. from
Instagram and WhatsApp would defy established law, cost billions of dollars and harm consumers, according to a
paper company lawyers have prepared in the wake of rising antitrust legal threats. [. . . ] In the paper, Facebook says
unwinding the deals would be nearly impossible to achieve, forcing the company to spend billions of dollars maintaining
separate systems, weakening security and harming users experience.” (https://www.wsj.com/articles/facebook-
says-government-breakup-of-instagram-whatsapp-would-be-complete-nonstarter-11601803800.)
4
https://www.wired.com/2000/11/microsoft-7/.
1at that time, but were subsequently accepted as a compromise solution between the European
Commission and Microsoft in 2009, and were displayed to users in Europe from 2010 until 2014.5
(Due to a technical error, the choice screen was not displayed on one of the versions of Windows
from May 2011 to July 2012, affecting approximately 15 million users. Microsoft admitted its
responsibility for this error and was subsequently fined e561 million.6 ) In 2017, Google reached a
settlement with the competition authority in Russia to display choice screens for the default search
engine on the Android platform there.7 A similar agreement was reached between Google and the
European Commission following a e4.3 billion fine imposed on the company by the Commission
in 2018,8 and Google began displaying choice screens for both default search engines and web
browsers to Android users in Europe in 2019.9 An analogous solution is now being considered by
the Australian Competition & Consumer Commission.10
Choice screen menus can be an effective and powerful tool. For instance, following the 2010
introduction of browser choice screen menus on the Windows platform in Europe, the number of
downloads of Opera Software’s web browser more than doubled.11 Discussing Google’s introduc-
tion of choice screen menus on Android, the European Commissioner for Competition, Margrethe
5
“Under the commitments approved by the Commission, Microsoft will make available for five years in the Eu-
ropean Economic Area [. . . ] a “Choice Screen” enabling users of Windows XP, Windows Vista and Windows 7 to
choose which web browser(s) they want to install in addition to, or instead of, Microsoft’s browser Internet Explorer.
...
The Commission’s preliminary view was that competition was distorted by Microsoft tying Internet Explorer to
Windows. This was because it offered Microsoft an artificial distribution advantage not related to the merits of its
product on more than 90 per cent of personal computers. Furthermore, the Commission’s preliminary view was that
this tying hindered innovation in the market and created artificial incentives for software developers and content
providers to design their products or web sites primarily for Internet Explorer.
The approved commitments address these concerns. PC users, by means of the Choice Screen, will have an effective
and unbiased choice between Internet Explorer and competing web browsers. This should ensure competition on the
merits and allow consumers to benefit from technical developments and innovation both on the web browser mar-
ket and on related markets, such as web-based applications.” (https://ec.europa.eu/commission/presscorner/
detail/en/IP_09_1941.)
6
https://ec.europa.eu/commission/presscorner/detail/en/IP_13_196.
7
https://www.reuters.com/article/us-alphabet-google-russia-idUSKBN17J11C, https://yandex.com/
blog/yacompany-com/choosing-yandex-search-on-android.
8
“The Commission decision has concluded that Google has engaged in two instances of illegal tying:
First, the tying of the Google Search app. As a result, Google has ensured that its Google Search app is pre-installed
on practically all Android devices sold in the EEA. Search apps represent an important entry point for search queries
on mobile devices. The Commission has found this tying conduct to be illegal as of 2011, which is the date Google
became dominant in the market for app stores for the Android mobile operating system.
Second, the tying of the Google Chrome browser. As a result, Google has ensured that its mobile browser is
pre-installed on practically all Android devices sold in the EEA. Browsers also represent an important entry point for
search queries on mobile devices and Google Search is the default search engine on Google Chrome. The Commission
found this tying conduct to be illegal as of 2012, which is the date from which Google has included the Chrome
browser in its app bundle.” (https://ec.europa.eu/commission/presscorner/detail/en/IP_18_4581.)
9
https://www.blog.google/around-the-globe/google-europe/presenting-search-app-and-browser-
options-android-users-europe/.
10
“The ACCC is seeking submissions from consumers and industry participants about choice screens, which give
users a choice of internet search services on mobiles and tablets, rather than a pre-selected search service, and
about the supply of web browsers in Australia.” (https://www.accc.gov.au/media-release/feedback-sought-
on-choice-and-competition-in-internet-search-and-web-browsers.)
11
https://press.opera.com/2010/03/18/opera-more-than-doubles-download-numbers-in-europe-after-
choice-screen-introduction/.
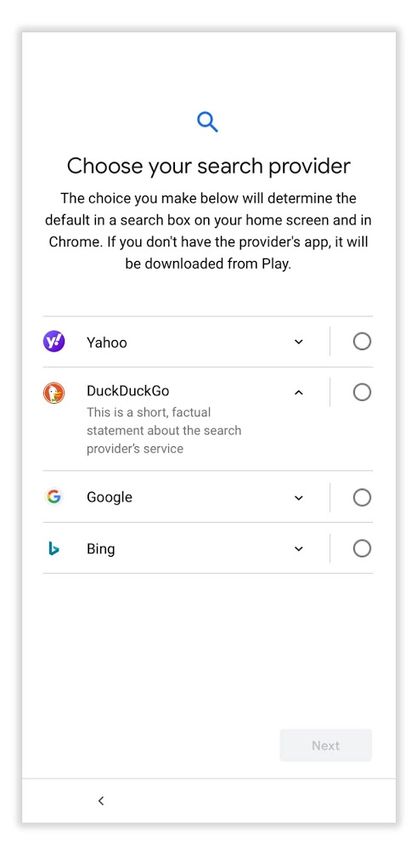
2Figure 1: Android Choice Screen
Vestager, stated, “We’ve seen in the past that a choice screen can be an effective way to promote
user choice.”12 However, from the point of a company that owns the platform, the initial imple-
mentations of choice screen menus suffered from one serious shortcoming: zero revenue. This may
be a particularly salient issue in the case of search engines. First, being chosen by a consumer is
extremely valuable to a search engine due to the advertising revenues it expects to receive when the
consumer uses it. Second, the dominant company itself may be making large payments to another
platform to have consumers use its search engine there.13 In this case, it is logical for the company
to argue that it should be allowed to charge others for the right to have their products be shown
on its platform’s choice screens—and a natural way to do so is via an auction.
12
https://ec.europa.eu/commission/presscorner/detail/en/STATEMENT_19_1774.
13
While the companies do not directly disclose these numbers, analysts estimate that Google is paying Ap-
ple on the order of $8–$12 billion per year to have Google be the default search engine on Apple’s Safari
browser (https://www.npr.org/2020/10/22/926290942/google-paid-apple-billions-to-dominate-search-on-
iphones-justice-department-says). It is worth noting that this agreement itself has also been a subject of recent
regulatory scrutiny (https://www.justice.gov/opa/press-release/file/1328941/download). Similarly, Google is
paying an estimated $400–$450 million per year to Mozilla to be the default search engine on the Firefox browser
(https://www.zdnet.com/article/sources-mozilla-extends-its-google-search-deal/).
3That is the decision that Google announced in August 2019,14 and the first “choice screen
auctions” took place in early 2020 (see Figure 1 for an illustration of an Android choice screen).
The basic rules of Google’s choice screen auctions are very simple.
In each country auction, search providers will state the price that they are willing to
pay each time a user selects them from the choice screen in the given country. The three
highest bidders will appear in the choice screen for that country. The provider that is
selected by the user will pay the amount of the fourth-highest bid.15
In the same document, Google explains why it chose to auction off slots in the choice screen this
way:
Q: Why does Google use an auction to determine the search providers that appear in
the choice screen?
A: An auction is a fair and objective method to determine which search providers are
included in the choice screen. It allows search providers to decide what value they place
on appearing in the choice screen and to bid accordingly.
The auction revenues help us to continue to invest in developing and maintaining the
Android platform.
In this paper, I show that a seemingly minor detail of the implementation of choice screen
auctions plays a major role in their outcomes—and thus in the overall effectiveness of the antitrust
remedy. Specifically, while the answer in the Q&A section of the document states that an auction
“allows search providers to decide what value they place on appearing in the choice screen and
to bid accordingly,” the auction, as implemented, charges these providers not for appearing in the
choice screen but for being chosen by a user.
While the difference may seem to be just a matter of language, it is not. To see the intuition
for the difference, consider a version of the auction with just one available spot and two bidders.
Bidder A gets revenue $10 from each user who installs its search engine, and if it is shown as an
option in the choice screen, then the probability that a user will choose it is 10%. Bidder B gets
revenue $20 from each user who installs its search engine, but the probability that a user will choose
it (if it is shown as an option in the choice screen) is only 1%. The value that bidder A has for
appearing on the screen is therefore $1, and the value that bidder B has for appearing on the screen
is $0.20. Thus, if the auction is conducted on the “per appearance” basis, then bidder A will win,
will pay $0.20 per appearance, and will have its search engine chosen by users 10% of the time,
while the dominant platform’s own search engine will be chosen 90% of the time. If, instead, the
auction is conducted as implemented, with bidding and payment on the “per install” basis, then
bidder B will win and will pay $10 every time its search engine is chosen (corresponding to $0.10
per appearance). The winner’s search engine will be chosen only 1% of the time, and the dominant
14
https://www.blog.google/around-the-globe/google-europe/update-android-search-providers-europe/.
15
https://www.android.com/choicescreen/.
4platform’s one will be chosen the remaining 99% of the time. Thus, relative to the per appearance
auction, the per install auction results in a lower likelihood that an alternative search engine will
be chosen by the user (making it correspondingly more attractive to the dominant platform) and
gives advantage to search engines that generate higher revenue per user vs. those that are more
popular but generate less revenue on a per-user basis. In Section 2, I show that these conclusions
hold more generally, in a basic model in which alternative search engines differ on two dimensions:
revenue per user (i.e., how much revenue the search engine generates, on average, when a user
chooses to install it) and popularity (i.e., the likelihood that the search engine will be chosen if it
is shown to the user in the choice screen). Moreover, I show that the difference is exacerbated by
competition. As the number of alternative search engines grows, under the per appearance auction,
the expected popularity of the winner also grows, and the probability that the dominant platform’s
own search engine is chosen decreases. By contrast, under the per install auction, these measures
are not affected by the number of bidders.
In the example above and in the model of Section 2, a search engine’s popularity and revenue per
user (RPU) are fixed. In practice, a search engine has some ability to trade them off against each
other. For instance, a search engine may choose to show more intrusive ads, increasing its revenue
per user but decreasing its popularity. Conversely, a search engine may donate some of its proceeds
to charity or implement very strict privacy rules, lowering its revenue per user but increasing the
probability that a user will choose it. I introduce this possibility in Section 3 and show that the
two auction formats result in very different incentives to the search engines regarding this tradeoff.
Under the per appearance auction, each bidder chooses the same point on the popularity–RPU
frontier as it would choose if it were the only bidder (and were thus guaranteed the spot on the
choice screen). In particular, this implies that just as in the model of Section 2, as the number
of competitors increases, the expected popularity of the winner also increases, and the expected
probability that the dominant platform’s search engine is chosen goes down. By contrast, under the
per install auction, each bidder has a strong incentive to distort the choice toward higher revenue
per each user who chooses the product, at the expense of lowering the probability of actually being
chosen. This distortion grows stronger as the number of bidders grows. In the limit, as that number
approaches infinity, the distortion results in a “race to the bottom,” with all bidders pushing to the
extreme point on the popularity–RPU frontier: the highest possible RPU and the lowest possible
popularity. As a result, the expected popularity of the winner goes in the opposite direction vs. that
in the case of the per appearance auction, minimizing the probability that an alternative search
engine will be chosen.
In Section 4, I present empirical evidence from the first four sets of choice screen auctions (for the
periods of March–June 2020, July–September 2020, October–December 2020, and January–March
2021) conducted by Google in 2020 in 31 European countries. The evidence is consistent with my
theoretical conclusions. In particular, to mention just one data point from the section, the search
engine that was most successful in these auctions, winning a slot in every country and in every
period, has been installed only approximately 100,000 times worldwide, has only 74 user reviews
5in Google’s Play Store, and has one of the lowest ratings among the search engines participating
in choice screen auctions. For the sake of comparison, Google’s own search app has been installed
more than 5 billion times, while alternative search engines Bing (produced by Microsoft) and
DuckDuckGo (produced independently and focused on user privacy) have been installed more than
10 million times. (These numbers include all installs, including those that come from choice screens
and those that do not.)
Section 5 concludes.
1.1 Related Literature
Two recent surveys by Crémer et al. (2019) and Scott Morton et al. (2019) provide extensive
discussions of the challenges of regulating digital platforms, potential remedies, and other related
issues. On the specific issue of choice screens (without auctioning off the slots), Economides and
Lianos (2011) provide a discussion of the 2009 Microsoft–EU agreement regarding the Windows
platform and the Internet Explorer web browser.
On the issue of search engine monetization, see Edelman et al. (2007) and Varian (2007). These
papers also contain discussions of search engines adjusting advertisers’ “per click” bids by their
estimated probabilities of being clicked, essentially transforming those “per click” auctions into
“per appearance” ones. See also Varian (2008) for a discussion of reasons why search engines
adjust “per click” bids in ad auctions by the click-through rates, instead of ranking the ads solely
by “per-click” bids. For a more detailed discussion of various adjustment factors and their impact
on search engine revenues in the context of online advertising, see Lahaie and Pennock (2007).
In the “choice screen” setting, the “per appearance” auction can be viewed as an implementation
of the Vickrey–Clarke–Groves mechanism (Vickrey, 1961; Clarke, 1971; Groves, 1973), with the
right to be shown on the choice screen being the object auctioned off. VCG is known to preserve
various incentives (e.g., pre-auction investment or information acquisition), even in cases in which
other auction formats may not (Rogerson, 1992; Bergemann and Välimäki, 2002; Arozamena and
Cantillon, 2004; Hatfield et al., 2014, 2018). As I show in Section 3.1, the per appearance auction
in the choice screen setting likewise has an “incentive-preserving” feature: it does not distort
the incentives of the bidders regarding the choice of the optimal balance between popularity and
revenue-per-user, while the per install auction does (with the distortion growing larger as the
number of bidders grows).
2 Basic Model: Exogenous Popularity and Revenue-per-User
A platform is auctioning off the right to be shown on the choice screen. There is one slot
available, next to the platform’s own product.16 There are n = 2 bidders, i ∈ {1, 2}. Each bidder i
has an exogenously determined popularity qi and if its product is chosen by a user, then bidder i
16
In Google’s Android choice screen auctions, there are three slots next to the platform’s own listing. I consider
the case of only one alternative slot for simplicity; this assumption does not qualitatively change my conclusions.
6receives revenue ri from that. Variables qi and ri are private information of bidder i. Variables q1 ,
q2 , r1 , and r2 are independently and identically distributed, and each is drawn from the uniform
distribution on [0, 1].
If a product of popularity q is shown to a user, then it is chosen with probability q. The platform
gets benefit π > 1 if its own product is chosen, and the auction payment if the user chooses an
alternative.17
Under the “per appearance” auction, each bidder submits a bid for the right to be shown to
users. The bidder with the highest bid wins, is shown on the choice screen next to the platform’s
own product, and pays the amount equal to the bid of the second-highest bidder.
Under the “per install” auction, each bidder submits a bid. The bidder with the highest bid
wins, is shown on the choice screen next to the platform’s own product, and pays the amount equal
to the bid of the second-highest bidder if the user chooses its product.
Note that both auction formats are incentive-compatible: it is a dominant strategy for each
bidder to submit its valuation truthfully. That is, under the “per install” auction, each bidder i
will bid ri , while under the “per appearance” auction, each bidder i will bid qi ri .18
To characterize the distribution of outcomes in the per appearance auction, we need to perform
some calculations.
First, observe that the unconditional distribution of each bid bi = qi ri is given by the CDF
G(x) = x − x ln x and the corresponding density function g(x) = − ln x (for x ∈ (0, 1]).19 Thus,
for a bidder with type (q, r), the probability of winning the auction is (qr) − (qr) ln(qr). For the
population of bidders with type q and with types r distributed uniformly on [0, 1], the probability
R1 R1
of winning is therefore 0 ((qr) − (qr) ln(qr)) dr = q 0 (r − r ln q − r ln r) dr = q 12 − 12 ln q + 14 =
3
4q − 12 q ln q.20 We can now calculate the expected popularity of the winner of the auction, which
R1 R1 R1
is equal to 2 0 q 34 q − 12 q ln q dq = 0 32 q 2 dq − 0 q 2 ln qdq = 21 + 19 = 11 21
18 .
The expected payment made by the winner of the auction is equal to E[min{q1 r1 , q2 r2 }]. Given
the distribution G(·) of each qi ri derived above, the distribution of min{q1 r1 , q2 r2 } is given by
G(x)2 +2G(x)(1−G(x)), with the corresponding density 2g(x)−2g(x)G(x) = −2 ln x(1−x+x ln x).
R1 7
Thus, E[min{q1 r1 , q2 r2 }] = −2 0 (x ln x(1 − x + x ln x)) dx = 54 , and the expected payoff of the
7 7
platform is 54 + 18 π.
Characterizing the outcomes of the per install auction is straightforward. Under this format,
the expected popularity of the winner is 1/2—it is independent of the bids in the auction and plays
no role in determining the winner. This is lower than the expected popularity of the winner in the
17
I.e., the platform’s most preferred outcome is to have its own product chosen by a user; after all, if that was not
the case, there would be no need for the antitrust remedy.
18
I will ignore other equilibria of these auctions.
19
R1
For x ∈ [0, 1], the probability that qi ri is less than or equal to x is equal to G(x) = x+ x xq dq = x+x(ln 1−ln x) =
x − x ln x.
20 2
This calculation uses the fact that x ln x = 21 x2 ln x − x4 + c. In the next step, we will also use the fact that
R
R 2 3
x ln x = 13 x3 ln x − x9 + c.
21
The logic behind this formula is that by symmetry, (the expected popularity of the winner of the auction) is
equal to (the expected Rpopularity of the winner of the auction conditional on that winner being bidder 1). The latter
1
0 q1 P rob(bidder 1 is the winner of the auction|q1 )dq1 1
expression is equal to P rob(bidder 1 is the winner of the auction)
, whose denominator is equal to 2
.
7per appearance auction ( 11
18 ), and thus the probability that an alternative product will be chosen
is reduced and the probability that the dominant platform’s product is chosen is increased.
The expected per install payment made by the winner is 1/3 (and is independent of its popu-
larity), and the expected payoff of the platform in the per install auction is therefore 1/6 + 1/2π,
7 7
which is higher than its expected payoff in the per appearance auction ( 54 + 18 π).
The contrast between the outcomes of the per appearance and per install auctions becomes even
more striking if the number of bidders, n, becomes large; i.e., the number of potential alternative
products grows. It is immediate that as n grows, the expected popularity of the winner of the per
appearance auction converges to one: the highest possible popularity. By contrast, the expected
popularity of the winner of the per install auction remains unchanged, at one half; under that
format, the increase in the competition has no impact on the popularity of the winner, and thus
on the probability that an alternative product will be chosen. Of course, if the platform’s payoff
from having a user choose its own product is higher than the revenue that an alternative product
generates, this outcome is preferred by the platform, just as it was in the case of n = 2.
3 Extension: Endogenous Popularity and Revenue-per-User
It is clear from the results of Section 2 that the choice between per install and per appearance
auction formats is a first-order issue. However, that only tells a part of the story. In this section,
I consider the incentives of bidders to choose between making their product more attractive to
users (at the expense of lower per-user revenue) vs. moving in the opposite direction. This is an
important issue for the case of default search engines on a platform. Search engines may be able
to increase their popularity by reducing the intrusiveness of ads, enhancing privacy protections, or
donating their advertising revenue to charitable causes. These measures, while making the search
engine more attractive to users, reduce the revenue it makes from each one of them. In this section,
I show that the issues discussed in Section 2 are exacerbated once these incentives are taken into
account; in some cases, dramatically so.
I maintain most of the assumptions of Section 2 and make only one change. Instead of assuming
that each bidder i has an exogenously given popularity qi and revenue-per-user ri , I assume that each
bidder has an exogenously given type ti drawn independently from the uniform distribution F (t)
on [0, 1] (with the corresponding density function f (t)). The bidder can then select its popularity
qi from [0, ti ] and its revenue-per-user is then equal to ri = ti − qi . After making this decision, the
bidder submits its auction bid as before.
Bidding decisions are still straightforward under both rules: it is optimal to bid truthfully in
both per appearance and per install auctions. However, each bidder now needs to decide, given its
type ti , how much of that type to allocate to popularity qi and how much to allocate to revenue-
per-user. I work out the resulting equilibria in the next two subsections.
83.1 Per Appearance Auction
Consider a per appearance auction with n bidders, and suppose bidder i has type ti ∈ [0, 1].
Fix other bidders’ strategies, let G(x) denote the distribution of the first-order statistic of those
bidders’ bids, and let P (x) denote the expected payment that bidder i would make, conditional on
winning the auction, if it submitted bid x (note that G(x) and P (x) are purely functions of the
other bidders’ strategies and x). Bidder i has two decisions to make: popularity qi and bid bi . Its
payoff as a function of these two decisions is given by
Π(qi , bi ) = G(bi ) × (qi (ti − qi ) − P (bi )) .
It is immediate that bidder i’s optimal choice of popularity is to set
ti
qi = . (1)
2
This is an optimal strategy regardless of what other bidders’ strategies are (or how many of those
bidders there are). Thus, the strategy profile in which each bidder sets qi = ti /2 and then bids
(ti /2)2 per appearance constitutes an equilibrium.
3.2 Per Install Auction
Equilibrium characterization in the case of the per install auction requires a more involved
argument. Consider a symmetric equilibrium of the per install auction with n bidders, and suppose
equilibrium strategies are given by functions q(t) and b(t), with the first one denoting the popularity
chosen by a bidder with type t and the second one denoting its bid. We know that in equilibrium,
function b(t) will be truthful (given the choice of popularity q(t) and the corresponding revenue-
per-user t − q(t)); however, just as in the case of the per appearance auction, it is more convenient
to not yet impose that restriction on function b(t).
Take a bidder of type ti ∈ (0, 1) and a real number ∆q such that q(ti ) + ∆q ∈ (0, ti ). Let
Π(∆q ; ti ) denote the expected payoff of bidder i whose type is ti if it chooses popularity q(ti ) + ∆q
but bids b(ti ), given that other bidders are bidding according to strategies q(t) and b(t). We then
have
n−1
Π(∆q ; ti ) = F (ti ) × (q(ti ) + ∆q ) × ti − (q(ti ) + ∆q ) − E b(max{tj }| max{tj } ≤ ti ) .
j6=i j6=i
Because we started with an equilibrium profile of strategies, the partial derivative of Π(∆q ; ti ) with
respect to ∆q has to be equal to zero when evaluated at (0; ti ). This implies the following equation
for q(ti ):
ti − E [b(maxj6=i {tj })| maxj6=i {tj } ≤ ti ]
q(ti ) = . (2)
2
Note that even without fully characterizing the equilibrium, from the comparison of equations (1)
and (2) it is immediate that equilibrium popularity chosen by each type ti > 0 will be strictly lower
9under the per install auction than under the per appearance auction (assuming, of course, that the
equilibrium of the per install auction actually exists, which we will show below).
Recall that by incentive compatibility, we have b(tj ) = tj − q(tj ). We can then rewrite the
expectation in equation (2) as
R ti
(s − q(s))dF n−1 (s)
0
E b(max{tj })| max{tj } ≤ ti =
j6=i j6=i F n−1 (ti )
Rt
(n − 1) 0 i (s − q(s))f (s)F n−2 (s)ds
= ,
F n−1 (ti )
and subsequently rewrite equation (2) as
Z ti
2q(ti )F n−1 (ti ) = ti F n−1 (ti ) − (n − 1) (s − q(s))f (s)F n−2 (s)ds. (3)
0
The next step is to take a derivative of both sides of equation (3) with respect to ti , which gives
us
2q 0 (ti )F n−1 (ti ) + 2(n − 1)q(ti )f (ti )F n−2 (ti ) = F n−1 (ti ) + (n − 1)ti f (ti )F n−2 (ti )
− (n − 1)ti f (ti )F n−2 (ti ) + (n − 1)q(ti )f (ti )F n−2 (ti ),
which simplifies to
f (ti )
2q 0 (ti ) + (n − 1)q(ti ) = 1. (4)
F (ti )
Equation (4) is a first-order linear differential equation, with the initial condition q(0) = 0.22
In our case, F (ti ) = ti and f (ti ) = 1, and so the equation becomes
1
2q 0 (ti ) + (n − 1)q(ti ) = 1,
ti
with the solution
ti
q(ti ) = .
n+1
3.3 Comparison
The comparison between the two formats is immediate. Even with just two bidders, n =
2, a bidder of each type ti chooses a much lower popularity under the per install auction than
ti ti
under the per appearance auction: 3 vs. 2. Of course, this lower popularity on a per type basis
immediately translates into a correspondingly lower overall probability that a product alternative
to the dominant platform’s one will be picked by users from the choice screen.
With more bidders, the difference becomes even more dramatic. Under the per appearance
22
Equation (4) takes a particularly simple form when distribution F is uniform, but also has a tractable solution
R ti n−1
0 F (s) 2 ds
for the general case. The solution for the general case is q(ti ) = n−1 .
2F (ti ) 2
10auction format, a bidder’s choice of the point on the popularity–RPU frontier is unaffected by the
number of bidders, and thus as n → ∞, the popularity of the winning bidder converges to 21 . By
contrast, under the per install format, the more bidders the auction has, the lower is the popularity
that each of them chooses in equilibrium, and so as n → ∞, the popularity of the winner converges
to zero; therefore, the share of installs that goes to the dominant platform’s own product converges
to 100%, completely undoing the choice screen auction’s raison d’être.
4 Evidence from Android Choice Screen Auctions
I now turn to the empirical evidence on the outcomes of Google’s choice screen auctions for
default search engines on the Android platform conducted in 2020. These auctions took place
in January 2020 (for the period from March to June), June 2020 (for the period from July to
September), September 2020 (for the period from October to December), and December 2020 (for
the period from January to March 2021). For each time period, 31 independent auctions were
conducted (one per country). These auctions were conducted on a per install basis, with those
submitting top three bids being shown on the choice screen and paying the fourth-highest bid every
time a user chose one of them from the choice screen. In the event of a tie, more than three bidders
could win, with the ties broken randomly on a per device basis.
Google lists the latest auction winners at https://www.android.com/choicescreen-winners/,
and the lists of winners from the earlier auctions are available on the corresponding webpage on
the Internet Archive.23 These results, on a country-by-country basis, are summarized in Table 1.
In the table, countries are sorted by population (from largest to smallest), while search engines are
sorted by the average population they won across the three time periods. E.g., the search engine
DuckDuckGo won a slot in every country in the first period (total population 519.4 million) and
also in the second period (same total population), but only four countries in period 3 (Bulgaria,
Croatia, Iceland, and Liechtenstein, with the total population 11.4 million) and one country in
period 4 (Belgium, population 11.6 million). The average population won by DuckDuckGo across
the four time periods is thus (519.4 + 519.4 + 11.4 + 11.6)/4 = 265.5 million, as listed in the last
row of Table 1. Finally, in each search engine–country cell I list the periods in which that search
engine won a slot on the choice screen menu in that country.
23
https://web.archive.org/web/*/https://www.android.com/choicescreen-winners/.
11Table 1: Winners of Android Choice Screen Auctions (by country)
Country Population Info.com PrivacyWall DuckDuckGo Bing GMX Yandex Qwant Seznam Givero Ecosia
Germany 83,990,646 1, 2, 3, 4 2, 3, 4 1, 2 3, 4 1
United Kingdom 67,999,326 1, 2, 3, 4 2, 3, 4 1, 2 1, 3, 4
France 65,297,182 1, 2, 3, 4 2, 3, 4 1, 2 3, 4 1
Italy 60,457,546 1, 2, 3, 4 2, 3, 4 1, 2 3, 4 1
Spain 46,789,532 1, 2, 3, 4 2, 3, 4 1, 2 3, 4 1
Poland 37,847,219 1, 2, 3, 4 3, 4 1, 2 2, 3, 4 1
Romania 19,196,044 1, 2, 3, 4 1, 3, 4 1, 2 2, 3, 4 1, 3, 4
Netherlands 17,142,323 1, 2, 3, 4 2, 3, 4 1, 2 3, 4 1
Belgium 11,608,284 1, 2, 3, 4 2, 3, 4 1, 2, 4 3 1
Czech Republic 10,717,516 1, 2, 3, 4 3, 4 1, 2 1, 2, 3, 4
Greece 10,415,204 1, 2, 3, 4 1, 3, 4 1, 2 2, 3, 4 1, 3, 4 1
Portugal 10,190,296 1, 2, 3, 4 1, 4 1, 2 2, 3, 4 1, 3 1
Sweden 10,114,623 1, 2, 3, 4 1, 2, 3, 4 1, 2 3, 4
Hungary 9,657,366 1, 2, 3, 4 1, 3, 4 1, 2 2, 3, 4 1, 3, 4
12
Austria 9,032,162 1, 2, 3, 4 2, 3, 4 1, 2 3 1, 4
Bulgaria 6,938,828 1, 2, 3, 4 1, 3, 4 1, 2, 3 2, 3, 4 1, 3, 4
Denmark 5,795,666 1, 2, 3, 4 1, 2, 3, 4 1, 2 3, 4 1 1 1
Finland 5,543,674 1, 2, 3, 4 2, 3, 4 1, 2 3, 4 1
Slovakia 5,461,816 1, 2, 3, 4 4 1, 2 3 1, 2, 3, 4
Norway 5,428,345 1, 2, 3, 4 1, 2, 3, 4 1, 2 3, 4
Ireland 4,960,177 1, 2, 3, 4 1, 2, 3, 4 1, 2 3, 4
Croatia 4,099,199 1, 2, 3, 4 1, 4 1, 2, 3 2, 3, 4 1, 4
Lithuania 2,710,479 1, 2, 3, 4 3, 4 1, 2 2, 3, 4 1
Slovenia 2,079,635 1, 2, 3, 4 1 1, 2 2, 3, 4 1 3, 4
Latvia 1,881,006 1, 2, 3, 4 3, 4 1, 2 2, 4 1, 3, 4
Estonia 1,328,929 1, 2, 3, 4 1, 2 2, 3, 4 1, 3, 4
Republic of Cyprus 1,190,962 1, 2, 3, 4 1 1, 2 2, 3, 4 1, 3, 4
Luxembourg 629,798 1, 2, 3, 4 1, 2 3, 4 1, 2, 3, 4
Malta 514,564 1, 2, 3, 4 1, 3, 4 1, 2 2, 3, 4 1
Iceland 341,834 1, 2, 3, 4 1, 4 1, 2, 3 2, 3, 4 1
Liechtenstein 38,150 1, 2, 3, 4 4 1, 2, 3 2, 3, 4 1
Average pop. (M) 519.4 519.4 373.3 265.5 208.9 112.3 58.8 53.3 16.2 1.4 1.0Table 2: Popularity and Ratings of Android Search Engine Apps
Search Engine Av. Pop. # Installs Rating # Reviews
info.com 519.4 100,000+ 4.1 74
PrivacyWall 373.3 100,000+ 4.2 378
DuckDuckGo 265.5 10,000,000+ 4.8 1,014,301
Bing 208.9 10,000,000+ 4.4 187,314
GMX 112.3 10,000+ 4.5 19
Yandex 58.8 100,000,000+ 4.5 1,042,638
Qwant 53.3 1,000,000+ 3.8 10,968
Seznam 16.2 1,000,000+ 4.3 67,137
Givero 1.4 100+ n/a n/a
Ecosia 1.0 5,000,000+ 4.6 125,723
Table 2 lists the search engines by the average population they won across the four periods
and adds data collected from the Android Play Store (https://play.google.com/store/apps)
on the popularity and quality of these search engines.24 To be eligible to participate in a choice
screen auction, a “search provider must have an app that is available for free in Google Play”
and if a search engine is chosen by a user from the choice screen, “[that app] will be downloaded
from Play” in addition to the search engine being set as the default in the Chrome browser on
the user’s device (https://www.android.com/choicescreen/). Of course, users can install these
apps even without the choice screen (as they do, e.g., outside of Europe); moreover, the numbers
listed on Play Store count the number of installs worldwide, not just in Europe. Thus, while the
numbers of downloads resulting from choice screen auctions are not publicly disclosed by Google
or the European Commission, the install numbers from Play Store listed in Table 2 provide upper
bounds on those numbers.25 These install numbers, of course, also provide a measure of the overall
popularity of these search engines by including the installs that were made independently of choice
screen auctions.26
Table 2 also includes the ratings from Android users on the quality of these apps, as well as the
number of user reviews. Play Store requires a minimum number of installs, ratings, and reviews
before it starts disclosing this information. One of the winners of choice screen auctions did not pass
this bar and, thus, does not have average ratings reported by the Play Store platform (indicated
as “n/a” in the table).
Consistent with the theoretical results from Section 2, there is no meaningful correlation between
the quality and popularity of the search engines participating in these auctions and the average
population they won in them. Strikingly, of the top five winners, each of whom has on average won
24
I collected the data on March 1, 2021—exactly one year after the first day of the first choice screen auction
period. The screenshots of Play Store pages from which these data were taken are available upon request.
25
Note that Play Store does not disclose the exact number of installs but instead shows a range, which is what
Table 2 reports.
26
One caveat on this measure is that the search engines’ popularity may vary by geography. For example, the
majority of users of the Yandex search engine are from Russia and countries of the former Soviet Union.
13a slot in choice screen auctions covering a population of more than 100 million, three had on the
order of only 100,000 installs or less (from all sources, worldwide, over their lifetimes), and had very
small numbers of user reviews (74 for info.com, 378 for PrivacyWall, and 19 for GMX—compared
with, e.g., one million reviews for DuckDuckGo or 187 thousand reviews for Bing). The two largest
winners, info.com and PrivacyWall, had some of the lowest user ratings among the search engines
available (4.1 and 4.2, respectively, vs., e.g., 4.8 for DuckDuckGo or 4.6 for Ecosia—the two most
highly rated search engines). These two biggest winners of choice screen auctions also do not show
up in the aggregate market share statistics for search engines on mobile platforms in Europe, despite
winning very large populations in choice screen auctions for an entire year (519 million people in
the case of info.com and 373 million in the case of PrivacyWall).27
Regarding the theoretical results of Section 3 on endogenous quality choice, I do not have direct
evidence on the impact of the incentives from the auction on the actual design choices that search
engines make to trade off revenue they make per each user vs. their popularity and quality. The
time period of only a year may also be insufficient for these design changes to manifest themselves.
However, these incentives are clearly understood (and lamented) by at least some of the participants
in these auctions.
The most highly rated search engine, DuckDuckGo, won a slot in every country in periods 1 and
2, but then by period 3 only won slots in four countries covering in total only 2% of the available
population, and then won a slot in only one country in period 4. As explained by DuckDuckGo,
“Despite DuckDuckGo being robustly profitable since 2014, we have been priced out of this auction
because we choose to not maximize our profits by exploiting our users. In practical terms, this
means our commitment to privacy and a cleaner search experience translates into less money per
search. This means we must bid less relative to other, profit-maximizing companies.”28
The second most highly rated search engine is Ecosia, which uses its profits to plant trees
around the world (https://info.ecosia.org/). Despite its overall popularity with users (more
than 5,000,000 installs and more than 100,000 user reviews), it only won coverage in the last two
periods and in only one country (covering less than 0.4% of overall available population). Ecosia
explained its decision not to participate in the initial auction (for the first time period) as follows:
“Ecosia is a not-for-profit search engine. Taking part in Google’s auction would force us to spend
our income on an unnecessary bidding war with other (profit-oriented) search engines. We’d rather
use it to plant trees on our endangered planet.”29
27
Data on aggregate market share statistics for search engines on mobile platforms in Europe are available at
https://gs.statcounter.com/search-engine-market-share/mobile/europe. For February 2021, the last period
for which the data are currently available, the following search engines (of those participating in choice screen auctions)
have nonnegligible market shares: Yandex (1.34%), Bing (0.51%), DuckDuckGo (0.38%), Ecosia (0.22%), Seznam
(0.07%), and Qwant (0.04%).
28
https://spreadprivacy.com/search-preference-menu-duckduckgo-elimination/.
29
https://blog.ecosia.org/google-auction-choice-screen/.
145 Concluding remarks
It is important to note that this paper is not meant as a criticism of Google or the European
Commission. In fact, quite the opposite—novel regulatory tools are few and far between, and
Google and the EC deserve praise for introducing an elegant, lightweight, and promising solution
to a thorny problem. It is hard to get things 100% right from the get-go, and with appropriate
modifications, choice screen auctions can become a powerful tool.
One may also be tempted to use the evidence like that in Section 4 to argue that choice screen
auctions should be scrapped and replaced with an alternative remedy. My theoretical results,
however, show that such a conclusion would be premature. The issues described in Section 4 arise
not from the usage of auctions per se, but rather from the specific implementation of these auctions.
Replacing the “per install” bidding rule in choice screen auctions with a “per appearance” one may
be sufficient to alleviate the shortcomings of the current implementation, or at least meaningfully
reduce their impact.
A “per appearance” auction can be implemented in practice in a number of different ways.
Search engines can bid directly per appearance, specifying how much they are willing to pay every
time they are shown on the choice screen, and paying the highest losing bid every time they are
shown. To help them make bidding decisions, the platform could provide to each search engine
historical data on its “conversion probability,” i.e., the likelihood that the search engine will be
chosen by a user conditional on being shown on the choice screen. Alternatively, the auction could
still ask bidders to report their values “per install,” but then rank bidders by the product of those
reported values and estimated conversion probabilities and charge each winning bidder the lowest
bid they could have reported and still won the auction. This approach is widely used in sponsored
search auctions and is well understood.30 The platform can estimate these conversion probabilities
by allocating a small fraction of “choice screen” impressions to random selections of all eligible
(i.e., pre-vetted by Google31 ) search engines, and then using the data from this fraction of traffic
to estimate the probabilities. In summary, while deploying per-appearance choice screen auctions
in one of the above forms does require some additional work on the part of the auctioneer, they are
sufficiently similar to the existing formats in other domains that their implementation would not
be too problematic.
30
Notably, the rules of sponsored search auctions went through a similar evolutionary process. Initially, spon-
sored search auctions were conducted on the pay-your-own bid basis (Edelman and Ostrovsky, 2007)—and the initial
proposal for choice screen auctions (which was scrapped before the initial round and was replaced by the current
design; see https://web.archive.org/web/20190802094608/www.android.com/choicescreen/ for the original pro-
posal) was based on the same principle. Next, sponsored search auctions moved to a generalization of the second-price
auction—just like the current choice screen auction design. Finally, sponsored search auctions incorporated click-
through rates in their ranking function—which is parallel to potential the implementation of the “per-appearance”
choice screen auction discussed above.
31
Google has a number of requirements for search engines to be eligible to participate in the auction, and any
search engine that passes these requirements is deemed to be of sufficient quality to be offered as a choice to the
users. E.g., in the official rules, Google says, “In the event that fewer than three eligible search providers bid, Google
will fill any remaining slots randomly from the pool of eligible search providers on a per device basis. The pool
of eligible providers will include those that applied to participate in the choice screen but did not submit bids.”
(https://www.android.com/choicescreen/.)
15While per appearance auctions may provide a simple, transparent, and potentially effective
solution, it is important to note that this solution is not necessarily optimal. To judge the optimality
of this (or any other) solution, one would need, at a minimum, to explicitly specify the regulator’s
objective function. Moreover, even holding the overall auction format fixed, there are parameters of
its implementation that will have an impact on its overall effectiveness and thus need to be chosen
appropriately. E.g., one would need to decide how many options to show on the choice screen,32
how often to show the choice screen to the users (just once when the phone is purchased? with
every major update of the operating system? at some regular intervals?), and how often to conduct
these auctions (a higher frequency would give more opportunities to the bidders to adjust their
bids). And going beyond just the design of a particular choice screen auction, there is a question
of how common they should be. E.g., many apps from Apple and Google come pre-installed on
iOS and Android platforms, respectively, and in principle, each one could have a choice screen to
give a level playing field to the competitors. But having to go through a choice screen for every
single one of them may lead to a poor experience for end users, substantially reducing consumer
utility, which gives rise to the question of how to determine the circumstances and cases to which
choice screen auctions should be applied, without overwhelming the end users. I leave the analysis
of these questions to future research.
Choice screen auctions can be a powerful tool for leveling the playing field in the now widespread
settings in which a dominant platform offers a product that is competing with several others. More
generally, the tools of market design can be useful for constructing elegant and effective regulatory
solutions for the increasingly complex and interconnected digital economy. When deploying such
solutions, it is important to analyze the equilibrium properties of the resulting systems on a detailed
level. Seemingly minor details can have major effects on the outcomes.
32
See, e.g., https://www.auction-technologies.net/images/Papers/competitive-edge-the-google-auction-
that-may-turn-into-a-trap.pdf for a discussion of whether the number of slots should be increased.
16References
Arozamena, L. and E. Cantillon (2004). Investment incentives in procurement auctions. Review of
Economic Studies 71 (1), 1–18.
Bergemann, D. and J. Välimäki (2002). Information acquisition and efficient mechanism design.
Econometrica 70 (3), 1007–1033.
Clarke, E. H. (1971). Multipart pricing of public goods. Public Choice 11 (1), 17–33.
Crémer, J., Y.-A. de Montjoye, and H. Schweitzer (2019). Competition policy for the digital era.
Report for the European Commission.
Economides, N. and J. Lianos (2011). A critical appraisal of remedies in the EU Microsoft cases.
Columbia Business Law Review 2010 (2), 346–420.
Edelman, B. and M. Ostrovsky (2007). Strategic bidder behavior in sponsored search auctions.
Decision support systems 43 (1), 192–198.
Edelman, B., M. Ostrovsky, and M. Schwarz (2007). Internet advertising and the generalized
second-price auction: Selling billions of dollars worth of keywords. American Economic Re-
view 97 (1), 242–259.
Groves, T. (1973). Incentives in teams. Econometrica 41 (4), 617–631.
Hatfield, J. W., F. Kojima, and S. D. Kominers (2014). Investment incentives in labor market
matching. American Economic Review Papers & Proceedings 104 (5), 436–41.
Hatfield, J. W., F. Kojima, and S. D. Kominers (2018). Strategy-proofness, investment efficiency,
and marginal returns: An equivalence. Becker Friedman Institute for Research in Economics
Working Paper .
Lahaie, S. and D. M. Pennock (2007). Revenue analysis of a family of ranking rules for keyword
auctions. In Proceedings of the 8th ACM conference on Electronic commerce, pp. 50–56.
Rogerson, W. P. (1992). Contractual solutions to the hold-up problem. Review of Economic
Studies 59 (4), 777–793.
Scott Morton, F., P. Bouvier, A. Ezrachi, B. Jullien, R. Katz, G. Kimmelman, A. D. Melamed,
and J. Morgenstern (2019). Committee for the study of digital platforms: Market structure
and antitrust subcommittee report. Stigler Center for the Study of the Economy and the State,
University of Chicago Booth School of Business.
Varian, H. R. (2007). Position auctions. International Journal of Industrial Organization 25 (6),
1163–1178.
Varian, H. R. (2008). Quality scores and ad auctions. Google Official Blog,
https://googleblog.blogspot.com/2008/10/quality–scores–and–ad–auctions.html.
Vickrey, W. (1961). Counterspeculation, auctions, and competitive sealed tenders. Journal of
Finance 16 (1), 8–37.
17You can also read