CLEAN ENERGY MASTER PLAN SUNY ONEONTA - APRIL 14, 2021 - FINAL
←
→
Page content transcription
If your browser does not render page correctly, please read the page content below
CLEAN ENERGY MASTER PLAN
SUNY ONEONTA
APRIL 14, 2021 – FINAL
Ramboll – SUNY Oneonta - Clean Energy Master Plan

CLEAN ENERGY MASTER PLAN
SUNY ONEONTA

Project no.             4261/1940070616
Version                 Final
Date                    April 14, 2021

Prepared for: SUNY Oneonta

Signed:

Mark R. McGuire, PE, LEED AP
Energy Services Manager

Robert M. Neimeier, Director
Energy Efficiency & Planning

This copyrighted material represents the proprietary work product of Ramboll. This material
was prepared for the specific purpose of securing a contract with the above client. No other
use, reproduction, or distribution of this material or of the approaches it contains, is authorized
without the prior express written consent of Ramboll. However, the recipient may make as
many copies of this document as deemed necessary for the sole purpose of evaluating this
document for final selection and award.
© 2021
All Rights Reserved

I:\Sucf.4261\70616.Energy-Roadmap\Docs\Reports\Clean Energy Master Plan\SUNY Oneonta CEMP_2021-04-14 Final.Docx   i

Ramboll – SUNY Oneonta - Clean Energy Master Plan

CONTENTS

Acknowlegements                                                                                                    iv
Foreward                                                                                                            v
Executive Summary                                                                                                  vi
1.        Purpose, Drivers and Approach                                                                             1
1.1       Purpose                                                                                                   1
1.2       Energy and Climate Drivers                                                                                1
1.3       Approach and Guiding Principles                                                                           1
2.        Assess – Existing Conditions and Opportunities                                                            3
2.1       Greenhouse Gas Emissions and Energy Use Intensity                                                         3
2.2       Existing Conditions and Opportunities                                                                     6
3.        ACT – Clean Energy Master Plan                                                                          15
3.1       Basis for a Low Carbon Transition                                                                       16
3.2       Energy Modeling and Scenario Planning                                                                   17
3.3       Scenario Planning – Economic Results and Discussion                                                     20
3.4       Potential Low Carbon Heating Strategy                                                                   22
3.5       Proposed Steam and MTW to LTW Phasing Plan                                                              23
3.6       Summary of Energy Projects                                                                              24
3.7       Greenhouse Gas Emissions and Energy Use Intensity Reduction
          Impact                                                                                                  25
3.8       Factors Impacting a Low Carbon Campus Transition                                                        27
3.9       Summary Considerations and Approach to a Low Carbon Transition                                          27
4.        Achieve – Implementation Plan                                                                           29
4.1       Funding                                                                                                 29
4.2       Implementation Team                                                                                     30
4.3       Policies and Procedures                                                                                 30
4.4       Keys to Success                                                                                         30
4.5       Key Performance Indicators                                                                              30

I:\Sucf.4261\70616.Energy-Roadmap\Docs\Reports\Clean Energy Master Plan\SUNY Oneonta CEMP_2021-04-14 Final.Docx         ii
Ramboll – SUNY Oneonta - Clean Energy Master Plan

           List of Tables

           Table       1. Energy Roadmap | Strategic Focus Areas                                                   ix
           Table       2. Key Stakeholder Engagement Meetings                                                       2
           Table       3. Energy Efficiency - Existing Conditions and Opportunities                                 6
           Table       4. Resiliency - Existing Conditions and Opportunities                                        8
           Table       5. Renewable Energy - Existing Conditions and Opportunities                                10
           Table       6. Stewardship - Existing Conditions and Opportunities                                     11
           Table       7. Engagement Existing Conditions and Opportunities                                        13
           Table       8. Energy Roadmap | Strategic Focus Areas                                                  15
           Table       9. Potential Capacity from GSHP System                                                     19
           Table       10. Low Carbon Energy Scenario Attributes                                                  21
           Table       11. Roadmap Implementation Plan Summary                                                    29

           List of Figures
           Figure 1. SUNY Oneonta Energy Use by Fuel Type (CY 2019)                                               vii
           Figure 2. SUNY Oneonta GHG Emissions Trend Since Calendar Year 1990                                    vii
           Figure 3. SUNY Oneonta District Energy Network – Current Versus Vision                                   x
           Figure 4. Clean Energy Scenarios Evaluated                                                               x
           Figure 5. Low Carbon Energy Scenarios Comparison                                                        xi
           Figure 6. Proposed Steam to Low Temperature Hot Water Phasing Plan                                     xii
           Figure 7. GHG Emissions Trajectory                                                                     xiii
           Figure 8. Site Energy Use Intensity Trajectory                                                         xiii
           Figure 9. Recent History of Energy and Sustainability Actions at SUNY
           Oneonta                                                                                                  3
           Figure 10. SUNY Oneonta Energy Use by Fuel Type (CY 2019)                                                4
           Figure 11. SUNY Oneonta GHG Emissions Trend Since Calendar Year
           1990                                                                                                     5
           Figure 12. SUNY Oneonta Energy Use Intensity Trend Since Calendar
           Year 1990                                                                                                5
           Figure 13. SUNY Oneonta District Energy Network – Current Versus
           Vision                                                                                                 16
           Figure 14. Existing Distribution Network                                                               17
           Figure 15. Clean Energy Scenarios Evaluated                                                            18
           Figure 16. Location of Wells for the GSHP System                                                       19
           Figure 17. Low Carbon Energy Scenarios Comparison                                                      20
           Figure 18. Heat Production for Different Ground Loop Locations                                         23
           Figure 19. Proposed Steam to Low Temperature Hot Water Phasing Plan                                    24
           Figure 20. GHG Emissions Trajectory                                                                    26
           Figure 21. Site Energy Use Intensity Trajectory                                                        26

           List of Appendices
           A. Energy Projects Summary

I:\Sucf.4261\70616.Energy-Roadmap\Docs\Reports\Clean Energy Master Plan\SUNY Oneonta CEMP_2021-04-14 Final.Docx          iii
Ramboll – SUNY Oneonta - Clean Energy Master Plan

           ACKNOWLEGEMENTS
           The following individuals are acknowledged for their participation in the development of the SUNY
           Oneonta Clean Energy Master Plan:

              SUNY Oneonta                                                                           Ramboll
              Richard Johnson                                                                        Joseph DiSanto
              Rachel Kornhauser                                                                      John Florning
              Patrick Ryan                                                                           Chrissy Herkenham
              Lachlan Squair                                                                         Michael Kingsley
              Terry Zimmer                                                                           Mark McGuire
                                                                                                     Robert Neimeier
              SUCF                                                                                   Soren Moller Thompson
              Annette Barnes

           President’s Executive Council
            Name                                                                                     Title
            Paul Adamo                                                                               VP Advancement
            Tracy Allen                                                                              Dean School of Sciences
            Ellen Blaisdell                                                                          AVP College Advancement
            Colleen Brannan                                                                          Chief of Staff, President's Office
            Karen Brown                                                                              Executive Director of Admissions
            Dia Carleton                                                                             Personnel Director
            Franklin Chambers                                                                        VP of External Affairs
            Darren Chase                                                                             Director – Library
            Susan Clemons                                                                            AVP Finance & Administration - Controller
            Elizabeth Dunn                                                                           Dean - School of Liberal Arts
            Ananda Finch                                                                             AVP Student Development
            Leamor Kahanov                                                                           VP Academic Affairs
            Richard Lee                                                                              Professor – English
            Hal Legg                                                                                 Chief Communications & Marketing Officer
            Steve Maniscalco                                                                         Chief Information Officer
            Eileen Morgan-Zayachek                                                                   Associate Provost Academic Programs
            Dennis Craig                                                                             Acting President
            Gabrielle Cecere                                                                         President - Student Association
            Julie Piscitello                                                                         VP Finance & Administration
            Charles Ragozzine                                                                        Professor – Math, Computer Science, Statistics
            Christina Roarke                                                                         Executive Director Financial Aid
            Lisa Snyder                                                                              VP Strategy Planning & Effectiveness
            Lachlan Squair                                                                           Chief Facilities Planning & Safety Officer
            Kathleen Webster                                                                         Assistant to the President
            Bill Wilkerson                                                                           Chair Faculty Senate

 I:\Sucf.4261\70616.Energy-Roadmap\Docs\Reports\Clean Energy Master Plan\SUNY Oneonta CEMP_2021-04-14 Final.Docx                                      iv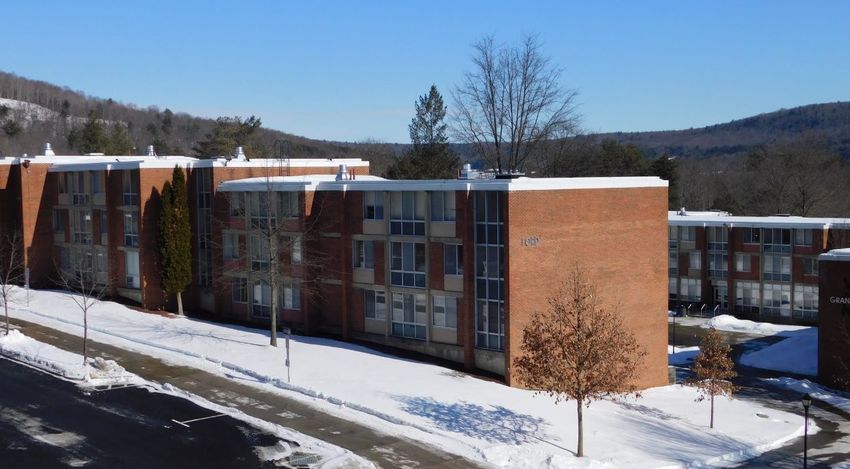
Ramboll – SUNY Oneonta - Clean Energy Master Plan

           FOREWARD

           The Clean Energy Master Plan (CEMP) for SUNY College at Oneonta will create a framework for a
           financially sustainable energy program that focuses on energy-intensity reduction goals, which
           supports meeting the carbon-reduction goals of the campus, and provides reliable low-carbon
           and resilient energy sources that enable and enhance the campus mission.

           The CEMP includes a pathway and a long-term commitment to carbon neutrality, as well as
           assesses the costs and benefits of various pathways in the context of the College’s overall
           financial commitments and campus needs, while optimizing capital resources. The CEMP will be
           used to help inform the next Facilities Master Plan, which begins in 2021. This will include an
           overarching set of principles for how the College approaches energy, as well as recommended
           options to be fully integrated during the Campus Master Plan efforts.

 I:\Sucf.4261\70616.Energy-Roadmap\Docs\Reports\Clean Energy Master Plan\SUNY Oneonta CEMP_2021-04-14 Final.Docx   v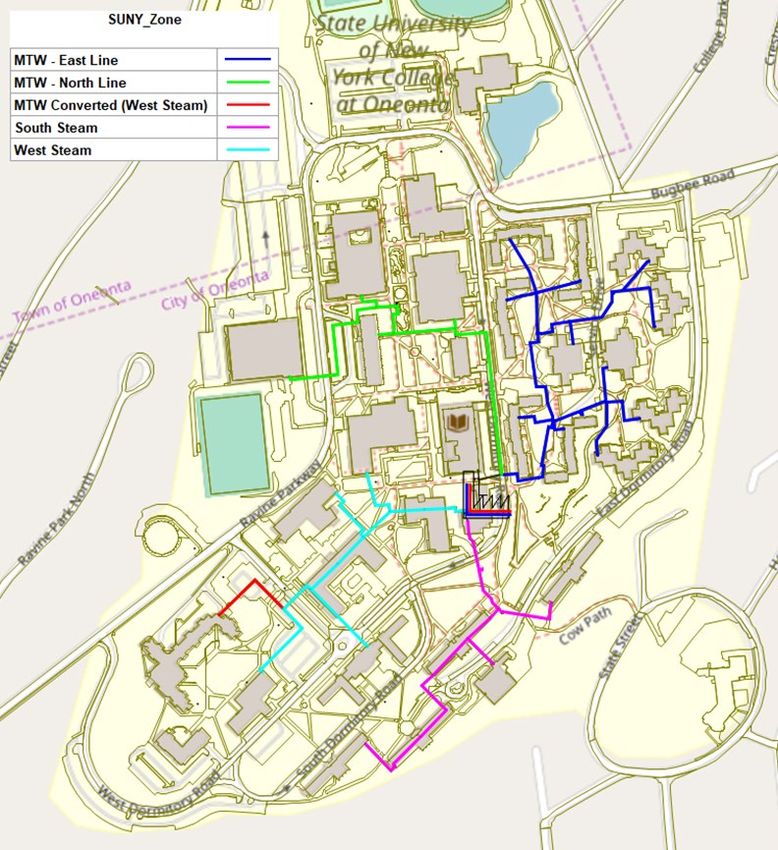
Ramboll – SUNY Oneonta - Clean Energy Master Plan

           EXECUTIVE SUMMARY

           Purpose
           The State University of New York College at Oneonta (SUNY Oneonta) is a Reforming the Energy
           Vision (REV) Campus Challenge Partner under the New York State Energy Research and
           Development Authority (NYSERDA) REV Campus Challenge Technical Assistance for Roadmaps
           program (REV Campus Challenge). NYSERDA co-funded the development of this Clean Energy
           Master Plan (CEMP), which creates a vision for low carbon and renewable technologies and
           operational strategies to reduce fossil fuel use/dependency, increase electrification of utility
           operations, and maintain resiliency and reliability.

           Energy and Climate Drivers
           SUNY Oneonta is subject to New York State Mandates and SUNY System Administration and
           State University Construction Fund (SUCF) Directives associated with energy and carbon (i.e.,
           greenhouse gases (GHG)) reduction targets that include the following:

              New York State Mandate                                                                         Goals
              Executive Order 166 (EO 166)                                                                   Reduce GHG emissions (from 1990 levels):
                                                                                                             •  40% by 2030
                                                                                                             •  80% by 2050
              New Efficiency New York                                                                        •  2025 statewide energy efficiency target of
                                                                                                                185 trillion British thermal units (TBtu) of
                                                                                                                site energy savings
              The Climate Leadership and Community                                                           •  Carbon free electricity system by 2040
              Protection Act (CLCPA)                                                                         •  Reduce GHG 85% below 1990 levels by
                                                                                                                2050

              SUNY and SUCF Directives/Drivers                                                               Goals
              SUCF Directive 1B-2                                                                            •     Commitment to clean energy
                                                                                                             •     Deep energy retrofits on existing buildings
                                                                                                             •     Net zero carbon new buildings
              SUNY Clean Energy Roadmap                                                                      •     Guidelines to help accelerate progress
                                                                                                                   towards NYS’s goal to reduce GHG 40% by
                                                                                                                   2030

           Greenhouse Gas Emissions Trend
           Greenhouse gas emissions from SUNY Oneonta are derived from a variety of energy fuel types.
           From Figure 1 below, 72% of the campus energy use is from fossil fuels, and the remaining 28%
           is from electricity. Approximately 65% of the total energy use is from natural gas and 4% is from
           No. 2 fuel oil. These are the primary fuel sources for heating and are the opportunity areas for
           broader energy efficiency and decarbonization considerations through fossil fuel reduction.

 I:\Sucf.4261\70616.Energy-Roadmap\Docs\Reports\Clean Energy Master Plan\SUNY Oneonta CEMP_2021-04-14 Final.Docx                                                 vi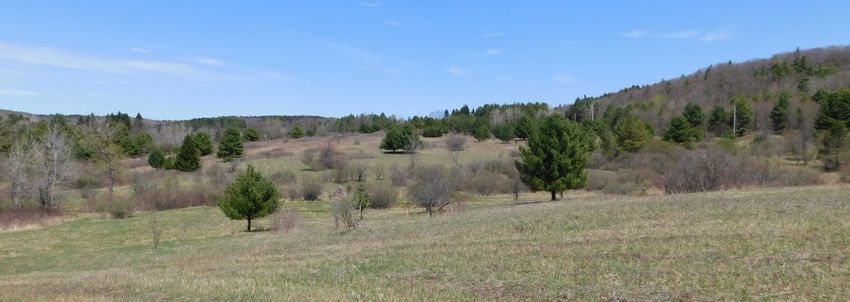
Ramboll – SUNY Oneonta - Clean Energy Master Plan
Propane Diesel
0.6% 0.2% Gasoline
#2 Fuel Oil 1.4%
4.3%
Electricity
28.4%
Natural Gas
65.1%
Figure 1. SUNY Oneonta Energy Use by Fuel Type (CY 2019)
As shown in Figure 2, GHG emissions have reduced 37% since 1990 despite an increase in
building space, operating hours, and student enrollment.
Scope 1 and Scope 2 CO2e Emissions
25,000
37% reduction
since 1990 levels
20,000
15,000
MTCO2 e
10,000
5,000
0
Scope 1 Emissions
Stationary Combustion
Natural gas No. 6 fuel oil No. 2 fuel oil Propane
Other Scope 1
Scope 2 Emissions
Purchased Electricity
Figure 2. SUNY Oneonta GHG Emissions Trend Since Calendar Year 1990
I:\Sucf.4261\70616.Energy-Roadmap\Docs\Reports\Clean Energy Master Plan\SUNY Oneonta CEMP_2021-04-14 Final.Docx vii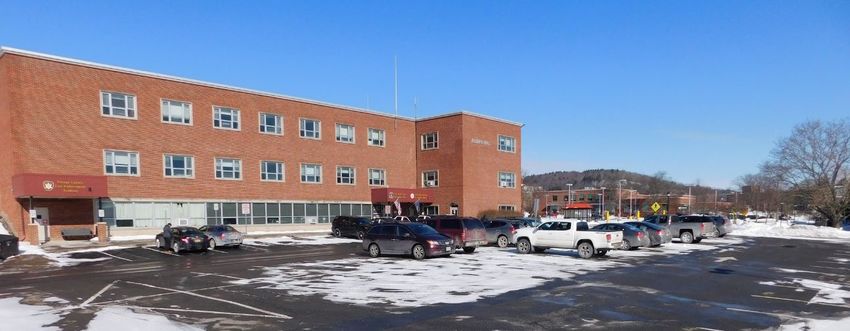
Ramboll – SUNY Oneonta - Clean Energy Master Plan

           Clean Energy Master Plan
           The CEMP process allowed for critical discussion of key mandates and drivers, coupled with
           strategic thinking of clean energy options to create a vision of the most economically viable low
           carbon and renewable technologies and operational strategies to reduce fossil fuel
           use/dependency, increase electrification, and maintain resiliency and reliability.

           Developing the CEMP included assessing energy sources, energy use, potential energy
           conservation measures (ECM), clean energy options, and institutional factors through a process
           of facilitated stakeholder engagement. An assessment of existing conditions through American
           Society of Heating, Refrigerating and Air Conditioning Engineers (ASHRAE) Level 1 walkthroughs,
           followed by ASHRAE targeted audits (Final Report, June 2020) and a high-level feasibility energy
           modeling and scenario planning assessment (November 2020), contributed to the vision of a low
           carbon campus.

           Through aligning campus priorities with vision and goals of EO166, SUNY’s Clean Energy Master
           Plan, the CLCPA, and SUCF directive 1B-2, the actions to reduce energy usage, increase energy
           efficiency, and decrease operating costs include five strategic areas – Energy Efficiency,
           Resiliency, Renewable Energy, Stewardship, and Engagement.

              ENERGY EFFICIENCY
              Energy efficiency and conservation measures often involve capital expenditures that have
              short to moderate payback periods and are focused on driving near term reductions in GHG
              emissions and EUI, sometimes referred to as “low hanging fruit”. Energy efficiency can also
              consider infrastructure renewal under major building renovations or gut rehabilitations that
              will follow the performance goals of SUCF Directive 1B-2.

              RESILIENCY
              Defining resiliency is unique to each campus. Resiliency for SUNY Oneonta is the desire to
              decarbonize by reducing fossil fuel use and increase renewables and electrification. This
              would be a long-term horizon transition, coupled with necessary building renovations, to
              utilize low carbon energy supplies, energy storage, and a dependable alternative to the
              interruptible gas supply.

              RENEWABLE ENERGY
              Renewable energy centers on SUNY Oneonta’s desire to achieve GHG reductions by
              decreasing fossil fuel use and increasing electrification of campus operations that would
              utilize renewable electricity, along with potential use of biomass where economically
              feasible.

              STEWARDSHIP
              Stewardship focuses on the human capital and physical capital needs of managing energy
              systems to achieve and maintain peak performance.

              ENGAGEMENT
              Engagement focuses on how SUNY Oneonta integrates energy and sustainability into the
              cultural fabric of the college, as well as facilitating collaboration and idea sharing with peers
              and in the community.

 I:\Sucf.4261\70616.Energy-Roadmap\Docs\Reports\Clean Energy Master Plan\SUNY Oneonta CEMP_2021-04-14 Final.Docx   viii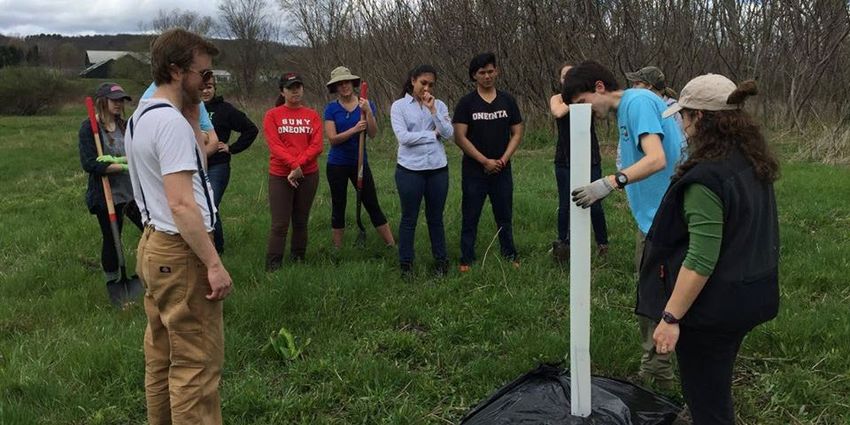
Ramboll – SUNY Oneonta - Clean Energy Master Plan

           Table 1 provides a high-level summary of the planned actions within the five strategic areas and
           the expected reduction of GHG emissions and site EUI.

           Table 1. Energy Roadmap | Strategic Focus Areas

           The fundamental basis for establishing a low carbon campus is transitioning the district heating
           network from a mix of steam and medium temperature hot water (MTW) to low temperature hot
           water (LTW) and moving to 100% renewable sources for electricity, while a shift to all renewable
           electricity and energy efficiency measures are essential to reaching the campus’ targets. Figure 3
           below summarizes the current situation of a steam/MTW-based campus district energy network
           and the vision of a future low carbon energy supply.

 I:\Sucf.4261\70616.Energy-Roadmap\Docs\Reports\Clean Energy Master Plan\SUNY Oneonta CEMP_2021-04-14 Final.Docx   ix
Ramboll – SUNY Oneonta - Clean Energy Master Plan
Figure 3. SUNY Oneonta District Energy Network – Current Versus Vision
To help establish the vision of a future low carbon energy supply, energy modeling and scenario
planning was completed to provide quantitative information and path forward considerations.
Figure 4 represents the scenarios that aligned SUNY Oneonta’s priorities with NYS mandates and
SUNY’s goals/directives.
Base Case – Existing heat
production
• Fossil fuel based
• Medium temperature water
• Steam
Scenario 1 – Energy Conservation
Measures
• Measures that reduce load at the
heating plant
Scenario 3 – Common Measures 1 Scenario 5 – Common Measures 2
• Energy Conservation Measures • Energy Conservation Measures
• Steam to hot water conversion • Steam to hot water conversion
• Lower temperature on MTW • Lower temperature on MTW system
system
• Wood chips hot water boiler
Scenario 7a – Scenario 8a – Scenario 7c – Scenario 8c –
3 + GSHP* and 3 + GSHP, TES, 5 + GSHP and 5 + GSHP, TES,
TES* Solar PV TES Solar PV
* Ground Source Heat Pump (GSHP)
Thermal Energy Storage (TES)
Figure 4. Clean Energy Scenarios Evaluated
I:\Sucf.4261\70616.Energy-Roadmap\Docs\Reports\Clean Energy Master Plan\SUNY Oneonta CEMP_2021-04-14 Final.Docx xRamboll – SUNY Oneonta - Clean Energy Master Plan
Figure 5 provides a comparison of project costs in net present value (NPV) and associated GHG
emissions from the scenarios. The yellow diamonds show the present value for each of the
scenarios in million US Dollars. Costs (capital expenditures, operating and maintenance
expenditures) are accounted for in each year over a 20-year period. The emissions from the base
case (2018) without renewable electricity (gray column) are compared to scenario alternatives
without renewable electricity (blue columns) and with renewable electricity (green column),
which align with the CLCPA commitment to a carbon free electric grid by 2040, as well as SUNY
Oneonta’s participation in the New York Higher Education Large-Scale Renewable Energy (NY HE
LSRE) consortium or another potential power purchase agreement (PPA) option.
Figure 5. Low Carbon Energy Scenarios Comparison
While a final scenario has not be selected by SUNY Oneonta, the results of this effort provide a
roadmap for near-term actions and a decision-making framework for the long-term vision to
meet or exceed NYS energy efficiency and GHG reduction mandates and set a path for carbon
neutrality.
Establishing the LTW network will have challenges and will require careful consideration to
maintain building heating throughout the project period. It may be necessary in early project
phases to have both the new low temperature hot water network in operation together with the
existing steam and MTW networks. Figure 6 provides a proposed phasing plan to transition steam
and MTW to low temperature that aims for a pragmatic timeframe.
I:\Sucf.4261\70616.Energy-Roadmap\Docs\Reports\Clean Energy Master Plan\SUNY Oneonta CEMP_2021-04-14 Final.Docx xiRamboll – SUNY Oneonta - Clean Energy Master Plan
Figure 6. Proposed Steam to Low Temperature Hot Water Phasing Plan
Greenhouse Gas Emissions and Energy Use Intensity Reduction Impact
The combination of ECMs identified from the energy assessment with the clean energy scenarios
has the potential to reduce the GHG emissions below the 80% reduction target set forth by EO
166, as shown in Figure 7. Additionally, the campus has the potential to reduce the site energy
use intensity (EUI) to an estimated 70 kilo (1,000) British thermal units per gross square feet
(kBtu/GSF) over the next 25 years, as shown in Figure 8.
I:\Sucf.4261\70616.Energy-Roadmap\Docs\Reports\Clean Energy Master Plan\SUNY Oneonta CEMP_2021-04-14 Final.Docx xiiRamboll – SUNY Oneonta - Clean Energy Master Plan
Figure 7. GHG Emissions Trajectory
Site EUI
140.0
120.0
100.0
kBtu/GSF
80.0
60.0
40.0
20.0
0.0
Figure 8. Site Energy Use Intensity Trajectory
I:\Sucf.4261\70616.Energy-Roadmap\Docs\Reports\Clean Energy Master Plan\SUNY Oneonta CEMP_2021-04-14 Final.Docx xiiiRamboll – SUNY Oneonta - Clean Energy Master Plan
Next Steps
The CEMP will guide actions over a 20-year horizon and establishes SUNY Oneonta’s desire and
commitment to be a leader of energy and sustainability within SUNY. Energy reductions are
achieved through decreasing fossil fuel use, establishing a platform for electrification
and clean energy supply technologies, using renewable energy, completing building
upgrades, stewardship of physical assets, and engaging campus stakeholders.
SUNY Oneonta began a new Facilities Master Plan (FMP) process in Q1 2021. SUNY Oneonta will
integrate the CEMP and upcoming FMP to complement capital planning and modernization of
campus buildings including critical maintenance and SUCF Directive 1B-2. As a result, the CEMP
will be amended following the completion of the FMP in order to create further alignment between
these two important campus planning documents.
I:\Sucf.4261\70616.Energy-Roadmap\Docs\Reports\Clean Energy Master Plan\SUNY Oneonta CEMP_2021-04-14 Final.Docx xivRamboll – SUNY Oneonta - Clean Energy Master Plan
1. PURPOSE, DRIVERS AND APPROACH
1.1 Purpose
The New York State Energy Research and Development Authority (NYSERDA) Reforming the
Energy Vision (REV) Campus Challenge Technical Assistance for Roadmaps program (REV
Campus Challenge) supports REV Campus Challenge members by providing the means for
campuses to evaluate existing energy-related conditions on campus and establish an Energy
Roadmap for managing changing campus energy needs. As a State University of New York
(SUNY) institution and REV Campus Challenge member, SUNY Oneonta is committed to the goals
of the REV Campus Challenge through the development of this NYSERDA co-funded Clean Energy
Master Plan (CEMP), along with assisting other colleges and universities in this process through
collaboration and sharing best practices and lessons learned.
1.2 Energy and Climate Drivers
SUNY Oneonta is subject to New York State Mandates and SUNY System Administration and
State University Construction Fund (SUCF) Directives associated with energy and carbon (i.e.,
greenhouse gases (GHG)) reduction targets that include the following:
New York State Mandate Goals
Executive Order 166 (EO 166) Reduce GHG emissions (from 1990 levels):
• 40% by 2030
• 80% by 2050
New Efficiency New York • 2025 statewide energy efficiency target
of 185 trillion British thermal units (TBtu)
of site energy savings
The Climate Leadership and Community • Carbon free electricity system by 2040
Protection Act (CLCPA) • Reduce GHG 85% below 1990 levels by
2050
SUNY and SUCF Directives/Drivers Goals
SUCF Directive 1B-2 • Commitment to clean energy
• Deep energy retrofits on existing
buildings
• Net zero carbon new buildings
SUNY Clean Energy Roadmap • Guidelines to help accelerate progress
towards NYS’s goal to reduce GHG 40%
by 2030
1.3 Approach and Guiding Principles
The CEMP development approach was a deliberate and collaborative process of stakeholder
engagement that allowed for critical discussion of key institutional goals and targets, strategic
thinking of clean energy options and best practices, and establishing strategies to implement the
CEMP. Engagement and thought leadership from SUNY Oneonta Office of Facilities, Safety, and
Physical Plant (OFSPP) were critical to aligning campus priorities with SUNY’s Clean Energy
Roadmap ambitious goals. Key stakeholder engagement meetings conducted during the
development of the CEMP are summarized below in Table 2. Guiding principles that have
I:\Sucf.4261\70616.Energy-Roadmap\Docs\Reports\Clean Energy Master Plan\SUNY Oneonta CEMP_2021-04-14 Final.Docx 1Ramboll – SUNY Oneonta - Clean Energy Master Plan
influenced SUNY Oneonta’s campus priorities in strategic focus areas of Energy Efficiency,
Resiliency, Renewable Energy, Stewardship, and Engagement (described in Section 3) include:
1. Create a CEMP that provides a roadmap for near-term actions and a decision-making
framework for the long-term vision to meet or exceed NYS energy efficiency and GHG
reduction mandates and set a path for carbon neutrality.
2. Identify the most economically viable clean energy (low carbon and renewable) technologies
and operational strategies to reduce fossil fuel use/dependency, increase electrification, and
provide increased resiliency and reliability.
3. Integrate the CEMP and upcoming Facilities Master Plan (FMP) (2021-2022) to complement
capital planning and modernization of campus buildings including critical maintenance and
SUCF Directive 1B-2.
4. Incorporate campus operations with curriculum, research, and workforce development.
Table 2. Key Stakeholder Engagement Meetings
Date Audience Purpose
Kickoff meeting to share overview of the
CEMP process, seek input on energy and
October 2018 OFSPP
GHG reduction goals, and discuss key
milestones
Discuss preliminary energy-use analysis
January 2019 OFSPP (PEA) results and initial walk-through
survey findings
Discuss results and findings of the ASHRAE
September 2019 OFSPP
Targeted Audits
Discuss results of hydraulic modeling, and
January 2020 OFSPP
energy modeling and scenario planning
Discuss updated results of energy
March 2020 OFSPP
modeling and scenario planning
Share overview of the CEMP process and
May 2020 President’s Executive Council the vision of a low carbon campus to help
meet energy and GHG goals
I:\Sucf.4261\70616.Energy-Roadmap\Docs\Reports\Clean Energy Master Plan\SUNY Oneonta CEMP_2021-04-14 Final.Docx 2Ramboll – SUNY Oneonta - Clean Energy Master Plan
2. ASSESS – EXISTING CONDITIONS AND OPPORTUNITIES
The CEMP process initiated with an October 2018 kickoff meeting with the CEMP Implementation
Team and SUCF to discuss existing conditions and opportunities and the broad picture of “where
are we now” relative to the campus energy program. An assessment of existing conditions
through American Society of Heating, Refrigerating and Air Conditioning Engineers (ASHRAE)
Level 1 walkthroughs, followed by ASHRAE targeted audits (June 2020) and a high-level
feasibility energy modeling and scenario planning assessment (November 2020), aided in
developing a roadmap towards envisioning a low carbon campus. SUNY Oneonta’s longstanding
actions around energy and sustainability are presented in Figure 9.
Figure 9. Recent History of Energy and Sustainability Actions at SUNY Oneonta
2.1 Greenhouse Gas Emissions and Energy Use Intensity
Greenhouse gas emissions from SUNY Oneonta are derived from a variety of energy fuel types.
From Figure 10 below, 72% of the campus energy use is from fossil fuels, and the remaining
28% is from electricity. Approximately 65% of the total energy use is from natural gas and 4% is
from No. 2 fuel oil. These are the primary fuel sources for space heating and domestic hot water
heating and are the opportunity areas for broader energy efficiency and decarbonization
considerations through fossil fuel reduction. Propane (used for heating at Cooperstown Biological
Field Station (BFS)), diesel, gasoline, and kerosene account for about 3% of the total energy use.
I:\Sucf.4261\70616.Energy-Roadmap\Docs\Reports\Clean Energy Master Plan\SUNY Oneonta CEMP_2021-04-14 Final.Docx 3Ramboll – SUNY Oneonta - Clean Energy Master Plan
Propane Diesel
0.6% 0.2% Gasoline
#2 Fuel Oil 1.4%
4.3%
Electricity
28.4%
Natural Gas
65.1%
Figure 10. SUNY Oneonta Energy Use by Fuel Type (CY 2019)
Figure 11 below summarizes the GHG emissions (Scope 1 and Scope 2 sources) trend from
calendar year (CY) 1990 through CY2019, where CY1990 is being considered the baseline year
for GHG emissions in this CEMP. The values represent SUNY Oneonta facilities and properties
including the main campus and Cooperstown BFS.
Scope 1 emissions are direct emissions from sources owned and controlled by SUNY Oneonta
(e.g., district steam boilers, building hot water boilers, vehicle fleet) and Scope 2 emissions are
indirect emissions from sources that are owned or operated by SUNY Oneonta, but whose
products are directly linked to on campus energy inputs (e.g., purchased electricity).
GHG emissions have reduced 37% since 1990 despite a 250,000 gross square feet (GSF)
increase in building space, buildings staying open longer, and a 16% increase in student
enrollment. The campus has reduced GHG emissions by 20% since CY2007, not only from the
grid becoming cleaner over time, but also by switching the backup heating plant fuel from No. 6
fuel oil to No. 2 fuel oil.
Figure 12 provides a graphical representation of energy use intensity (EUI) over the same time
period. EUI is estimated based on site energy data and total SUNY Oneonta building property
gross square footage. The overall trend (which is not weather normalized) has remained
relatively constant.
I:\Sucf.4261\70616.Energy-Roadmap\Docs\Reports\Clean Energy Master Plan\SUNY Oneonta CEMP_2021-04-14 Final.Docx 4Ramboll – SUNY Oneonta - Clean Energy Master Plan
Scope 1 and Scope 2 CO2e Emissions
25,000
37% reduction
since 1990 levels
20,000
15,000
MTCO2 e
10,000
5,000
0
Scope 1 Emissions
Stationary Combustion
Natural gas No. 6 fuel oil No. 2 fuel oil Propane
Other Scope 1
Scope 2 Emissions
Purchased Electricity
Figure 11. SUNY Oneonta GHG Emissions Trend Since Calendar Year 1990
Site Energy Use Intensity
140
120
100
kBtu/GSF
80
60
40
20
0
Site EUI
Figure 12. SUNY Oneonta Energy Use Intensity Trend Since Calendar Year 1990
I:\Sucf.4261\70616.Energy-Roadmap\Docs\Reports\Clean Energy Master Plan\SUNY Oneonta CEMP_2021-04-14 Final.Docx 5Ramboll – SUNY Oneonta - Clean Energy Master Plan
2.2 Existing Conditions and Opportunities
Developing the CEMP included assessing energy sources, energy use, potential energy
conservation measures (ECM), clean energy options, and institutional factors through a process
of facilitated stakeholder engagement. Through aligning campus priorities with vision and goals
of EO166, SUNY’s Clean Energy Master Plan, the CLCPA, and SUCF directive 1B-2, the actions to
reduce energy usage, increase energy efficiency, and decrease operating costs include five
strategic areas – Energy Efficiency, Resiliency, Renewable Energy, Stewardship, and
Engagement. Table 3 through Table 6 summarize the primary observations and opportunities in
those five strategic focus areas.
Ford Hall – Full renovation expected to occur from spring 2023 through summer 2024; building envelope, high
efficiency HVAC systems, solar thermal domestic water; and designed to achieve SUNY goals for Deep Energy
Retrofits (DER)
Table 3. Energy Efficiency - Existing Conditions and Opportunities
ASSESS: Existing Conditions and Opportunities
Existing Conditions Opportunities
ENERGY EFFICIENCY
Energy efficiency and conservation measures often involve capital expenditures that have
short to moderate payback periods and are focused on driving near term reductions in GHG
emissions and EUI, sometimes referred to as “low hanging fruit”. Energy efficiency can also
consider infrastructure renewal under major building renovations or gut rehabilitations that will
follow the performance goals of SUCF Directive 1B-2.
• Numerous small LED • ECMs studied as part of the
conversion projects CEMP development:
recently completed o Interior LED lighting
Main Campus o Fluorescent fixtures upgrades
are still the o Building automation
predominant system (BAS) control
enhancements
I:\Sucf.4261\70616.Energy-Roadmap\Docs\Reports\Clean Energy Master Plan\SUNY Oneonta CEMP_2021-04-14 Final.Docx 6Ramboll – SUNY Oneonta - Clean Energy Master Plan
ASSESS: Existing Conditions and Opportunities
Existing Conditions Opportunities
technology for o Kitchen demand-
interior lighting controlled ventilation
• Exterior lighting (DCV)
upgraded to LED o Chilled water and hot
• Heating for majority of water pump variable
buildings provided by frequency drives (VFDs)
district heating plant o Convert constant volume
• De-centralized cooling single zone systems to
provided by air-cooled single zone variable air
and water-cooled chillers volume (VAV) systems
or direct expansion o Carbon dioxide (CO2)-
cooling based demand-controlled
• Implementation of the ventilation for high
FMP (2013-2023) has occupancy areas
resulted in improved o Steam and medium
electrical, HVAC, and temperature water (MTW)
thermal performance distribution pipe insulation
through building
renovations
• Propane-fired hot water • BAS control enhancements
condensing boilers • Interior LED lighting upgrades
Cooperstown Biological • Air-cooled chiller with R-
Field Station 22 refrigerant
• Variable laboratory
supply and exhaust
• Campus sub-metering • Potential for building level
for water and electricity thermal sub-metering
in all buildings • Further deep sub-metering
Building Level Sub- within individual buildings at a
metering system level
• Potential to leverage
NYSERDA’s Real-Time Energy
Manager (RTEM) Program
I:\Sucf.4261\70616.Energy-Roadmap\Docs\Reports\Clean Energy Master Plan\SUNY Oneonta CEMP_2021-04-14 Final.Docx 7Ramboll – SUNY Oneonta - Clean Energy Master Plan
Alumni Hall – Full renovation is expected to occur from summer 2021 through summer 2023; geothermal field
planned in the parking lot for a ground source heat pump system designed for heating and cooling
Table 4. Resiliency - Existing Conditions and Opportunities
ASSESS: Existing Conditions and Opportunities
Existing Conditions Opportunities
RESILIENCY
Defining resiliency is unique to each campus. Resiliency for SUNY Oneonta is the desire to
decarbonize by reducing fossil fuel use and increase renewables and electrification. This would
be a long-term horizon transition, coupled with necessary building renovations, to utilize low
carbon energy supplies, energy storage, and a dependable alternative to the interruptible gas
supply.
• SUNY Oneonta operates • Transition from steam and
steam and MTW MTW to a low temperature hot
distribution networks. water (LTW) distribution
Approximately 28% of network that would:
buildings on campus are o Enable a platform for low
connected to the steam carbon/renewable energy
distribution and 54% of supplies such as
buildings are connected geothermal, thermal
to the MTW distribution. energy storage, and heat
The remaining 19% pumps
have de-centralized o Provide flexibility towards
heating systems (e.g. general technology
satellite boilers). developments
District Energy Network
• Steam distribution o Align with SUCF Directive
serves 1B-2 for deep energy
o Alumni Hall retrofits and energy
o Chase PE efficiency
o Golding o Become more energy
o Human Ecology independent and better
o Lee manage utility costs
o Littell o Potential for biomass or
o Morris Complex bio-oil boiler to replace
o Physical Science natural gas consumption
o Science 1 o Help meet or exceed GHG
o Tobey mandates
o Wilber
I:\Sucf.4261\70616.Energy-Roadmap\Docs\Reports\Clean Energy Master Plan\SUNY Oneonta CEMP_2021-04-14 Final.Docx 8Ramboll – SUNY Oneonta - Clean Energy Master Plan
ASSESS: Existing Conditions and Opportunities
Existing Conditions Opportunities
• MTW distribution serves • SUNY Oneonta desires to
o Alumni Field House decarbonize by reducing fossil
o Blodgett fuel use and increase
o Curtis renewables and electrification.
o Fine Arts This would be a long-term
o Ford horizon transition and would
o Grant be coupled with necessary
o Hays building renovations to utilize
o Hulbert low carbon energy supplies. As
o Huntington an interim transition step, low
o IRC pressure steam would be
o Macduff needed for the Heating Plant
o Matteson and Morris Complex, until the
o Mills buildings are renovated
o Milne Library • Replace antiquated and
o Netzer unsupported heating plant
o Schumacher controls with a new control
o Sherman system that would support the
o Wilsbach heating plants operation for
• Antiquated heating plant the next 10 to 15 years
controls that are no
longer supported by
manufacturer
• Alumni Hall will have a • Preparing fit up for eventually
geothermal well field to tying this geothermal well field
provide 100 tons of to the future district LTW loop
cooling capacity and 1 with central heat pump
million British thermal operation
units per hour
(MMBtu/hr) of heating
Geothermal capacity
• Water-to-water heat
pumps will provide
chilled water and hot
water to dedicated
outdoor air system, fan
coil units, and chilled
beams in Alumni Hall
• Numerous chillers with • Replace R-22 chillers with
R-22 refrigerant high-efficiency chillers with
more environmentally friendly
refrigerant
De-centralized cooling
• Alternatively, centralized
supply of cooling from district
heat pumps should be
evaluated
• A new FMP process will • Integration of the FMP with
take place from 2021- CEMP to align the vision,
Facilities Master Plan
2022 projects, and implementation
phasing of both documents
I:\Sucf.4261\70616.Energy-Roadmap\Docs\Reports\Clean Energy Master Plan\SUNY Oneonta CEMP_2021-04-14 Final.Docx 9Ramboll – SUNY Oneonta - Clean Energy Master Plan
Collins Property: North of campus; potential location for strategic consideration of renewable energy systems
such as solar PV, solar thermal, wind, or carbon sequestration
Table 5. Renewable Energy - Existing Conditions and Opportunities
ASSESS: Existing Conditions and Opportunities
Existing Conditions Opportunities
RENEWABLE ENERGY
Renewable energy centers on SUNY Oneonta’s desire to achieve GHG reductions by decreasing
fossil fuel use and increasing electrification of campus operations that would utilize renewable
electricity, along with potential use of biomass where economically feasible.
• Participating in New York • A near-term 10-year plus
Higher Education Large agreement to purchase
Scale Renewable Energy electricity generated by large
(NY HE LSRE), a large- scale solar PV farms in NYS
Offsite Large-Scale scale solar consortium of
Solar PV New York State public
and private campuses.
Price estimates and
detailed analysis were
completed during 2020.
• No solar PV exists on • Collins property has been
campus identified as a potential
• Two investigations into location for a large-scale on
solar PV (1.8 MW and campus solar PV array
2.0 MW) • To be further investigated
• NYPA assessment of 2.5 during the FMP process in
MW and 5.0 MW arrays 2021
at the Collins property • Through the CLCPA, NYS is
committed to reducing GHG
Campus Solar PV
gas emissions 85% by 2050
(from 1990 levels) and having
a carbon free electric grid by
2040. In this case, the electric
grid is expected to be
incrementally cleaner each
year towards those goals, thus
impacting SUNY Oneonta’s
annual GHG emissions
I:\Sucf.4261\70616.Energy-Roadmap\Docs\Reports\Clean Energy Master Plan\SUNY Oneonta CEMP_2021-04-14 Final.Docx 10Ramboll – SUNY Oneonta - Clean Energy Master Plan
Physical Science II Building - Air Handling Unit #2
Table 6. Stewardship - Existing Conditions and Opportunities
ASSESS: Existing Conditions and Opportunities
Existing Conditions Opportunities
STEWARDSHIP
Stewardship focuses on the human capital and physical capital needs of managing energy
systems to achieve and maintain peak performance.
• Campus Energy Manager • Implementation of short-term
Campus Energy
established in 2015 and long-term actions within
Management
the CEMP
• Established workforce • Potential participation in
and potential for NYSERDA PON 3715 –
institutional knowledge Workforce Training: Building
loss in the next 5 to 10 Operations & Maintenance for
years from the trade energy management and
crafts and supervisors human capital development
due to retirement and/or through On-the-Job-Training
career transition (OTJT)
• Continued development of
tools and skill sets that are
required to make the program
Workforce Training
sustainable, New York Energy
Manager (NYEM), along with
integrating new training
initiatives within standard
business procedures and
merge training into the
campus culture to support
operations and maintenance
• Continued documentation and
recording of existing
institutional knowledge
I:\Sucf.4261\70616.Energy-Roadmap\Docs\Reports\Clean Energy Master Plan\SUNY Oneonta CEMP_2021-04-14 Final.Docx 11Ramboll – SUNY Oneonta - Clean Energy Master Plan
ASSESS: Existing Conditions and Opportunities
Existing Conditions Opportunities
• Preventive Maintenance • Continuous development of
Software – Equipment preventative and predictive
inventory, preventative maintenance program
Preventive Maintenance
maintenance (PM), and
Focus
work order management
are currently through
TMI
• Campus sub-metering • Potential for system level
for water and electricity submetering, and
in all buildings connection/integration cloud-
• CopperTree Analytics based analytics platforms like
Advanced Metering and platform installed in NYEM and RTEM
Data Analysis newly renovated • Potentially expand the
Huntington Hall for CopperTree platform to more
continuous buildings
commissioning and fault
detection
• 2018 RCx study by • Make RCx and ongoing
Guth-DeConzo of commissioning Cx an integral
o Chase PE part of the College’s O&M
Retro-commissioning o Fine Arts program
(RCx) o Human Ecology
o IRC
o Science 1
o Wilber Hall
• 2011 Climate Action Plan • Update CAP to align with
(CAP) updated in 2012 EO166, CLCPA, and SUNY
• Campus Sustainability Clean Energy Roadmap goals
Coordinator established • Decide if CAP and CEMP should
in 2012 be merged or maintained as
Sustainability Standards
• President’s Advisory separate plans
Council on Sustainability
established in 2012
• 2018 Sustainability
Master Plan
• Building Temperature • Enforcement of guidelines
Policy • Complete and/or develop
Energy Policies and
program and policy changes
Guidelines
that support reduced emission
behaviors
• Collins property exists • Collins property could be
with some forest lands assessed for potential carbon
sequestration management in
Forest Management and
offsetting a portion of SUNY
Sequestration
Oneonta’s GHG emissions
towards NYS mandates and
campus neutrality goals
I:\Sucf.4261\70616.Energy-Roadmap\Docs\Reports\Clean Energy Master Plan\SUNY Oneonta CEMP_2021-04-14 Final.Docx 12Ramboll – SUNY Oneonta - Clean Energy Master Plan
ASSESS: Existing Conditions and Opportunities
Existing Conditions Opportunities
• A new FMP process will • Integration of the CEMP and
take place from 2021- FMP
Planning Documents 2022 • SUCF and capital fund critical
maintenance plans and
projects
Student engagement in tree planting
Table 7. Engagement Existing Conditions and Opportunities
ASSESS: Existing Conditions and Opportunities
Existing Conditions Opportunities
ENGAGEMENT
Engagement focuses on how SUNY Oneonta integrates energy and sustainability into the
cultural fabric of the college, as well as facilitating collaboration and idea sharing with peers
and in the community.
• NYSERDA REV Campus • Committed to attaining AASHE
Challenge Leader STARS Gold
SUNY Oneonta-Wide • Achieved AASHE STARS • Continued focus on promoting
Overview Silver in 2018 energy conversation
awareness to impact
behavioral change
I:\Sucf.4261\70616.Energy-Roadmap\Docs\Reports\Clean Energy Master Plan\SUNY Oneonta CEMP_2021-04-14 Final.Docx 13Ramboll – SUNY Oneonta - Clean Energy Master Plan
ASSESS: Existing Conditions and Opportunities
Existing Conditions Opportunities
• 2011 Climate Action Plan • Including energy and green
• AASHE STARS reports building curriculum within the
• Environmental Environmental Sustainability
Sustainability major major or related majors
introduced in 2015 • A sustainability graduation
• “Greening the requirement could be
Educational Experience” considered
• A two-tier sustainability • Continue funding of SUNY PIF
designation program Green Energy Workforce
that has courses Development program
designated as including
sustainability themes in
half of the College’s
departments
• An annual faculty
development program
that helps faculty
integrate sustainability
Curriculum and Student
into existing or new
Engagement
courses
• Sustainability events are
hosted throughout the
academic year including
a week-long celebration
around Earth Day, and
Green Dragon Week.
• Student internships in
the Office of
Sustainability
• Green Building Design
courses are offered in
the Environmental
Sustainability
Department through
SUNY PIF Green Energy
Workforce Development
funding
• Sharing lessons learned • Share Oneonta story with
and best practices commercial and industrial
through existing and businesses within Otsego
new channels County.
• Engagement with New • Help promote economic
York Coalition of development opportunities in
Sustainability in Higher the area
Outreach and
Education (NYCSHE) and
Community Engagement
the SUNY Sustainability
Coalition
• Participation in NYSERDA
REV Workshops
• Members of the Otsego
County Energy Task
Force
I:\Sucf.4261\70616.Energy-Roadmap\Docs\Reports\Clean Energy Master Plan\SUNY Oneonta CEMP_2021-04-14 Final.Docx 14Ramboll – SUNY Oneonta - Clean Energy Master Plan
3. ACT – CLEAN ENERGY MASTER PLAN
The CEMP process allowed for critical discussion of key mandates and drivers, coupled with
strategic thinking of clean energy options to create a vision of the most economically viable low
carbon and renewable technologies and operational strategies to reduce fossil fuel
use/dependency, increase electrification, and provide increased resiliency and reliability. Table 8
below provides a high-level summary of the planned actions within the five strategic areas of
Energy Efficiency, Resiliency, Renewable Energy, Stewardship, and Engagement and the
expected reduction of GHG emissions and site EUI.
Table 8. Energy Roadmap | Strategic Focus Areas
I:\Sucf.4261\70616.Energy-Roadmap\Docs\Reports\Clean Energy Master Plan\SUNY Oneonta CEMP_2021-04-14 Final.Docx 15Ramboll – SUNY Oneonta - Clean Energy Master Plan
3.1 Basis for a Low Carbon Transition
The fundamental basis for establishing a low carbon campus is transitioning the district heating
network from a mix of steam and MTW to low temperature hot water. Figure 13 below
summarizes the current situation of a steam/MTW-based campus district energy network and the
vision of a future low carbon energy supply. This conversion has the following attributes:
• Allows the use of existing assets to maximum extent practical during the transition period
• Enables a flexible system where low carbon technologies can be incorporated over time – a
plug and play approach, while providing provisions for future developments of heating and
cooling technology developments
• Allows the use of existing assets to extent practical during the transition period
• Integrates with building improvements tied to FMP
Steam and medium temperature water Low temperature hot water distribution
(MTW) distribution system system and thermal storage –
easy plugin of low carbon technologies
Fossil fuel boilers as base load Heat pumps for base load (electrification)
and peaking Fossil fuel or biomass boilers for peaking
and backup
Electricity from the utility grid Electricity from solar PPA
Owned solar PV on Collins Property
Future renewable energy grid
Figure 13. SUNY Oneonta District Energy Network – Current Versus Vision
Figure 14 details the existing distribution network, which has three MTW lines (North, East, and
West) and two steam lines (South and West). The West MTW line serves Hulbert Hall and is fed
from the West Steam line via a medium pressure steam to MTW heat exchanger located in
Human Ecology.
I:\Sucf.4261\70616.Energy-Roadmap\Docs\Reports\Clean Energy Master Plan\SUNY Oneonta CEMP_2021-04-14 Final.Docx 16Ramboll – SUNY Oneonta - Clean Energy Master Plan
Figure 14. Existing Distribution Network
3.2 Energy Modeling and Scenario Planning
To help establish the vision of a future low carbon energy supply, a feasibility study of energy
demand and supply scenarios was completed to provide quantitative information and path
forward considerations. The existing conditions (i.e., Base Case) were compared to fourteen
scenarios that included integrated variations of measures and technologies such as energy
conservation measures, steam and MTW to low temperature hot water conversion, ground source
heat pumps (GSHP), thermal energy storage (TES), biomass, bio-oil, and solar PV. The results
are summarized in an Energy Scenario Planning Report (November 2020) that can be referenced
for specific details.
A stakeholder engagement meeting was held on May 14, 2020 with the SUNY Oneonta CEMP
committee and SUNY Oneonta Administration to share the energy modeling and scenario
planning results and discuss current and future district energy aspects. Figure 15 represents the
I:\Sucf.4261\70616.Energy-Roadmap\Docs\Reports\Clean Energy Master Plan\SUNY Oneonta CEMP_2021-04-14 Final.Docx 17Ramboll – SUNY Oneonta - Clean Energy Master Plan
six scenarios (3, 5, 7a, 8a, 7c, and 8c) that aligned SUNY Oneonta’s priorities with NYS mandates
and SUNY’s goals/directives.
Base Case – Existing heat
production
• Fossil fuel based
• Medium temperature water
• Steam
Scenario 1 – Energy Conservation
Measures
• Measures that reduce load at the
heating plant
Scenario 3 – Common Measures 1 Scenario 5 – Common Measures 2
• Energy Conservation Measures • Energy Conservation Measures
• Steam to hot water conversion • Steam to hot water conversion
• Lower temperature on MTW • Lower temperature on MTW system
system
• Wood chips hot water boiler
Scenario 7a – Scenario 8a – Scenario 7c – Scenario 8c –
3 + GSHP* and 3 + GSHP, TES, 5 + GSHP and 5 + GSHP, TES,
TES* Solar PV TES Solar PV
* Ground Source Heat Pump (GSHP)
Thermal Energy Storage (TES)
Figure 15. Clean Energy Scenarios Evaluated
Scenarios 3 and 5 are common measures, with Scenario 5 including the introduction of a biomass
(wood chip) hot water boiler into the boiler plant. Of those common measures, ECMs around
campus have been and will continue to be implemented. While emissions for biomass and bio-oil
are similar, biomass appeared more favorable to the campus because it is a more cost-effective
fuel than bio-oil. This analysis assumes biomass and bio-oil have limited GHG emissions given
their consideration as renewable energy sources. However, there are regular ongoing discussions
about the sustainability of using biomass (e.g. wood pellets or wood chips) and bio-oil.
Scenarios 7a and 7c include a central GSHP system, and a low temperature hot water network is
envisioned that would include thermal energy storage. A final location of the wells has not been
determined at this time, but several possible locations have been identified, as shown below in
Figure 16 and Table 9.
I:\Sucf.4261\70616.Energy-Roadmap\Docs\Reports\Clean Energy Master Plan\SUNY Oneonta CEMP_2021-04-14 Final.Docx 18Ramboll – SUNY Oneonta - Clean Energy Master Plan
06
04 03
05
01
02
Figure 16. Location of Wells for the GSHP System
Table 9. Potential Capacity from GSHP System
Est no. Cooling Heating
Area
Area Description of Capacity Capacity
(SF)
wells (ton) (kBtu/hr)
Area planned for 24 wells next to Denison Hall (No. 10) and
01 43,034 111 217 3,700
Tobey Hall (No. 41). Area approx. 328 x 131 feet
Area next to Hulbert Hall (No. 20). Approximately 98 x 229
02 22,400 58 113 1,933
feet
03 Parking lot in front of building 32 25,820 66 129 2,200
04 Parking lot at Alumni Field House (98 x 656) 64,300 166 325 5,533
Parking lot next to Human Ecology (No 21). Area: 147 x 164
05 24,100 62 121 2,067
ft
06 Parking lot next to tennis courts and building 27 59,171 152 297 5,067
Total 238,825 615 1,202 20,500
Scenarios 8a and 8c include the addition of a 2.5 MW solar PV array. The Collins property has
been identified as a potential location for solar PV. A mixed use of the Collins property has been
discussed, including solar PV, solar thermal, recreational use, and a portion as a carbon
sequestration wood lot.
I:\Sucf.4261\70616.Energy-Roadmap\Docs\Reports\Clean Energy Master Plan\SUNY Oneonta CEMP_2021-04-14 Final.Docx 19Ramboll – SUNY Oneonta - Clean Energy Master Plan
3.3 Scenario Planning – Economic Results and Discussion
Figure 17 provides a comparison of project costs in net present value (NPV) and associated GHG
emissions from the scenarios. By developing a low temperature hot water loop for district heating
and establishing a platform for low carbon technologies, it will be possible to lower emissions
considerably. The total costs over the 20-year evaluation period are higher than in the existing
conditions (base case) when moving toward low carbon emission technologies. This is primarily
due to low natural gas prices. However, SUNY Oneonta has resiliency and reliability concerns
related to the region’s natural gas capacity constraints and pipeline condition that results in New
York State Electric & Gas (NYSEG) interruptions during the heating season.
The yellow diamonds show the present value for each of the scenarios in million US Dollars. Costs
(capital expenditures, operating and maintenance expenditures) are accounted for in each year
over a 20-year period. The emissions from the base case (2018) without renewable electricity
(gray column) are compared to scenario alternatives without renewable electricity (blue columns)
and with renewable electricity (green column), which align with the CLCPA commitment to a
carbon free electric grid by 2040, as well as SUNY Oneonta’s participation in the NY HE LSRE
consortium or another potential power purchase agreement (PPA) option.
Figure 17. Low Carbon Energy Scenarios Comparison
Capital and operating and maintenance expenditures are accounted for in a 20-year period NPV.
The residual value of assets that have a technical lifetime beyond the 20-year period is also
considered. The net present value is the lifetime costs assuming a 4.5% discount rate.
NPV costs increase from the existing conditions because costs for energy efficiency measures and
conversion of steam buildings to hydronic have been incorporated into the models. The estimated
total capital expenditure is approximately $14 million and only considers energy measures
associated with heat demand reduction.
Key attributes and the estimated percent carbon reduction for each scenario are summarized in
Table 10, below.
I:\Sucf.4261\70616.Energy-Roadmap\Docs\Reports\Clean Energy Master Plan\SUNY Oneonta CEMP_2021-04-14 Final.Docx 20Ramboll – SUNY Oneonta - Clean Energy Master Plan
Table 10. Low Carbon Energy Scenario Attributes
Estimated
Estimated
Carbon
Carbon
Reduction from
Reduction from
Scenario Key Attributes Baseline
Baseline
without
with Renewable
Renewable
Electricity (%)
Electricity (%)
• Existing steam/MTW distribution from
Base
heating plant (natural gas/fuel oil) - -
Case
• Natural gas satellite boilers
• Energy efficiency measures that reduce
1 heat demand 13% 36%
• Heat demand reduced by 17%
• Convert steam and MTW to LTW
• MTW reduced to 180°F
3 • Reduces distribution losses 21% 44%
• Enables integration of low carbon heating
technologies
• Biomass boiler offsets fossil fuels at
heating plant
5 • Natural gas still used in satellite boilers 60% 92%
• NPV increase due to high price of
biomass
• GSHP
• Significant decrease in fossil fuel
emissions
• Increase in electric use from electric heat
7a 55% 85%
pumps
• Natural gas boilers used at heating plant
when heat pumps do not have adequate
capacity
• GSHP
• Increase in electric use from electric heat
pumps
7c 63% 92%
• Biomass boiler offsets fossil fuels at
heating plant, only used when heat
pumps do not have adequate capacity
• Same as 7a
8a 58% 85%
• 2.5 MW PV array
• Same as 7c
8c 66% 92%
• 2.5 MW PV array
While opinions and stances vary, the USEPA treats biogenic CO2 emissions from the combustion
of biomass from managed forests at stationary sources for energy production as carbon neutral 1. 0F
For purposes of developing this CEMP, CO2 emissions from burning biomass has been assumed to
be zero, while the associated carbon dioxide equivalent (CO2e) constituents of methane (CH4)
and nitrous oxide (N2O) have been included for estimating GHG emissions.
1 https://www.epa.gov/air-and-radiation/epas-treatment-biogenic-carbon-dioxide-emissions-stationary-sources-use-
forest#:~:text=On%20April%2023%2C%202018%2C%20EPA,energy%20production%20at%20stationary%20sources.
I:\Sucf.4261\70616.Energy-Roadmap\Docs\Reports\Clean Energy Master Plan\SUNY Oneonta CEMP_2021-04-14 Final.Docx 21Ramboll – SUNY Oneonta - Clean Energy Master Plan
Heat pumps with thermal storage will enable the use of renewable energy expected from the
utility grid (over time), or from Oneonta’s plans to enter into a large-scale solar power purchase
agreement (PPA) and/or install solar PV on campus. Heat pumps (as in Scenarios 7a, 7c, 8a, and
8c) are a good low carbon option. Whether biomass should be combined with heat pump
production (as in 7c and 8c) would need further consideration; this will depend on biomass price
and availability, as well as the perception of biomass as a low carbon fuel.
Production of district cooling was not part of the scope of the assessment. District cooling can
contribute to savings as well as allow additional flexibility (e.g., further increase energy
efficiency, require fewer chillers). The additional costs of adding a cooling network when a
heating network is already being installed is much less than for a stand-alone cooling network. If
heat pumps (additional GSHP or possibly air-source heat pumps) are introduced as part of the
low carbon technologies, they will also be able to produce cooling.
When the heat pump/chiller produces hot water and chilled water simultaneously, the combined
coefficient of performance (COP) 2 will be approximately 6 to 7 instead of approximately 3.5 when
1F
producing hot water alone or 5 when producing chilled water alone. Furthermore, district cooling
with thermal storage can reduce costs due to:
• Reduced need for cooling production capacity due to demand diversity and thermal storage to
reduce cooling peaks.
• Reduced operation and maintenance cost (fewer, centralized chillers).
• Reduced or eliminate need for cooling towers (heat is utilized).
• Reduced capital expenditures for chillers (economies of scale and lower capacity).
The 2.5 MW solar PV array would require approximately 10 to 15 acres of space, which is
available on the Collins property, and would be expected to produce approximately 3,300 MWh
per year; about 14% of the approximately 23,750 MWh total annual campus electric energy use.
With the NYS utility grid expected to be carbon neutral within 20 years, the value of the on-site
PV option would be diminished over time in terms of GHG goals. The reduction in emissions from
installation of solar PV will be approximately 379 metric tons per year in year 1 and 221 metric
tons per year in year 10, with no reduction in year 20. However, the behind the meter PV system
would reduce energy costs by reducing distribution costs.
3.4 Potential Low Carbon Heating Strategy
Figure 18 is a load duration curve showing the hourly estimated heating load for the main
campus central heating system after ECMs are implemented in the buildings. The shaded areas
under the curve represent the amount of heat provided by each supply asset. Note this is a
potential heating strategy with ground source heat pump systems that was not part of the base
energy scenario evaluation, but it provides a conceptual illustration of the potential extent of
GSHP that might be practical at SUNY Oneonta. The GSHP well numbers correspond to entries in
Table 9.
2 The coefficient of performance for a heat pump is heat output divided by the electric energy input to drive the heat pump compressors (heat of
rejection divided by work of compression; unitless)
I:\Sucf.4261\70616.Energy-Roadmap\Docs\Reports\Clean Energy Master Plan\SUNY Oneonta CEMP_2021-04-14 Final.Docx 22You can also read


