Clinical Trials in Australian Public Health Institutions 2018-19 (NAS 4 report) - Framework for National Aggregate Statistics (NAS) - Fourth ...
←
→
Page content transcription
If your browser does not render page correctly, please read the page content below

Clinical Trials in Australian
Public Health Institutions
2018-19 (NAS 4 report)
Framework for National Aggregate Statistics (NAS) -
Fourth Activity Report
Clinical Trials Project Reference Group (CTPRG)
Copyright

© 2020 Clinical Trials Project Reference Group
This work is copyright. You may copy, print, download, display and reproduce the whole or part of
this work in unaltered form for your own personal use or, if you are part of an organisation, for
internal use within your organisation, but only if you or your organisation:
(a) do not use the copy or reproduction for any commercial purpose; and
(b) retain this copyright notice and all disclaimer notices as part of that copy or reproduction.
Apart from rights as permitted by the Copyright Act 1968 (Cth) or allowed by this copyright notice,
all other rights are reserved, including (but not limited to) all commercial rights.
Requests and inquiries concerning reproduction and other rights to use are to be sent to the
Secretariat of the Clinical Trials Project Reference Group for the attention of the Communication and
Change Branch, Commonwealth Department of Health, GPO Box 9848, Canberra ACT 2601, or via e-
mail to corporatecomms@health.gov.au.

Disclaimers

Whilst every effort was made to ensure that the information in this publication is correct at the time
of publication, it may not be accurate or complete due to the quality of data used. Further, the
information may be superseded where the future quality of the data is improved.
To the extent permitted by law, the members of the Clinical Trials Project Reference Group do not
accept any liability or responsibility for any injury, loss or damage suffered by any person arising
from that person’s use or reliance on the content of this publication.

Clinical Trials Project Reference Group                                            P a g e 2 | 25

CONTENTS
Acronyms ................................................................................................................................................ 4
Executive Summary................................................................................................................................. 5
Introduction ............................................................................................................................................ 7
   Background ......................................................................................................................................... 7
   NMA Scheme ...................................................................................................................................... 8
   NAS Framework .................................................................................................................................. 8
   NAS Metrics......................................................................................................................................... 9
   Scope ................................................................................................................................................... 9
Metrics Report ...................................................................................................................................... 10
   Metric 1: Number of New Trials per Trial Phase............................................................................... 10
       1a: Number of New Trials per Sponsor Type ................................................................................ 11
   Metric 2: Overall Study Start Up – ‘Without Clock’ .......................................................................... 12
   Metric 3: Ethics and SSA/Site Assessment Timeline – ‘With Clock’ .................................................. 13
   Metric 4: Ethics Approval Timeline ................................................................................................... 14
       4a HREC Approval Timeline – ‘Without Clock’ .............................................................................. 14
       4b HREC Approval Timeline – ‘With Clock’ ................................................................................... 14
   Metric 5: SSA/Site Assessment Timeline ‘Without Clock’................................................................. 15
       5a SSA/Site Assessment Timeline – from HREC Approval Date ‘Without Clock’ .......................... 15
       5b SSA/Site Assessment Timeline – from SSA Validation Date ‘Without Clock’ ........................... 16
Explanatory Notes ................................................................................................................................. 18
   A1. Glossary ...................................................................................................................................... 18
   A2. NAS Metric Definition ................................................................................................................. 21
       National clinical trial activity ......................................................................................................... 21
       Regulatory Timelines – total ......................................................................................................... 21
       Regulator Timelines – components .............................................................................................. 21
       Recruitment/Investment .............................................................................................................. 22
   A3. NAS Reporting............................................................................................................................. 22
   A4. NAS Data Collection Methodology ............................................................................................. 23
       Data Sources ................................................................................................................................. 23
       Data aggregation process ............................................................................................................. 24
       Limitations..................................................................................................................................... 24

Clinical Trials Project Reference Group                                                                                      P a g e 3 | 25
Acronyms
TERM          DESCRIPTION

ACSQHC        Australian Commission on Safety and Quality in Health Care

ANZCTR        Australian New Zealand Clinical Trials Registry

CRO           Commercial Research Organisation

CTA           Clinical Trial Approval Scheme

CTN           Clinical Trial Notification Scheme

CTPRG         Clinical Trials Project Reference Group

ERM           Ethics Review Manager

FTIH / FTIP   First time in human / First time in patient

GOVERNANCE    Clinical Trials Governance Framework
FRAMEWORK

HMR           Health and Medical Research

NHMRC         National Health and Medical Research Council

HREC          Health Research Ethics Committee

NAS           National Aggregate Statistics

NMA           National Mutual Acceptance

REGIS         Research Ethics and Governance Information System

RGS           Research Governance Service

SSA           Site Specific Assessment

TGA           Therapeutic Goods Administration

Clinical Trials Project Reference Group                                    P a g e 4 | 25
Executive Summary
Health and Medical Research (HMR) is the backbone of health system delivery and continuous
improvement, and clinical trials are a key part of the Australian HMR sector. All jurisdictions are
collaborating to improve the Australian clinical trials environment with a view to improving health
outcomes and increasing international investment in Australia.
In 2015, all Health Ministers agreed to a Framework for National Aggregate Statistics (NAS) and
annual collection of data by all jurisdictions through the Clinical Trials Project Reference Group
(CTPRG) to improve and inform approval timelines, operational objectives and strategic and targeted
promotion of Australia as a preferred global location for clinical trials.
This Fourth National Aggregate Statistics Report on Clinical Trials in Australia (NAS 4 Report) was
produced by Victoria on behalf of all jurisdictions, through CTPRG. As with previous reports, metrics
collection has utilised the underpinning framework of the National Mutual Acceptance (NMA)
Scheme. Each NAS Report has progressively built on preceding releases, and for the first time this
iteration includes data from all 8 jurisdictions. Consequently, as newly reporting jurisdictions have
contributed data, it has not been possible to continue time-series analysis. Work is continuing across
jurisdictions to address gaps in data.
The NAS 4 Report represents new clinical trials in 2018-19 in public health organisations from 8
jurisdictions. In total, 940 new clinical trials were reported in 2018-19, which is of a similar order to
previous years. Key findings indicate that in public health organisations in Australia 1:
      •     The majority of trials were multi-site, Phase 3 (37 per cent), and commercially sponsored (48
            per cent).
      •     The number of Phase 1 trials increased significantly since 2016-17 and there was a notable
            increase in the number of trials sponsored by the Investigator Initiated Group (130 in 2016-
            17 compared to 230 in 2018-19).
      •     Ten per cent of all trials took an average 38.8 days to complete the regulatory process within
            60 calendar days, ready to proceed to study start-up.
      •     There was a slight reduction in the number of clinical trials approved within the benchmark
            of 60 days, however the majority completed the process within 120 days.
      •     The administrative process for most SSA applications is complete within 60 days, however
            when measured from the date of ethics approval, only 40 per cent achieve this timeline. This
            suggests possible delays in submission of the SSA application, or failure to manage ethics
            and SSA approval processes concurrently.
While findings indicate a substantial clinical trial sector and strong improvements in ethics approval
processing times by administering bodies, priorities for further improvement have been identified:
      •     Metrics 4 provides a comparison of ethics approval time by the administering body only
            (Metric 4b – With Clock) and total time (Metric 4a – Without Clock). With clock, the
            proportion of ethics approval in 60 days is 73 per cent, compared to 41 per cent ‘Without
            Clock’. This highlights an area for improvement.
      •     Metrics 5 also provides an important comparison of timeliness of the SSA/Site assessment
            process 'Without Clock’. Most jurisdictions have a policy to commence the SSA/Site
            assessment concurrently with the ethics process, but the metrics suggest this is not
            occurring frequently. There could be several reasons for this difference.
Until new national benchmarks are agreed, the NAS metrics in this report are compared against
commonly used domestic or international benchmarks, where available.

1
    Noting that not all metrics include data from all jurisdictions during this transition phase.

Clinical Trials Project Reference Group                                                             P a g e 5 | 25
The benchmark often used by industry for time to recruit the first patient into a trial 2 is 12 weeks
(84 days). The NMA has a benchmark of 60 days for ethics approval ‘With Clock’ (Metric 4b).
Benchmarks for the time to process ethics applications in Europe and England is 60 days; 30 days in
the United States and Canada; and 145 days in China. In South Korea, there is a 30 working-day
benchmark for clinical trial protocol approval, and in New Zealand ethical review (including decision)
must be undertaken within 35 calendar days1. The degree to which these benchmarks are met
outside Australia is not within the scope of the current NAS Framework or reports.
The Explanatory Notes (see page 18) details NAS data sources and methodology (including
limitations), and should be read in conjunction with report findings.
2
NAS Metric 2 provides a proxy for this benchmark
Clinical Trials Project Reference Group P a g e 6 | 25Introduction Background Health and Medical Research (HMR) is the backbone of health system delivery and continuous improvement; and clinical trials are a key part of the Australian HMR sector, often seen as the gold standard in HMR evidence. They benefit patients, advance medical knowledge and for every dollar invested in clinician-driven clinical trials it is estimated $5.80 is returned in health benefit 3. Australia has traditionally been perceived as an attractive place to undertake safe and high quality trials. However, international competition is increasing, and delays in gaining approval and in recruiting patients are challenging Australia’s competitiveness. The Australian clinical trials policy landscape is complex, and no single government or agency holds all the levers for change. In response to these challenges, all jurisdictions are collaborating to improve the Australian clinical trials environment. Much of this work is being achieved through collaboration between Commonwealth and jurisdictional agencies, as health system managers of public hospitals in Australia, where the majority of clinical trials occur. Health Ministers agreed in 2016 to develop approaches to organise public health services to better support and streamline clinical trial processes in Australia. In response, jurisdictions - through the Clinical Trials Project Reference Group (CTPRG) - developed a set of Principles and Priority Action Areas to underpin redesign of jurisdictional clinical trial systems. Stimulus funding of $7 million nationally was made available under the Encouraging More Clinical Trials in Australia initiative to assist State and Territory governments to achieve system redesign in accordance with the Revitalised clinical trials agenda (Agenda) endorsed by all Health Ministers in March 2017. Among other things, this agenda seeks to; establish central points of contact to improve system navigation for sponsors and participants, streamline trial processes, decrease time to trial start-up, and improve capability. The National Clinical Trials Governance Framework is a key initiative of the Revitalised clinical trials agenda. It has been developed by the Australian Commission on Safety and Quality in Health Care on behalf of all jurisdictions to support the delivery and integration of high-quality clinical trials service provision into routine hospital care for improved patient outcomes. The National Clinical Trials Governance Framework is aligned with the National Safety and Quality Health Service (NSQHS) Standards. Once embedded, just as health service organisations need to meet requirements of the NSQHS Standards when they are accredited, the actions in the National Clinical Trials Governance Framework will also be mandatory for health service organisations and trial sites providing clinical trial services. Since its inception, CTPRG has identified the absence of, and critical need for, national data across a set of key strategic and operational objectives to drive quality improvement within the sector and position Australia as a preferred location for trials. A Framework for National Aggregate Statistics (NAS) and annual collection of data to facilitate this quality improvement approach and inform strategic and operational objectives has been approved by Health Ministers and is intended to complement other current sources of national data on clinical trial activity in Australia, including the Australian New Zealand Clinical Trial Registry (ANZCTR) and the Therapeutic Goods Administration’s (TGA’s) Clinical Trial Notification Scheme (CTN) scheme. 3 http://www.clinicaltrialsalliance.org.au/wp-content/uploads/2018/08/Economic-evaluation-of-investigator-initiated-clinical-trials- conducted-by-networks.pdf Clinical Trials Project Reference Group P a g e 7 | 25
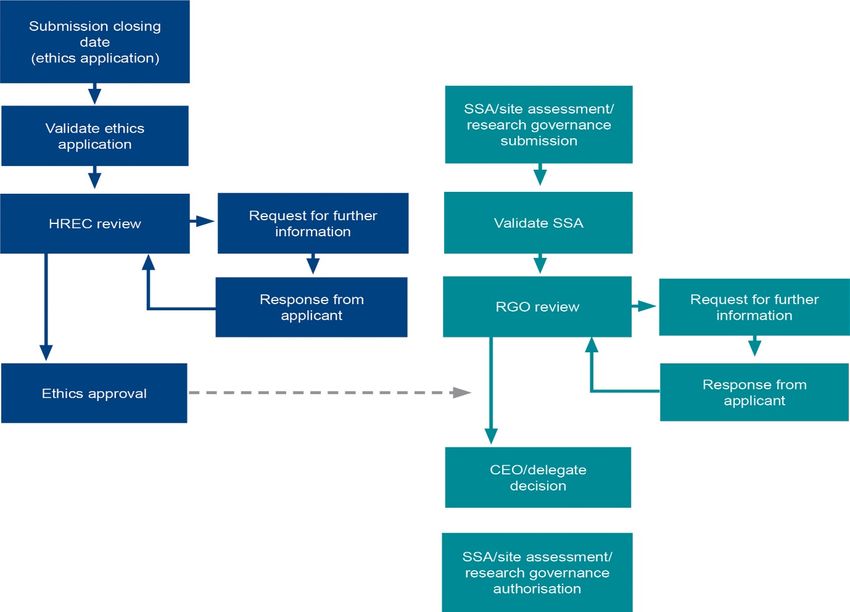
NMA Scheme
The National Mutual Acceptance (NMA) scheme supports the acceptance of a single scientific and
ethical review for multi-centre research conducted in publicly-funded health services. As at
September 2020, all states and territories, with the exception of the Northern Territory and
Tasmania, participate in the NMA scheme however all jurisdictions are members since early 2021.
NMA involves linking cross-jurisdictional applications so each jurisdiction hosting a trial site has a
record of ethical review in another jurisdiction. NMA also established the collation and reporting
against objectives for metrics on cross-jurisdictional clinical trials in Australia and this in-part
provided the framework for the reporting of cross-jurisdictional clinical trials within NAS.
Diagram 1 illustrates processes in the NAS Framework which occur with separate administration but
in a parallel timeframe. The end point of the approval process is authorisation of SSA/Site
assessment at the trial site and this can then trigger the initiation of a trial at that site. There are also
requirements to register trials and where applicable, notify TGA of trial conduct prior to
commencement.
Diagram 1: Clinical Trial Regulatory Processes: Ethics and SSA/Site Assessment

NAS Framework
The NAS Framework, as endorsed by all Health Ministers, comprises the eight metrics agreed by all
jurisdictions as essential to evaluate the success of clinical trials improvement initiatives, and to
promote Australia as a preferred global destination. These include metrics to measure clinical trial
activity, timelines for trial start-up measured by mandatory approval processes for clinical trials to
be conducted in Australia, and associated recruitment and investment levels.

Clinical Trials Project Reference Group                                                P a g e 8 | 25
NAS Metrics
National Clinical Trial Activity
         Metric 1:           Number of New Trials per Trial Phase (by trial type ‘medicine’ only)
         Metric 1a:          Number of New Clinical Trials per Sponsor Type
Regulatory Timelines - total
         Metric 2:           Overall Study Start-Up Timeline (Regulatory Timeline) – Without Clock
         Metric 3:           Ethics and SSA/Site Assessment Approval Timeline – With Clock
Regulatory Timelines - components
         Metric 4:           Ethics Approval Timeline (4a) Without Clock (4b) With Clock
         Metric 5:           SSA/Site Authorisation Timeline - Without Clock
         (5a)      From HREC Approval Date
         (5b) from Validation Date
Recruitment/Investment
         Metric 6:           Trial Recruitment Actual/Planned
         Metric 7:           Site Recruitment: Actual/Planned
       Metric 8:             Total Inbound (internal and external) Investment Annually (FY)
Actual/Planned

Scope
The current scope of the NAS Framework – and this NAS report – are all clinical trials conducted in
public health organisations in Australia. This includes trials managed by universities that involve
clinical treatment within public health organisations 4. Some trials reported in NAS may include trial
sites at some private health organisations and universities that accept ethical review but these are
not reported in the SSA/Site assessment data due to lack of information capture. Clinical trials
conducted in a primary care setting are unlikely to be represented in this report, unless the trial is
connected to a public health institution’s information management platform.
Within the public health system, the NAS captures all trial types, including trials that are funded by
commercial organisations such as pharmaceutical or device companies and non-commercial,
including Investigator Initiated, Collaborative Group, Institution and other clinical trials. NAS also
captures both multi and single-site studies where information is available.
Data reporting capability is improving in jurisdictions, and as more data becomes available it will lead
to more comprehensive data analysis for Australian clinical trials in public health organisations.

4 As researchers will either have both clinical and university appointments or are required to seek ethics review through
the public health institution.

Clinical Trials Project Reference Group                                                            P a g e 9 | 25
Metrics Report
Metric 1: Number of New Trials per Trial Phase
For the annual period 1 July 2018 – 30 June 2019 there were 940 new clinical trials reported from all
jurisdictions, which is of a similar order to previous years. Of these, trial phase was reported for
5
452. The low response is largely because some jurisdictions do not report or have incomplete
reporting of trial phase.
Figure 1: Number of Clinical Trials (medicines) by Trial Phase
Number or Trials by Trial Phase
40%
35%
30%
25%
Per cent
20%
15%
10%
5%
0%
FTIH / FTIP Phase 1 Phase 2 Phase 3 Phase 4
FTIH / FTIP Phase 1 Phase 2 Phase 3 Phase 4
As shown below (see Table 1), Phase 3 trials were the majority (37 per cent), followed by Phase 2
trials (28 per cent). This represented an increase in the total number of Phase 3 trials compared to
2016-17 (46 per cent of a total of 375 trials). There was a slight increase in the number of Phase 2
trials compared to 2016-17 (127 compared to 105), while the relative proportion compared to all
trials remained static.
The number of Phase 1 trials reported by phase increased in 2018-19 with the number compared to
2016-17 almost doubling (93 compared to 47). There was also an increase in Phase 1 trials as a
proportion of all trials reporting trial phase over the period.
There was a significant increase in the number of Phase 4 trials compared to 2016-17. The
percentage for first time in human/in patient trials has remained relatively constant.
5 Refer to the Glossary and Definitions for an explanation of trial phase.
Clinical Trials Project Reference Group P a g e 10 | 25Table 1: Number of Clinical Trials (medicines) by Trial Phase
Trial phase 2018-19
No. Per cent
FTIH / FTIP 13 3%
Phase 1 93 21%
Phase 2 127 28%
Phase 3 165 37%
Phase 4 54 12%
Total 452 100%
Note: ‘Clinical Trials Phase’ is not reported in Tasmania; for individual trials; or may be ‘not applicable’ (e.g. device trial).
There is no data recorded for device trial stages, but overall 90 device trials received ethics approval
in 2018-2019 (10 per cent of total trials). The majority of clinical trials were multi-site trials and 506
occurred across and within jurisdictions in 2018-19.
1a: Number of New Trials per Sponsor Type
Commercially sponsored clinical trials represent 48 per cent of all trials reported by sponsor type in
Australia in 2018-19. Investigator centred trials combined (collaborative groups, investigators and
institutions) represent 45 per cent of trials.
Table 2: Number of Clinical Trials by Sponsor Type
Sponsor Type 2018-19
No. Per cent
Collaborative Group 37 5%
Commercially Sponsored 388 48%
Institution 98 12%
Investigator Initiated Group 230 28%
Other 28 3%
University 33 4%
Total 814 100%
Note: Jurisdictions represented are: Australian Capital Territory, New South Wales, Northern Territory, Queensland, South
Australia, Victoria and Western Australia. There were 126 trials reported where the type of sponsor was not stated.
There was an increase in total trials sponsored by the Investigator Initiated Group compared to
2016-17. ‘Other’ sponsor type has been separated into ‘Other’ and ‘University’ categories in this
report.
Clinical Trials Project Reference Group P a g e 11 | 25Metric 2: Overall Study Start Up – ‘Without Clock’
Measuring the overall study start up is an important metric for commercial sponsors in determining
location of clinical trials globally. Sponsors have emphasised clinical trial site selection globally
depends on timelines, for the regulatory approval, site authorisation, study start up and first patient
recruited. This metric gives a real indication of the time from submission of ethics application to
possible site initiation and progression to trial commencement.
‘Time to first patient recruited’ is the most widely accepted international indicator for efficiency of
trial start-up. Mechanisms to collect this data for Australia are actively being progressed but are not
currently available. As an interim, Metric 2 provides a proxy for study start up timeline by measuring
the timeline for the two mandatory approval/regulatory processes for clinical trials in Australia: from
ethics application submission closing date to date of first SSA/Site authorisation, noting that these
processes should be completed concurrently but some jurisdictions may be an exception.
Over the reporting period, there were 460 clinical trials reported for this measure. The period
commences at ethics submission and the date for the first SSA/Site assessment authorisation is the
endpoint. Ten per cent of clinical trials completed the regulatory process in 60 calendar days or less,
and a total of 44 per cent (2018-19) of trial applications were processed within 120 days. The
remainder of trials take 120 days or more (over 180 days) to reach the end point of the regulatory
process. Reduction in this metric time relating to SSA/Site assessment will depend on initiatives to
improve adherence to jurisdiction’s policy at health services.
Figure 2: Overall estimated Trial Study Start-Up
Note: Jurisdictions represented are: New South Wales, Northern Territory, Queensland, South Australia, Victoria and
Western Australia. Some clinical trials did not meet the criteria for this metric as they were approved but an SSA was not
yet authorised. No SSAs were processed in Tasmania and Australian Capital Territory.
Estimated study start-up mean and standard error has been calculated across four time intervals
ranging from 0-60 days up to 180+ days.
Ten per cent of trials took, on average, 38.8±2.8 days to complete study start-up within 60-calendar
days. Overall, the cohort averaged 159.0±5.0 days to complete study start-up, similar to 2016-17.
Table 3: Overall mean estimated Trial Study Start-Up
Year Calendar Days Total
0-60 61-120 121-180 180+
2018-19 38.8 ± 2.8 91.4 ± 1.3 146.5 ± 1.6 282.2 ± 9.1 159.0 ± 5.0
(n=46) (n=156) (n=142) (n=142) (n=460)
Clinical Trials Project Reference Group P a g e 12 | 25The mean and standard error for each time period is shown and the number of trials is in brackets.
Metric 3: Ethics and SSA/Site Assessment Timeline – ‘With Clock’
The ‘With Clock’ Ethics and SSA assessment timeline is a measure of the administration time for the
two concurrent regulatory processes. The Clock is started on the submission closing date, stopped
on the date of the first site authorisation and then deducts any time intervals between request and
receipt of further information from investigator/trial coordinator, sponsor/CRO. This measures the
administrating organisations’ timeliness for the ethics and SSA process.
The majority of trials complete the process for ethics review and site assessment ‘with clock’ within
60 or 120 days, in contrast to Metric 2 (above) which does not use a clock to distinguish time use. In
2018-19, there was a decline in proportion of trials completing the two processes within 60 days
compared to 2016-17 (approximately 25 per cent in 2018-19 compared to 30 per cent in 2017-18).
Figure 3: Ethics and SSA/Site Assessment timeline (With Clock)
#Note: Jurisdictions represented are: New South Wales, Northern Territory, Queensland, South Australia, Victoria and
Western Australia. Some clinical trials did not meet the criteria for this metric as they were either approved but an SSA was
not yet authorised. No SSAs were processed in Tasmania and Australian Capital Territory.
With no clock the timelines is 159.0±5.0 and with clock it takes 130.0±4.8 days. Approximately 29
added days are due to delays responding to administrators, an improvement on the NAS 3 Report
estimate (time-series analysis over 3 years) of 50 days added due to delays in response.
Table 4: Ethics and SSA/Site Assessment mean timeline (With Clock)
Calendar Days
Year Total
0-60 61-120 121-180 180+
36.2 ± 1.5 89.0 ± 1.4 150.7 ± 2.1 275.4 ± 9.8 130.0 ± 4.8
2018/19
(n=109) (n=150) (n=82) (n=101) (n=442)
The mean and standard error for each time period is shown and the number of trials is in brackets.
Administration of the ethics/HREC and authorisation of the first SSA/Site assessment were
completed within 60 days for 36 per cent (decrease from 39.2 ± 1.1 in 2016-17) of trial applications
and within 61-120 days for 89 per cent (an increase from 86.9 ± 1.3 in 2016-17) in 2018-19.
Clinical Trials Project Reference Group P a g e 13 | 25Metric 4: Ethics Approval Timeline
4a HREC Approval Timeline – ‘Without Clock’
The HREC approval timeline ‘Without Clock’/no clock measures time in days from Cut-off
Date/Submission Closing Date to the Approval Clock Stop Date 'Without clock’ operating. This
measure is for the full period for ethics review without time interval deductions.
With no clock operating the majority of ethics applications are approved within 121 days.
Ethics reviews ‘Without Clock’ were completed within a 60 day period in 41 per cent of trial
applications. Sixty days is a commonly used benchmark for the ethics process in Australia and a
number of other countries.
Figure 4: Ethics timeline (Without Clock)
#Note: All
Jurisdictions are represented. Some clinical trials did not meet the criteria for this metric as they were approved
but an SSA was not yet authorised. No SSAs were processed in Tasmania and Australian Capital Territory.
Within 60 days the mean time for ethics approval was 37.8±1.0 days. Overall, the actual mean time
for ethics approval for all trials was 88.3±3.1 days, which is an increase from 77.7± 2.2 in 2016-17.
Table 5: Ethics mean timeline (Without Clock)
Calendar Days
Year Total
0-60 61-120 121-180 180+
37.8 ± 1.0 84.3 ± 1.0 145.2 ± 1.9 313.8 ± 22.5 88.3 ± 3.1
2018/19
(n=288) (n=294) (n=78) (n=50) (n=710)
The mean and standard error for each time period is shown and the number of trials is in brackets.
4b HREC Approval Timeline – ‘With Clock’
Time in days from Cut-off Date/Submission Closing Date to the Approval Clock Stop Date.
‘With Clock’ allows measurement of the time intervals between request and receipt of further
information from investigator/trial coordinator, sponsor/CRO and this interval is deducted from the
overall time period. This measures the administrating organisations’ timeliness for the ethics
process.
Clinical Trials Project Reference Group P a g e 14 | 25Seventy three per cent (94 per cent in 2016-17) of ethics applications were reviewed and approved
within a 60 day benchmark, with operation of an administrative clock. This is a high level of
performance when complexity of clinical trials is considered. The variation in result compared to
previous years is due to the increase in contributors to the data.
Figure 5: Ethics timeline (With Clock)
#Note: All states and territories are represented. Of the applications meeting the criteria, some clinical trials were
eliminated because a ‘with clock’ function was not available and administrative time could not be calculated.
The mean time for ethics review within 60 days was 31.6±0.7 days (2018-2019) and indicates timely
ethics review and administration. For the total number of trials there was a mean of 56.3±2.6 days
for the ethics review process. A small number of trials had considerably longer review times and
these outliers were likely due to specific circumstances and un-associated with the usual review
process. The total number of trials mean of 56.3±2.6 in 2018-19 has increased in comparison with
2016-17 data (31.2 ± 1.2), due to increased number and contributors to the data.
Table 6: Ethics mean timeline (With Clock)
Calendar Days
Year Total
0-60 61-120 121-180 180+
31.6 ± 0.7 86.4 ± 1.6 146.0 ± 3.2 329.2 ± 40.6 56.3 ± 2.6
2018/19
(n=487) (n=127) (n=31) (n=20) (n=665)
The mean and standard error for each time period is shown and the number of trials is in brackets.
Metric 5: SSA/Site Assessment Timeline ‘Without Clock’
Improvement in SSA/Site assessment is necessary to position Australian clinical trials to be globally
competitive. It is important to note that Metric 5 measures time for authorisation of all trial sites,
compared to Metric 2 and 3 that measure time to authorisation of the first site only. There is
inconsistent use of the stop and re-start clock function across jurisdictions and site. For that reason a
‘With Clock’ for SSA/Site Assessment timeline has not been included in this report.
5a SSA/Site Assessment Timeline – from HREC Approval Date ‘Without Clock’
Metric 5a measures the time from Date of ethics approval to Authorisation Clock Stop Date,
'Without clock’ operating.
Clinical Trials Project Reference Group P a g e 15 | 25Metric 5a indicates that approximately 40 per cent of SSAs were authorised within 60 days of ethics
approval. This suggests that the investigator/trial coordinator may be delayed in preparing the SSA
documentation. However, this result is a significant improvement compared to 2016-17 data, which
indicated only 26 per cent of SSAs were authorised within 60 days of ethics approval at that time. A
proportion of long periods (180+days) may occur when additional trial sites are added later or due to
other complexities associated with trials.
Figure 6: SSA/Site Assessment timeline – from Ethics Approval Date (Without Clock)
Note: Jurisdictions represented are: New South Wales, Northern Territory, Queensland, South Australia, Western
Australia, and Victoria. The ethics application must be approved before an SSA/Site assessment can be
authorised/completed.
Note that in Metric 2 (without clock) 10 per cent of trials fell within a 60 day completion timeline
and for SSAs only (Metric 5a) 40 per cent of trial site SSAs were authorised within 60 days. However,
Metric 2 uses the first authorised SSA only and 38.8 ± 2.8 days was the average in the 60 day time
period. In Metric 5a all SSA/Site Assessment times were measured and authorisation was 27.9±1.2
days in the 60 day time period. This metric does not have the ethics approval time included.
SSAs/Site assessments in the case of multi-centre trials may have longer timelines and could be an
area of focus for performance improvement at trial sites.
Table 7: SSA/Site Assessment mean timeline – from Ethics Approval Date (Without Clock)
Calendar Days
Year Total
0-60 61-120 121-180 180+
27.9 ± 1.2 91.0 ± 1.4 148.1 ± 1.6 294.8 ± 10.2 118.3 ± 4.4
2018/19
(n=276) (n=158) (n=112) (n=147) (n=693)
The mean and standard error for each time period is shown and the number of trials is in brackets.
5b SSA/Site Assessment Timeline – from SSA Validation Date ‘Without Clock’
Time from SSA validation Date to Authorisation Clock Stop Date, 'Without Clock’ operating.
There is no deduction of time intervals (clock stop and re-start) for the SSA/Site assessment process.
There is inconsistent use of the stop and re-start clock function across jurisdictions and sites and
therefore the clock was not used in the SSA process measure in this report. The action to validate an
SSA/Site assessment application has no designated ‘start’ date and an SSA/Site assessment
application may be submitted at any point in time. The process may involve a request for additional
documentation before review and sign-off by the authorising organisation.
Clinical Trials Project Reference Group P a g e 16 | 25Measuring the time to process an SSA/Site assessment application from validation indicates 92 per
cent of applications complete the process within 60 days. This is a measure of administrative time
only. In comparison, when measured from ethics approval date only 40 per cent of applications
completed authorisation within 60 days. This suggests submission of applications is significantly
delayed after the ethics approval date and/or the processes were not administered concurrently as
the ethics application must be approved before an SSA can be authorised/completed.
Using a measure from SSA validation date (Metric 5b), timely SSA processing by the research
governance office was evident.
Figure 7: SSA/Site Assessment timeline – from SSA Validation Date (Without Clock)
Note: Jurisdictions represented are: New South Wales, Northern Territory, Queensland, South Australia, Victoria and
Western Australia
The time taken to authorise an SSA/Site assessment once validated is less than 60 days in the
majority of cases with a mean time of 8.3±0.5 days (2018-19).
These times indicate that the site assessment process is short but as Metric 5a shows, large variation
and time delays occur when the date of ethics approval is the start point whereas Metric 5b
measures administrative time once the SSA application is validated. This indicates that there is a
large delay because these two processes (ethics and SSA) are not occurring concurrently. This is
reflected in Metric 2 where the two process times are measured together.
Table 8: SSA/Site Assessment mean timeline – from SSA Validation Date to SSA Authorisation Date
(Without Clock).
Calendar Days
Year Total
0-60 61-120 121-180 180+
8.3 ± 0.5 89.1 ± 2.7 144.5 ± 5.0 247.4 ± 25.7 17.9 ± 1.5
2018/19
(n=643) (n=35) (n=13) (n=9) (n=700)
The mean and standard error for each time period is shown and the number of trials is in brackets.
Clinical Trials Project Reference Group P a g e 17 | 25Explanatory Notes
A1. Glossary
GLOSSARY TERMS DEFINITIONS
Administrative A number of NAS metrics include the concept of an ‘administrative clock’,
clock which allows distinction of responsibility for time between the administering
organisation and the investigator/trial coordinator/sponsor/CRO (see also ‘With
Clock’/’Without Clock’ below).
Authorisation date Authorisation decision date for a SSA/Site application given by the site
(SSA) organisation's CEO/delegate and recorded in the jurisdiction’s electronic
information platform, such as Ethics Review Manager (ERM).
Clinical trial Clinical trial ‘governance’ is the term used for institutional review or site-
governance specific assessment (SSA). From a broader perspective, ethics-approval form
parts of the overall governance framework that ensures the compliance,
accountability and transparency of research activity at a site.
Clinical trial Interventional research involving a drug/device trial, radiation therapy, surgery,
treatment or diagnostic procedure and studies associated with ongoing
activities relating to trials that have been conducted. This may include post-trial
activities such as observational research and evaluation of a trial, developing a
registry and other post-marketing surveillance activities.
Collaborative A ‘collaborative group’ is an academic and/or non-commercial collaborative
group research group responsible for sponsoring, initiating, managing, developing and
coordinating a research study.
Commercial trial Commercial trials are conducted by organisations that typically own or have a
financial interest in the intellectual property related to the intervention being
tested. Commercial organisations such as pharmaceutical companies or clinical
research organisations use the information obtained from the trial to support
the application to obtain licences or subsidies to sell their product.
First Time In First time an unapproved product is administered to a healthy human.
Human (FTIH)
First Time In First time an unapproved product is administered to a human with a medical
Patient (FTIP) condition.
Investigator - Investigator - initiated clinical trials are trials that are developed and conducted
initiated clinical by individual independent clinicians and/or academic researchers. The
trial Institution, through the Principal Investigator, is responsible for the initiation
and conduct of the Study at the Study Site(s) which is/are under the control of
the Institution.
Metrics Any type of measurement used to gauge some quantifiable component of an
entity’s performance.
Clinical Trials Project Reference Group P a g e 18 | 25GLOSSARY TERMS DEFINITIONS
National Mutual A single ethical review framework for multi-jurisdictional research projects. To
Acceptance (NMA) participate, jurisdictions are required to co-sign a Memorandum of
Understanding.
Phase 1 Phase 1 clinical trials involve the first administration of the medicine to humans,
usually to small numbers of healthy volunteers. Phase 1 clinical trials determine
the safety of the medicine, how it works and how well it is tolerated. These
clinical trials also identify preferred routes of administration (e.g. tablet, liquid
or injection) and help determine the appropriate doses for later studies.
Phase 1 clinical trials are usually undertaken in centres appropriately equipped
for the specialised monitoring and the high degree of surveillance needed.
Phase 2 Phase 2 clinical trials are normally the first trials of the medicine in patients
suffering from the condition for which the medicine is intended. The principal
aim of these clinical trials is to determine effectiveness and safety. These
clinical trials are undertaken in a small number of closely supervised patients
and conducted by researchers regarded as specialists in the particular disease
or condition and its treatment.
Phase 3 Phase 3 clinical trials involve greater numbers of patients and are undertaken
for the purpose of determining whether the medicine confers clinical benefit in
the disease/s for which effectiveness was demonstrated in Phase 2 clinical
trials. They also determine the nature and likelihood of any side effects. Phase 3
clinical trials are undertaken if the Phase 2 clinical trials indicate the medicine
has potential benefit that outweighs the hazards.
Phase 4 Phase 4 clinical trials are those clinical trials undertaken in Australia after the
medicine has been approved (either in, or external to Australia) for the
treatment of a particular disease. Phase 4 clinical trials may relate to a product
that is registered in another country at the time the trial is being conducted in
Australia.
Phase 4 trials may be a follow-on study from a previous trial and the rationale is
that the data from the trial is being used to support a post marketing study.
Phase 4 clinical trials are also undertaken to further investigate the use of the
medicine in the normal clinical setting of the disease, as this may differ quite
markedly from the conditions under which the other clinical trials were
conducted. This includes post marketing surveillance studies.
Public Health A statutory health corporation or affiliated health organisation in respect of its
Organisation/ recognised establishments and recognised services.
Institutions
Regulatory Refers to ethical review and approval of a human research project and SSA/Site
timeline assessment authorisation. These steps must comply with legislative
requirements, adherence to national guidance and other jurisdictional policy.
On completion the research may start at the study site.
Clinical Trials Project Reference Group P a g e 19 | 25GLOSSARY TERMS DEFINITIONS
Site Specific Refers to the Site Specific Assessment Form. The SSA Form is linked through
Assessment (SSA) coding to the trial HREC/ethics application form.
Sponsor An individual, company, institution, or organisation which takes responsibility
for the initiation, management, and/or financing of a clinical trial. In this report,
major sponsor type refers to either ‘Commercially sponsored’, ‘Collaborative
Group’, ‘Investigator Initiated/Institution’, or ‘Other’. In line with the Good
Clinical Practice guidelines, the sponsor type relates to the risk-owner, not the
provision of funding.
SSA/Site The process conducted by a research governance officer to assess the SSA form
assessment and documentation for authorisation by the chief executive or delegate for an
organisation to participate as a trial site.
‘Unapproved’ An ‘unapproved’ therapeutic good is one not included in the Australian Register
Therapeutic good of Therapeutic Goods.
With Clock Metrics provided ‘With Clock’ (such as Metric 3) are a measure of the time
taken for processing of the application by the administering body only. The
clock stops when the application leaves the administrator and is the
responsibility of the investigator, trial coordinator, sponsor or CRO to provide
further information about the application. The clock re-starts when a response
is received from the investigator/trial coordinator/sponsor/CRO.
Without Clock Metrics provided ‘Without clock’ are a measure of the total timeline – including
both the time taken to process the application by the administering body, and
the time to respond to queries by the investigator/trial
coordinator/sponsor/CRO.
Clinical Trials Project Reference Group P a g e 20 | 25A2. NAS Metric Definition
National clinical trial activity
Metric 1 provides the total number of new clinical trials, by trial phase. In addition, Metric 1a
provides the number of new clinical trials by major sponsor type (see Glossary above).
Regulatory Timelines – total
Sponsors have emphasised that clinical trial site selection globally depends on timelines, for both the
regulatory approval, site authorisation, study start up and first patient recruited. Time to first patient
recruited is the most widely accepted international indicator for efficiency of trial start-up.
While ‘time to first patient recruited’ is the long-term goal for inclusion in NAS, data is not currently
available to measure this in Australia. As an interim – Metric 2 provides a proxy for study start up
timeline by measuring the timeline for the two mandatory approval/regulatory processes for all
clinical trials in Australia: from ethics application submission closing date to date of first SSA/Site
authorisation, noting these processes are sometimes completed in parallel (see Diagram 1). SSA/Site
assessment occurs at each trial site where authorisation to conduct the trial must be provided.
It is important to note that as the NAS metric proxy is likely to be an under-estimate of the time to
first patient recruited (as it excludes the time from approval to patient recruitment), these
proportions are likely to be over-estimates.
Timelines for compliance with a regulatory body such as the Therapeutic Goods Administration are
not captured in the NAS metrics, as the date of Clinical Trial Notification (CTN) or Clinical Trial
Approval (CTA) is not considered an end point. Mechanisms to collect data on first patient recruited
are being considered and actively progressed.
Metric 3 also measures the timeline for the entire regulatory process (ethics + SSA/Site assessment),
however differs from Metric 2 as it introduces the use of an administrative clock.
Regulator Timelines – components
Metric 4 and Metric 5 each analyse timelines for one of the two components of the regulatory
process – ethics and SSA/Site assessment (see Diagram 1).
Metric 4 measures the time taken for ethics/HREC approval alone, both ‘Without Clock’ (Metric 4a),
and ‘With Clock’ (Metric 4b). This includes submission closing date, validation, HREC review, request
for further information, responses from applicants, and final ethics approval.
The ethics process is discrete and measured between submission of the ethics application to
approval. A common benchmark for process of ethics applications is 60 days.
Metric 5 measures the time take for SSA/Site assessment alone. This includes submission, validation,
Research Governance Officer (RGO) review, request for further information, responses from
applicants, CEO/delegation decision, and SSA/Site assessment/research governance authorisation.
The metric measures the total timeline (i.e. ‘Without Clock’ only), as there is no prescribed
submission date for SSA processes, and therefore no defined start point. A SSA application can be
submitted at any time before or after the ethics submission closing date and submission is
dependent on the readiness to provide relevant documentation by the sponsor /CRO. In addition,
6
6
A sponsor may be an institution, investigator or a commercial industry company which has overall responsibility for the trial
Clinical Trials Project Reference Group P a g e 21 | 25research governance officers do not uniformly stop and re-set the clock in processing SSA
applications.
Given the lack of a prescribed submission date/formal start date, the following two process steps are
used as proxy starting points for NAS analysis:
Metric 5a. The ethics/HREC approval (date) is a critical requirement before SSA/Site assessment
can be finally authorised by the organisation that will conduct the trial. It also allows continuity of
the overall regulatory timeline in that the SSA assessment should be occurring in parallel and be
completed as soon after ethics/HREC approval as possible.
Metric 5b. SSA validation date is the first date that may appear in electronic information systems
for SSA applications. This is not related to the ethics/HREC process. Validation date can be an
extremely variable decision-making step i.e. a SSA application may be complete or incomplete
with additional documents to be submitted at a later date but the SSA form can be considered
valid.
Recruitment/Investment
The CTPRG identified capacity to track changes in trial recruitment and investment as important
metrics in measuring improvements in Australia’s competitiveness as a preferred destination for
clinical trials, and therefore included the following three metrics in the NAS Framework:
Metric 6: Trial Recruitment Actual/Planned
Metric 7: Site Recruitment: Actual/Planned
Metric 8: Total investment annually (FY) Actual/Planned
These metrics have not been provided to date through annual NAS reporting, due to the lack of
reliable and accessible data at jurisdiction level. However, CTPRG members have committed to
provision of these metrics through the Encouraging More Clinical Trials in Australia Budget Measure
(see above), which in turn will be enabled for a number of jurisdictions through upgrades to
electronic information platforms.
A3. NAS Reporting
As identified above, annual NAS reporting is a key deliverable of the CTPRG. Development of annual
reports, data definitions, data collection templates and analysis has been led by Victoria, in
collaboration with contributing jurisdictions, and as agreed by CTPRG.
In May 2016, AHMAC endorsed the First National Activity Report on Commercially Sponsored Clinical
Trials in Australian Public Health Organisations (NAS 1 Report). It provided data on total clinical trial
activity, and timelines for ethics and SSA/Site assessment (NAS Metrics 1 – 5) for all commercially
7
sponsored clinical trials in public health organisations, in six jurisdictions for the year 2014-15. The
NAS 1 Report represented the first attempt to measure national clinical trial activity, an important
step in understanding Australia’s performance in the clinical trials sector, and reflected the
committed cooperation of all jurisdictions. As the NAS 1 Report reflected a new process and data
collection methodology, it was not intended for publication. In the current NAS 3 Report, the 2014-
15 result reflect all clinical trials (including non-commercial).
7
Australian Capital Territory, New South Wales, Northern Territory, Queensland, South Australia and Victoria
Clinical Trials Project Reference Group P a g e 22 | 25The Second National Aggregate Statistics Report on Clinical Trials in Australia (NAS 2 Report) was
approved for publication by AHMAC, and published in June 2017. It included data from five
8
jurisdictions for the year 2015-16. Like the NAS 1 Report, the NAS 2 Report included data for
clinical trials conducted in public health organisations, but was expanded to include trials from all
sponsor types (not just commercially sponsored trials). In addition to the metrics provided in the
NAS 1 Report (data on total clinical trial activity, and timelines for ethics and SSA/Site assessment
(NAS Metrics 1 – 5), the NAS 2 Report also disaggregated trials by sponsor type (NAS Metric 1a).
It is important to note that the published NAS 2 Report represented interim 2015-16 data, and
therefore may differ slightly from the final (revised) 2015-16 data presented in the Third National
Aggregate Statistics Report on Clinical Trials in Australia (NAS 3 Report). Interim NAS data is
produced immediately after a reporting period (FY), and therefore may miss timelines for the small
number of trials that commenced, but did not complete, the approval process in the reporting
period. Final NAS data is collated up to a year later, in order to also capture all timelines for those
trials. To minimise potential confusion from two data sets being circulated for the same reporting
period, only final data will be reported publically from NAS 3 onwards.
The NAS 3 Report was approved for publication by AHMAC in 2019. It included data for all clinical
trials in public health organisations from 6 jurisdictions, and represented final 2016-17 data. Like the
NAS 2 Report, it provided data on total clinical trial activity (including number and sponsor type), and
timelines for ethics and SSA/Site assessment. In addition, the NAS 3 report included, where
available, time-series analysis between NAS 1, NAS 2 and NAS 3 Reports. Time-series analysis was
not included in NAS 1 or NAS 2 Reports.
This current report, the Fourth National Aggregate Statistics Report on Clinical Trials in Australia
(NAS 4) uses only single year data and analysis due to complexities associated with data collections
as new systems have come online.
A4. NAS Data Collection Methodology
Data Sources
NAS is currently sourced from jurisdictional public health information platforms – both electronic
and manual. Based on an initial scan of available sources, these systems were identified and agreed
by CTPRG as the most current and reliable source of data for NAS.
The HREA ethics form system provides a national identifier for an ethics/HREC application, but due
to programming the HREA form into jurisdiction information management platforms this identifier is
not useful. Each jurisdiction system has a unique and different identification coding system.
There are four different information management platforms used by jurisdictions and institutions in
Australia to manage the ‘research governance’ of each individual research project. In general, these
platforms enable (to varying degrees) the three mandatory processes for human research
governance of clinical trials and other health research involving humans:
• ethics application, submission, review, and response/approval by a HREC;
• SSA application, submission, review, and response by an authorising site; and
• post approval monitoring and reporting.
8
New South Wales, Northern Territory, Queensland, South Australia and Victoria
Clinical Trials Project Reference Group P a g e 23 | 25The platforms are predominantly used (and therefore data input is provided) by
researchers/sponsors and reviewing/approving entities (such as HRECs and RGOs/sites). It is
important to note that these platforms do not contain participant data, or trial results.
Each jurisdiction sourced NAS data for this report from their own platform, the majority of which
were electronic and allowed measurement of the metrics with ‘administrative clock’, which as noted
elsewhere, provides capacity to measure timelines and also time intervals when applications are or
are not the responsibility of administering organisations.
Data aggregation process
Data contained in this report is based on a template developed by the NMA and expanded for state-
only records for the CTPRG and in accordance with agreed data definitions, sourced from
jurisdictional information platforms as noted above. The NMA framework operating between six
participating jurisdictions has provided the infrastructure for NAS data collection and analysis and
has been established since 2013. NMA involves linking cross-jurisdictional applications so each
jurisdiction hosting a trial site has a record of ethical review in another jurisdiction. Bringing together
NMA and state-only records in this report is an important step and has relied on cooperative
relations between jurisdictions.
Limitations
The data presented in this report has some limitations and these should be taken into account when
interpreting the information provided in this report, including:
• there are now five different information management platform that capture ethics and site
assessment/SSA application data. These are: New South Wales (REGIS), Queensland (ERM),
South Australia (AU RED), Victoria (ERM) and Western Australia (RGS). This has led to
difficulty in linking an SSA application to its ‘parent’ ethics approval in a different jurisdiction.
The result is Metrics 2 and 3 aggregate report numbers are low (460 and 442 respectively)
compared to the total 857 approved ethics applications. This has been termed an ‘orphan
SSA’ issue where the SSA cannot be linked to the ethics ‘parent’ application.
• an under-representation of clinical trials as some jurisdictions currently have limited capacity
to report in the NAS format due to lack of an information management platform, others
have an incomplete data set for single-site clinical trials and some jurisdictions do not
conduct an SSA process; and
• incomplete records (and therefore missing metrics) for some clinical trials included in this
report. Results therefore reflect the proportion of the trials reporting that particular data
element/NAS metric. These limitations particularly apply for analysis of metrics with low
response rates – for example, only 48 per cent of all trials reported a trial phase in 2018-
2019.
For successive reports jurisdictions will be actively working to report more comprehensively
regarding additional data and current gaps in some data sets.
Clinical Trials Project Reference Group P a g e 24 | 25You can also read