Company Presentation February 22, 2022 - Investors | Range Resources
←
→
Page content transcription
If your browser does not render page correctly, please read the page content below
Company Presentation February 22, 2022
Forward Looking Statements
All statements, except for statements of historical fact, made in this presentation regarding activities, events or developments the Company
expects, believes or anticipates will or may occur in the future are forward-looking statements within the meaning of Section 27A of the Securities
Act of 1933, as amended, and Section 21E of the Securities Exchange Act of 1934, as amended. These statements are based on assumptions
and estimates that management believes are reasonable based on currently available information; however, management's assumptions and
Range's future performance are subject to a wide range of business risks and uncertainties and there is no assurance that these goals and
projections can or will be met. Any number of factors could cause actual results to differ materially from those in the forward-looking statements.
Further information on risks and uncertainties is available in Range's filings with the Securities and Exchange Commission (SEC), including its
most recent Annual Report on Form 10-K. Unless required by law, Range undertakes no obligation to publicly update or revise any forward-
looking statements to reflect circumstances or events after the date they are made.

The SEC permits oil and gas companies, in filings made with the SEC, to disclose proved reserves, which are estimates that geological and
engineering data demonstrate with reasonable certainty to be recoverable in future years from known reservoirs under existing economic and
operating conditions as well as the option to disclose probable and possible reserves. Range has elected not to disclose its probable and
possible reserves in its filings with the SEC. Range uses certain broader terms such as "resource potential,” “unrisked resource potential,”
"unproved resource potential" or "upside" or other descriptions of volumes of resources potentially recoverable through additional drilling or
recovery techniques that may include probable and possible reserves as defined by the SEC's guidelines. Range has not attempted to distinguish
probable and possible reserves from these broader classifications. The SEC’s rules prohibit us from including in filings with the SEC these
broader classifications of reserves. These estimates are by their nature more speculative than estimates of proved, probable and possible
reserves and accordingly are subject to substantially greater risk of actually being realized. Unproved resource potential refers to Range's internal
estimates of hydrocarbon quantities that may be potentially discovered through exploratory drilling or recovered with additional drilling or recovery
techniques and have not been reviewed by independent engineers. Unproved resource potential does not constitute reserves within the meaning
of the Society of Petroleum Engineer's Petroleum Resource Management System and does not include proved reserves. Area wide unproven
resource potential has not been fully risked by Range's management. “EUR”, or estimated ultimate recovery, refers to our management’s
estimates of hydrocarbon quantities that may be recovered from a well completed as a producer in the area. These quantities may not necessarily
constitute or represent reserves within the meaning of the Society of Petroleum Engineer’s Petroleum Resource Management System or the
SEC’s oil and natural gas disclosure rules. Actual quantities that may be recovered from Range's interests could differ substantially. Factors
affecting ultimate recovery include the scope of Range's drilling program, which will be directly affected by the availability of capital, drilling and
production costs, commodity prices, availability of drilling services and equipment, drilling results, lease expirations, transportation constraints,
regulatory approvals, field spacing rules, recoveries of gas in place, length of horizontal laterals, actual drilling results, including geological and
mechanical factors affecting recovery rates and other factors. Estimates of resource potential may change significantly as development of our
resource plays provides additional data.

In addition, our production forecasts and expectations for future periods are dependent upon many assumptions, including estimates of production
decline rates from existing wells and the undertaking and outcome of future drilling activity, which may be affected by significant commodity price
declines or drilling cost increases. Investors are urged to consider closely the disclosure in our most recent Annual Report on Form 10-K, available
from our website at www.rangeresources.com or by written request to 100 Throckmorton Street, Suite 1200, Fort Worth, Texas 76102. You can
also obtain this Form 10-K on the SEC’s website at www.sec.gov or by calling the SEC at 1-800-SEC-0330.

                                                                                                                                                          2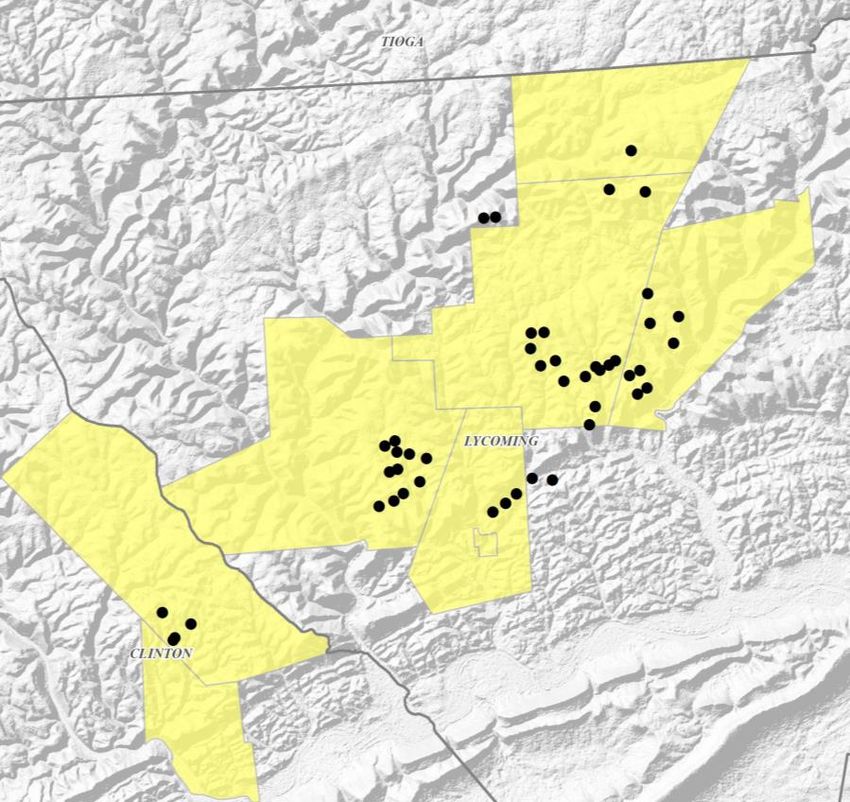
Range – Who We Are

                     •   Top 10 U.S. Producer of Natural
                         Gas & NGLs

                     •   Top NGL Exporter Among
                         Independent E&Ps

                     •   Pioneered Marcellus Shale in 2004
 Pennsylvania

                     •   Most Capital Efficient Operator in
                         Appalachia

                     •   Longest Core Inventory Life in
                         Appalachia

                     •   Upstream Leader in Environmental
                         Practices

                                                              3
Range – At a Glance
  Focus on Free Cash Flow
  ▪   Peer-leading well costs and base decline rate drive low sustaining capital requirements
  ▪   Competitive cost structure and marketing strategies support expanding cash margins
  ▪   Multi-decade core inventory life provides long runway of free cash flow generation
  ▪   Returning capital to shareholders via dividend and $500 million share repurchase program

  Unmatched Appalachian Inventory
  ▪   Approximately one-half million net acres provide decades of low-risk drilling inventory
  ▪   Contiguous position allows for efficient operations and long-lateral development
  ▪   Proved Reserves of 17.8 Tcfe at YE2021 – PV-10 of ~$40 per share, net of debt(a)

  Upstream Leader on Environmental Practices and Safety
  ▪   Targeting net zero GHG (Scope 1 & 2) emissions by 2025
  ▪   Reduced environmental impact and enhanced profitability through:
        ▪   Emissions monitoring and responsibly sourced natural gas (RSG) certification projects
        ▪   Water recycling and logistics
        ▪   Long-lateral development and innovative facility designs
        ▪   Electric-powered fracturing fleet
        ▪   Robust Leak Detection and Remediation (LDAR) program

Management Incentives Aligned to Support Free Cash Flow, Corporate Returns,
           Balance Sheet Strength & Environmental Leadership
                          (a) Assumes strip pricing as of 12/31/21. For reference, at year-end 2021, 10-year NYMEX strip averaged $3.27/Mmbtu for
                          natural gas and $60.76/bbl for WTI.                                                                                       4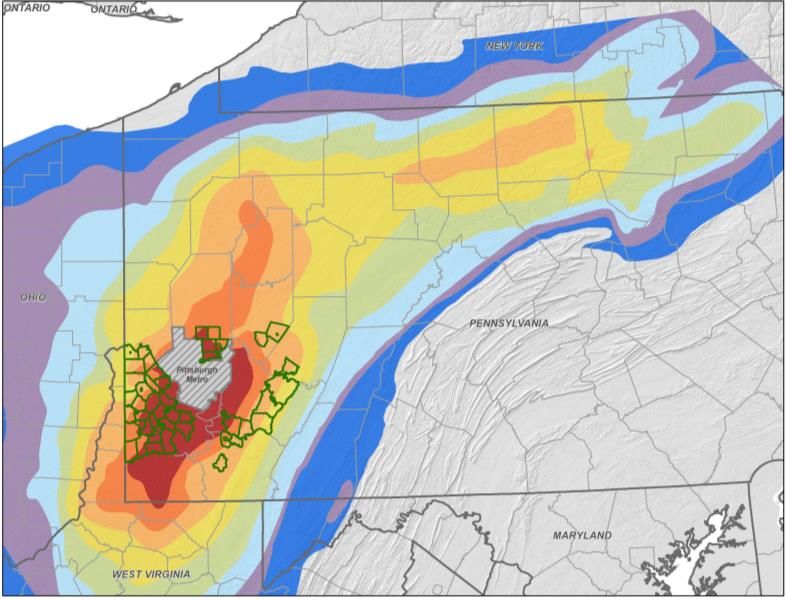
Delivering on Strategic Objectives
✓ Most Capital Efficient Operator in Appalachia(a)
    •   2019-2021 Capital Expenditures per Mcfe of ~$0.64 versus peer average of ~$0.96 per Mcfe
    •   Delivered on operational plans while spending under budget for four consecutive years

✓ Enhanced Margins Through Cost Improvements & Marketing Strategies
    •   2021 cash margins were highest since 2015, with further margin expansion expected in 2022
    •   2021 pre-hedge realizations were over $0.25 per Mcfe above NYMEX natural gas, with even
        greater premium expected in 2022 at strip pricing, driven by Range’s liquids price uplift
    •   2023 interest expense forecast to be approximately half of 2021 total, resulting in annual savings
        of ~$100 million

✓ Strengthened Balance Sheet & Maturity Profiles
    •   Reduced absolute debt for four consecutive years
    •   In January 2022, issued $500 million of 4.75% senior notes due 2030, with proceeds used in
        February to redeem $850 million of 9.25% senior notes due 2026
    •   Approximately $750 million senior notes due by end of 2023 could be retired via expected free
        cash flow at strip pricing

✓ Successful Emissions Reduction & Water Recycling Programs
    •   Lowest emissions intensity within U.S. upstream sector
    •   Recycling over 100% of produced water through Range’s water recycling and sharing program
    •   Implemented new software that further improves safety, enhances efficiency, and reduces truck
        traffic and emissions

                         (a) Calculated as Capital Expenditures per Mcfe. See slide 7 for details.       5
2022 Outlook
All-In Capital Budget of $460 to $480 Million
▪   Production to be maintained at 2.12 to 2.16 Bcfe per day
▪   2022 activity sets up capital efficient 2023 development plan

Free Cash Flow to Drive Fifth Consecutive Year of Debt Reduction(a)
▪   Free cash flow forecast to exceed $1 billion in 2022
▪   Free cash flow margins expected to lead all Appalachia peers in 2022

Leverage Expected to Decline in 2022 and Beyond(a)
▪   Calculated leverage of ~1.0x at YE2022
▪   Leverage forecast to decline further in 2023 and beyond

Implement Framework to Return Capital to Shareholders
▪   Quarterly dividend of $0.08 per share to begin in 2H 2022, or a ~1.5% annual dividend yield(b)
▪   Authorized $500 million share repurchase program, representing ~10% of shares outstanding(b)

Maintain Strong Environmental & Safety Practices
▪   Continue to recycle all of Range’s produced water, in addition to third party water
▪   Targeting net zero direct GHG (Scope 1 & 2) emissions by 2025

                        (a) Assumes strip pricing as of 2/11/22 (b) Based on Range’s share price as of 2/18/22   6
Peer-Leading Capital Efficiency
     Well Costs per Lateral Foot                                                                                  Decline Rate
$1,200                                                                                         35%

$1,000                                                                                         30%

                                                                                               25%
 $800
                                                                                               20%
 $600
                                                                                               15%
 $400
                                                                                               10%
 $200                                                                                           5%

   $0                                                                                           0%
         RRC           Peer 1    Peer 4      Peer 2       Peer 3                                           RRC    Peer 1       Peer 4    Peer 2       Peer 3

                                           Capital Expenditures per Mcfe
               $1.60                                   2019        2020   2021           3-Year Average
               $1.40

               $1.20                                                                                      $1.08             $1.13

               $1.00
                                                       $0.79                     $0.83
               $0.80
                                $0.64
               $0.60

               $0.40

               $0.20

               $0.00
                                RRC                   Peer 1                Peer 2                    Peer 3               Peer 4

            Peer-Leading Development Costs & Decline Rate Drive
         Lowest Development Costs per Unit of Production in Appalachia
                                Note: Peers include AR, CNX, EQT and SWN. Peer estimates from company filings, presentations, transcripts, guidance and
                                Range estimates. SWN well costs represent Appalachia only.                                                                     7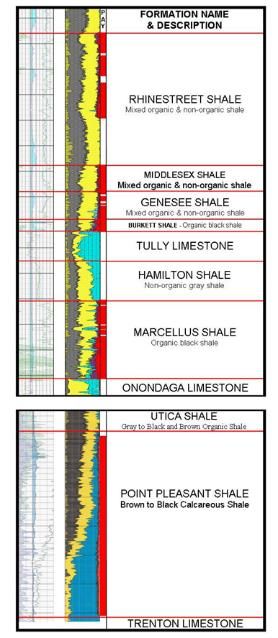
Peer-Leading Free Cash Flow Margins
                                                                                                       2022 Free Cash Flow per Mcfe(a)
Free Cash Flow per Mcfe Demonstrates Peer-
Leading All-In Margins                                                                      $1.40
▪   Low sustaining capital requirements increases free cash                                 $1.20
    flow available for other investments, including returns of
    capital to shareholders                                                                 $1.00
▪   Cost structure improvements have reduced break-even                                     $0.80
    price and expanded margins
                                                                                            $0.60
▪   Diversified marketing portfolio, with relatively low in-basin
    price exposure, results in strong price realizations                                    $0.40
▪   Liquids price uplift drives realizations that are above                                 $0.20
    NYMEX natural gas
                                                                                            $0.00
▪   Range’s patience to hedge 2022 prices provides greater
                                                                                                          RRC            Peer 1         Peer 2          Peer 3   Peer 4
    participation in strong commodity prices
                                                                                                2022 Capex Vs. Operating Cash Flow(a)
Capital Efficiency Drives Low Re-Investment Rate                                            80%
▪   Peer-leading well costs and decline rate result in the                                  70%
    lowest sustaining capital requirements in Appalachia
                                                                                            60%
▪   Range has the lowest re-investment rate among
    Appalachia peers, despite all peers targeting                                           50%
    maintenance capital programs in 2022                                                    40%
                                                                                            30%
    Range’s Peer-Leading, Multi-Decade Core                                                 20%
    Inventory Life Provides Long Runway to                                                  10%
           Generate Free Cash Flow                                                           0%
                                                                                                         RRC            Peer 1          Peer 2          Peer 3   Peer 4

                                 Note: Peers include AR, CNX, EQT and SWN. (a) Based on FactSet consensus estimates as of 2/18/22. Free cash flow defined as
                                 operating cash flow before changes in working capital, less capital expenditures.                                                   8
Well Cost Reductions Enhance Capital Efficiency
Efficiency Gains in Recent Years Drive Range’s Best-In-Class Well Costs(a)…
$750
Sustainable D&C Efficiency Gains
$700 • Extending average lateral length
All-In Well Costs per Lateral Foot
• Fuel savings from electric fracturing
$650
fleet
$600 • Utilizing recycled water from Range
and surrounding operators
$550
• Self-sourcing sand
$500 • Increasing feet drilled per rig day
• Frac efficiency (increasing stages per
$450
2019 Plan Efficiency Service 2020 Plan Efficiency Service 2021 Plan Efficiency Service 2022 Plan
day per crew)
Gains Costs Gains Costs Gains Costs • Reducing facilities costs
…And Resulted in Four Consecutive Years of Spending Below Budget
$1,000
Annual Capital Expenditures ($ million)
$900
Annual Capital Expenditures Reduced
2018: $31 million under budget $800 ~50% Since 2018, While Appalachia
Production Has Grown +10%
$700
2019: $28 million under budget $600
$500
2020: $109 million under original budget
$400
2021: $11 million under budget $300
$200
2018 2019 2020 2021 2022E
Budget Actual
(a) Represents Southwest PA well costs 9Considerable Progress in Reducing Unit Costs
Direct Operating Expense (LOE) Direct Operating Expense
▪ Declined $0.08 per mcfe, or ~44%, from 2018 to 2021 $0.18
due to Range’s water management and recycling $0.16
program, as well as divestment of higher cost assets
$0.14
$0.12
LOE per Mcfe
Cash G&A $0.10
▪ Declined $0.03 per mcfe, or ~18%, from 2018 to 2021 $0.08
due to divestitures and cost control initiatives
$0.06
$0.04
Production Taxes
$0.02
▪ Declined $0.02 per mcfe, or ~34%, from 2018 to 2021
$0.00
due to divestment of higher cost assets
2018 2019 2020 2021
Cash G&A Production Taxes
$160 $0.07
$0.06
Annual Cash G&A ($ millions)
$150
Production Taxes per Mcfe
$0.05
$140
$0.04
$130
$0.03
$120
$0.02
$110 $0.01
$100 $0.00
2018 2019 2020 2021 2018 2019 2020 2021
10Unit Cost Improvement to Continue
Gathering & Transport Contracts Structured to Decline
Gathering Costs to Decline
Annual GP&T Improvement Versus 2021
▪ Certain contracts in Appalachia are
$0
structured such that Range’s fees
decline annually, while capacity -$50
remains the same -$100
$ millions
▪ Contractual savings continue -$150
through 2030 and beyond for the
same capacity -$200
-$250
Transportation Optionality -$300
2022E 2023E 2024E 2025E 2030E
▪ Range has the option to renew
Contractual Decline Range's Election
certain contracts or let them expire,
depending upon economics GP&T Improves as Contractual Costs Decline
$1.60
$1.50
GP&T Is Expected to Decline
GP&T per Mcfe (a)
Over the Coming Years.
$1.40
Contractual Improvements
Continue Through 2030 and $1.30
Beyond.
$1.20
2022E 2023E 2024E 2025E 2030E
(a) Based on strip pricing as of 2/11/22 and assumes maintenance capital, flat NGL prices in 2023+, and the renewal of
transportation contracts 11Price Uplift & NGL Margins Expanding
Liquids Price Uplift Drives Premium Realizations to NYMEX
Liquids Production Driving
$6.50 $0.60
Premium Realizations
$6.00 $0.50
RRC Realization vs. NYMEX HH
• Range’s average 2021 realization was
Liquids Realization ($/mcfe)
$5.50 $0.40
over $0.25 above NYMEX gas
$5.00 $0.30
• Range’s realizations compare favorably
$4.50 $0.20
versus dry gas peers, who typically $4.00 $0.10
realize prices below NYMEX gas $3.50 $0.00
$3.00 -$0.10
Condensate Provides Further Uplift
• Range’s average 2021 condensate $2.50 -$0.20
$2.00 -$0.30
realization of over $60/bbl equates to 1H 2019 2H 2019 1H 2020 2H 2020 1H 2021 2H 2021
over $10 per mcfe Liquids Realization ($/mcfe) RRC Realization ($/mcfe) vs NYMEX HH
NGL Margins Expanding with Rising Prices
$40
NGL Margins Reach Multi-Year High
• Range’s 2021 NGL realizations increased over
$35
$15/bbl vs. 2020
$30
• NGL margins increased over $13/bbl in 2021
$ per Barrel
$25
vs. 2020, net of price-linked processing
$20 • NGL prices and margins expected to increase
$15 further in 2022, assuming strip pricing(a)
$10
Margin Uplift Increases Cash Flow
$5
• NGL price strength in 2021 versus 2020
$0
1H 2019 2H 2019 1H 2020 2H 2020 1H 2021 2H 2021 resulted in ~$600 million incremental
NGL GP&T Pre-Hedge NGL Margin Pre-Hedge NGL Realization revenue and ~$500 million cash flow
Note: Figures based off pre-hedge realizations (a) Assumes strip pricing as of 2/11/22 12Range’s Strong NGL Realizations Driven by Exports
Differentiated NGL Sales Arrangements Ability to Export Provides Price Diversification
▪ Range exports a larger percentage of propane and Ethane Diversification Propane & Butane
butane than any U.S. independent
▪ Ability to extract additional ethane based on relative
economics Mont Northeast
Ability to Export Boosting Realizations Belvieu Oil-Linked
▪ Range’s differential to Mont Belvieu has improved
considerably, driven by increased exports Exports
Gas-Linked
▪ Range expects international price arbs to support
continued exports
▪ Realizations more than doubled in 2021 versus Note: Pie charts represent annual average. Range has the ability to increase domestic sales in winter
months when local prices are strong.
2020, with further improvement expected in 2022
NGL Prices Have Significantly Increased NGL Differential Improving With Increased Exports
$45 $3.00
(a)
(a)
Differential to Mont Belvieu ($/bbl)
Mont Belvieu NGL Price ($/bbl)
$40
$2.00
$35
$1.00
$30
$25 $0.00
$20 ($1.00)
$15
($2.00)
$10
$5 ($3.00)
($4.00)
2018 2019 2020 2021 2022E
Source: Bloomberg. (a) Based on average NGL barrel composition of 53% ethane, 27% propane, 7% normal
butane, 4% isobutane and 9% natural gasoline. 13Significant Free Cash Flow Forecasted at Strip
Cumulative Free Cash Flow
Excess Free Cash Flow
2022 Outlook(a) ($4.25 NG / $87 WTI / $35 NGL) $4,000
Provides Optionality
$3,500
▪ Free cash flow exceeds $1 billion at strip pricing
$3,000
▪ Forecasted leverage improves to ~1.0x by year-end 2022 $2,500
$ millions
at strip pricing $2,000
▪ Initiating returns of capital to shareholders via dividends $1,500
and share repurchases $1,000
$500
2023 Outlook(a) ($3.65 NG / $78 WTI / $29 NGL) $0
2021 2022 2023 2024 Announced
Outlook Outlook Outlook Shareholder
▪ Free cash flow exceeds $0.9 billion at strip pricing Returns
▪ Cumulative debt reduction drives leverage towards ~0.5x Cumulative Free Cash Flow Share Repurchases Dividends
at year-end 2023 Free Cash Flow Strengthens Balance Sheet(c)
$3,500 3.5x
▪ Continuation of capital returns to shareholders
$3,000 3.0x
2024 Outlook(a) ($3.35 NG / $73 WTI / $28 NGL) $2,500 2.5x
Net Debt ($ millions)
Net Debt / EBITDAX
$2,000 2.0x
▪ Free cash flow exceeds $0.8 billion at strip pricing
$1,500 1.5x
▪ Cumulative free cash flow from 2022-2024 results in very
low net debt balance, even after dividend payments $1,000 1.0x
▪ Cumulative free cash flow from 2021-2024 totals ~70% of $500 0.5x
Range’s market capitalization(b) $0 0.0x
2020 2021 2022 2023 2024
Outlook Outlook Outlook
Year-End Net Debt Year-End Leverage
Significant Forecasted Free Cash Flow in Coming Years Presents
Opportunity for Further Return of Capital Increases
(a) Benchmark prices shown for 2022-2024 outlooks approximate strip, including the impact of hedges, as of 2/11/2022. 2024 NGL
benchmark assumes 40% of WTI realizations. (b) Market capitalization as of 2/18/2022. (c) Net debt balances reflect forecasted free cash 14
flow, net of dividend payments and before buybacksUnmatched Position in Southwest Appalachia
Significant Marcellus Inventory(a)
Range acreage
outlined in green
▪ ~460,000 Net Acres in Southwest Pennsylvania
▪ ~3,000 Undrilled Marcellus Wells
• 2,550 liquids rich well inventory
• 450 dry gas well inventory
Repeatable Capital Efficiency
▪ Range estimates ~2,000 undrilled Marcellus
locations remain with EURs greater than 2.0 Bcfe
per 1,000 foot of lateral
▪ In addition, over 1,000 down-spaced Marcellus
locations
▪ Additional potential from Utica & Upper Devonian
Longest Core Inventory Life in Appalachia(b)
18
16
14
Years of Inventory
12
10
8
6
4
2
0
Peer 1 Peer 2 Peer 3 Peer 4 RRC
(a) Estimates as of YE2021; includes anticipated down-spacing activity. Based on 10,000 ft lateral length. (b) Source:
Enverus. Peers include AR, CNX, EQT and SWN. Based on estimated inventory below $40 WTI and $2.25 Henry Hub. 15Value of Year-End 2021 Proved Reserves
PV-10 of $12.7 Billion, or ~$40 per
Share Net of Debt, Assuming Included in SEC Reserves
Year-End 2021 Strip Pricing ▪ By rule, only 5 years of development activity
▪ Proved Developed reserves of 10.4 Tcfe
▪ Proved Undeveloped (PUD) reserves of 7.4 Tcfe
Proved Developed
10.4 Tcfe ▪ Includes ~360 Marcellus PUD locations
Proved Undeveloped
7.4 Tcfe Reserve Value Ignores Potential
▪ Approximately 2,600 undrilled Marcellus wells not
classified as reserves
▪ Potential from ~400,000 net acres of both core
Utica and Upper Devonian
Reserve History
Resource Potential ▪ Peer-Leading Development Costs
~100 Tcfe ▪ Conservatism embedded in Range’s reserves
demonstrated by 14 consecutive years of positive
performance revisions
Significant Discount in Share Price vs. PV-10 Illustrates Highly-Accretive
Potential of Range’s $500 Million Share Repurchase Program
16Natural Gas Macro Remains Strong
Natural Gas Supply Remains at YE2019 Levels Supply Forecasted to Be Relatively Stable
▪ EIA forecasts supply to decline ~0.3 Bcf/d exit-to-exit in 100
2022, following just ~0.6 Bcf/d growth from 2019-21
95
▪ Future supply will be affected by significant reduction in
EIA U.S. Dry Gas Production (Bcf/d)
90
industry activity, as natural gas rig count has declined
over 40% from early 2019 85
▪ Recent industry efficiency likely unsustainable 80
following 4,415 DUC drawdown since June 2020 75
Natural Gas Demand Has Been Growing 70
▪ Exports have averaged ~18 Bcf/d year-to-date 2022, 65
which is >40% higher than 2020 average
60
▪ Export capacity to grow further in 2022 and beyond
U.S. Exports Are at Record Highs Gas Retaining Market Share at Higher Prices
20 Gas Generation as % of Thermal Generation (Gas+Coal) vs. NYMEX(a)
76%
18 74%
16 72%
70%
14
Bcf per Day
68%
12 66%
10 64%
62%
8 60%
6 58%
4 56%
54%
2 52%
0 50%
48%
46%
44%
42%
$1.00 $1.50 $2.00 $2.50 $3.00 $3.50 $4.00 $4.50 $5.00 $5.50 $6.00 $6.50
LNG Exports Exports to Mexico 2016-2019 2020 2021
Source: EIA, Bloomberg, Baker Hughes (a) Data represents summer season 17NGL Prices Have Risen With Improved Macro
Significant Storage Deficit Demonstrates Rapid Decline in U.S. Propane Storage Levels
Level of Under-Supply 105
U.S. Propane Storage (MMBL)
▪ Propane storage has declined from record highs in 95
late 2020 to near multi-year seasonal lows currently 85
▪ Ample spare U.S. LPG export capacity remains 75
following >65% capacity increase from 2019 to 2021 65
55
Supply Forecasted to Be Stable 45
▪ Industry capital discipline resulted in U.S. C3+ supply 35
averaging ~1% lower in 2021 versus 2020 highs
▪ EIA forecasts U.S. C3+ supply to be approximately
flat exit-to-exit in 2022 2020 2021 2022 5-Year Avg.
Significant Growth in U.S. LPG Export Capacity U.S. C3+ Supply Forecast to Be Stable
2,500 3.6
EIA U.S. C3+ Field Production (MMBL/D)
2,250 3.4
2,000 3.2
1,750 3.0
MBL/D
1,500 2.8
1,250 2.6
1,000 2.4
750 2.2
500 2.0
Jan-19 Jul-19 Jan-20 Jul-20 Jan-21 Jul-21
EIA LPG Exports Terminal Export Capacity
Source: EIA, operator announcements 18Natural Gas Plays Critical Role in Energy Transition
Emissions Reductions Driven by Natural Gas U.S. Emissions Reductions Driven by Power Gen.
▪ Between 2005 and 2020, total U.S. energy U.S. CO2 Emissions (MMT)
emissions declined ~24%, driven by ~40% decline 6,500 4,000
in emissions from power generation
3,500
Power Gen. & All Other Sector
▪ EIA attributes ~61% of U.S. power generation 6,000
3,000
emissions reductions to natural gas displacing coal
Total Energy
5,500 2,500
Natural Gas to Reduce Global Emissions 5,000 2,000
▪ Electrification of domestic and global economies will 1,500
4,500
boost power demand, much of which will be 1,000
supplied by natural gas 4,000 500
▪ China and India are increasing natural gas use in
efforts to reduce emissions growth
Total Energy Emissions Power Gen. Emissions All Other Sector Emissions
Electric Vehicle Growth Increases Power Demand Significant Coal Displacement Potential Remains
100%
90%
U.S. Electricity Consumption (TWh)
80%
Power Generation Mix
5%
70%
3%
60% 19%
50% 23%
40% 41%
72%
30% 63%
49%
20% 35%
10% 20%
0%
U.S. U.S. China India World Average
(2005) (2020) (2020) (2020) (2020)
Coal Natural Gas Nuclear Hydro Renewables Other
Source: EIA, NREL, IEA, BP Statistical Review of World Energy 19Leading in Environmental Practices
Commitment to Clean & Efficient Operations Continued Success in Reducing Emissions Intensity
▪ Over 80% reduction in GHG emissions intensity since 0.80
2011 0.70
GHG Intensity (MT CO2e/Mmcfe)
▪ Class-leading GHG emissions intensity ofGovernance & Social Responsibility
Range Is Committed to Strong Governance and Social Responsibility.
Range Views These Objectives as Core to Delivering Long-Term Value for Shareholders.
Board Governance Social Responsibility
✓ Average Director tenure of five years Safety Leadership
❖ Steve Gray appointed to the Board in October 2018 0.7 40
Contractor Recordable Injuries
Total Recordable Incident Rate
35
❖ Margaret Dorman appointed to the Board in July 2019 0.6
30
❖ Reginal Spiller appointed to the Board in September 0.5
2021 25
0.4
✓ Diversity remains a priority, as Range seeks to achieve a 20
0.3
combination of knowledge, experience and skills 15
0.2
✓ 33% of independent directors are women 10
0.1
✓ 50% of committees chaired by women 5
✓ Independent Chairman 0 0
2018 2019 2020
✓ Actively engage directly with shareholders TRIR Contractor Recordable Injuries
✓ Formed ESG & Safety Committee with all independent Community Impact
directors currently serving
✓ $240 million impact fees paid to Pennsylvania to support
construction of new schools, roads, parks, etc. since 2011
Director Independence
✓ $2.9 billion paid to landowners through 2020
✓ Charitable contributions of $460,000
All directors are independent except the CEO ✓ Invested over $100,000 into a Community Stimulus
Package for Surrounding Communities
21Executive Compensation Framework
Continued Improvements to Compensation Framework Are Essential to Aligning
Incentives with Evolving Shareholder Interests & Long-Term Strategic Initiatives
Long-Term Equity Incentive Plan Annual Incentive Targets
Long-term incentives focused on shareholder returns and Short-term incentives focused on key financial and ESG
prioritize balance sheet strength and environmental framework targets, prioritizing returns, cost efficiencies and
leadership. environmental, health & safety measures.
✓ 60% Absolute Measures & 40% Time-Based RSU ✓ Removed production and reserve growth per debt-
adjusted share in favor of returns-based metrics:
✓ Greater than 85% of CEO compensation at-risk
▪ Added Return on Capital
✓ Removed absolute measures of production and reserve
growth per debt-adjusted share in favor of: ▪ Drilling Rate-of-Return (added in 2017)
▪ Balance sheet target ✓ EHS component relies heavily on quantitative
assessments including:
▪ Emissions intensity target
▪ TRIR for employees and contractors
✓ Relative TSR component has absolute performance
modifier ▪ Preventable vehicle incidents
✓ S&P 500 introduced as peer to better align performance ▪ Spills and leak rates
✓ Restricted stock modified to 3-year cliff vesting from ▪ Notices of violations
30% / 30% / 40%
✓ Cash Unit Costs & Drilling & Completion Cost per Foot
✓ Reduced discretionary weighting and set rigorous
targets
Changes to Incentive Plans Were Informed by the Board’s Direct Outreach to
Stakeholders, Including Holders of Over 65% of Shares Outstanding
22Appendix
Multi-Decade Inventory of Capital Efficient Wells
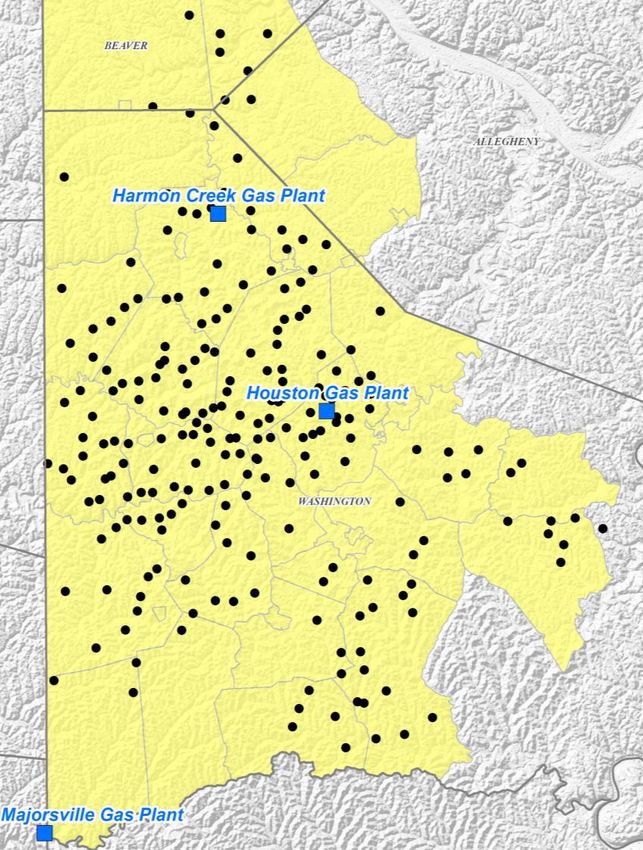
= Existing Pad Southwest Pennsylvania
Range Has Delineated Its Acreage
Position in Southwest Appalachia
▪ Since pioneering the Marcellus in 2004, Range
has drilled across its SW Appalachian position
▪ Over 1,400 producing wells provide control data
for new development activity
▪ Contiguous acreage provides for operational
efficiencies and industry leading well costs:
• Long-lateral development
• Efficient water handling and sourcing
• Use of electric fracturing fleet and existing infrastructure
Track Record of Returning to Existing
Pads
▪ Network of approximately 250 existing pads with
an average of 6 producing wells versus capacity
designed for an average of 20 wells
▪ Drives savings through use of existing surface
infrastructure
▪ Over 50% of 2022 activity on existing pads, similar
to prior years
▪ Well results after several years from returning to
existing pads show no degradation in recoveries
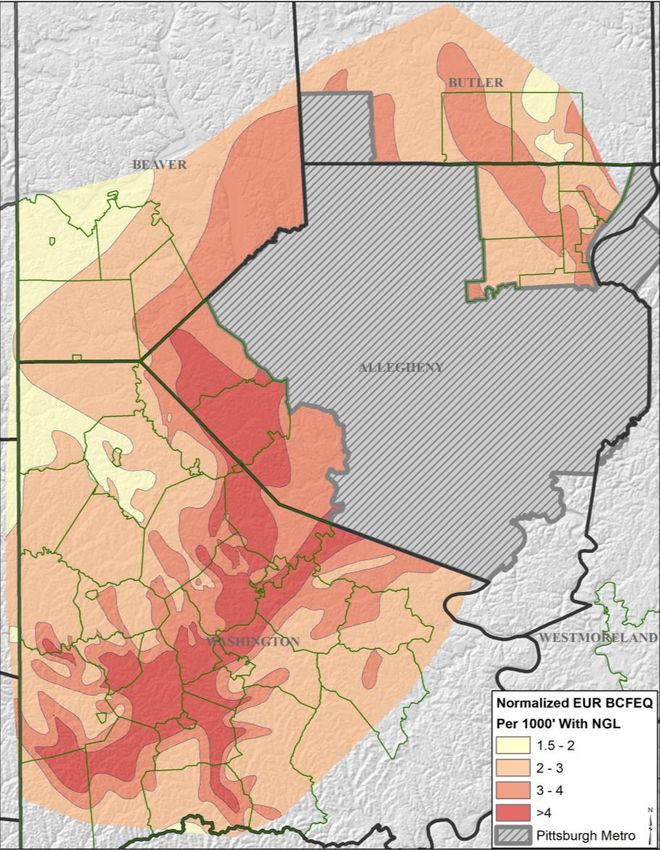
Note: Highlighted areas represent townships where Range holds ~2,000 or more acres 24Southwest Pennsylvania – Stacked Pay
▪ ~1.5 million net effective acres(a) in PA leads to
decades of drilling inventory
▪ Activity led by Core Marcellus development in
Southwest PA
▪ Over 1,250 producing Marcellus wells
demonstrate high quality, consistent results
across Range’s position Gas In Place
For All Zones
▪ Gas In Place analysis shows the greatest
potential is in Southwest Pennsylvania
▪ ~400,000 net acres in SW PA prospective for
Utica / Point Pleasant
▪ Range’s third dry gas Utica well appears to be Upper
one of the best in the basin Devonian
Stacked Pay and Existing
Pads Allow for Multiple Marcellus
Development Opportunities
Utica/Point
Pleasant
(a) Assumes stacked pay opportunities in Marcellus, Utica and Upper Devonian 25Northeast Pennsylvania – Marcellus
= Existing Pad Northeast Pennsylvania
▪ Approximately 70,000 net acres prospective for
Marcellus development
▪ 2021 Northeast PA production averaged over 70
Mmcf per day from over 150 producing wells
▪ Shallow base decline rate in Northeast PA
provides steady stream of cash flow
▪ Ability to return to existing pads and utilize
existing infrastructure, similar to Southwest PA
▪ Range plans to drill and complete 9 Northeast
Marcellus wells in 2022, with well returns
expected to be competitive with Range’s
Southwest Marcellus development program
Range’s Northeast Marcellus
Assets Provide Additional
Dry Gas Marcellus Inventory
Note: Highlighted areas represent townships where Range holds ~2,000 or more acres 26Southwest Appalachia Marcellus Modeling Data
Super-Rich Area Wet Area Dry Area
▪ ~110,000 Net Acres ▪ ~240,000 Net Acres ▪ ~110,000 Net Acres
▪ EUR / 1,000 ft. = 2.68 Bcfe ▪ EUR / 1,000 ft. = 3.05 Bcfe ▪ EUR / 1,000 ft. = 2.41 Bcfe
▪ D&C Cost / ft. = $738 ▪ D&C Cost / ft. = $687 ▪ D&C Cost / ft. = $641
Gross Estimated Cumulative Recoveries by Year
Condensate Residue NGL Condensate Residue NGL Residue
Year Year Year
(Mbbls) (Mmcf) (Mbbls) (Mbbls) (Mmcf) (Mbbls) (Mmcf)
1 87 1,158 208 1 29 1,763 306 1 4,166
2 122 1,962 353 2 43 2,934 509 2 6,334
3 146 2,655 477 3 52 3,882 674 3 7,928
5 179 3,817 685 5 63 5,382 934 5 10,288
10 230 5,965 1,067 10 73 7,969 1,383 10 14,096
20 291 8,744 1,557 20 78 11,151 1,935 20 18,576
EUR 360 11,973 2,111 EUR 80 14,714 2,554 EUR 24,135
Note: 2022 plan well costs and type curves assume 10,000 ft. average lateral. Average SWPA NRI is ~79.5%. NGL
recoveries assume 80% ethane extraction. 27Low Maintenance Capital Requirement
Appalachia production: 1st year recoveries(a) for SW PA wells:
~2.14 Bcfe/d
• Super Rich = 2.93 Bcfe gross (2.33 Bcfe net)
• Wet = 3.77 Bcfe gross (3.00 Bcfe net)
• Dry = 4.17 Bcf gross (3.31 Bcf net)
Production to Replace: Average: ~2.88 Bcfe net per well
~82 Bcfe
Well Costs(a) for SW PA:
~19% Base Decline • Super Rich: $7.38 million
• Wet: $6.87 million
Ending production: • Dry: $6.41 million
~1.73 Bcfe/d
Average: ~$6.9 million cost per well
J F M A M J J A S O N D
Simple Calculation(b) Additional Considerations(b)
• Average well contributes ~1.44 Bcfe net in calendar • Non-D&C investment: ~$30 million annually
year if brought on mid-year under perfect conditions • Typical operating adjustments:
• Production can be held flat with ~57 wells • Ethane flexibility
57 wells x 1.44 Bcfe recovery = ~82 Bcfe • TIL allocation (wet vs. dry)
• ~57 wells x ~$6.9mm average well cost = ~$390mm • Timing of TILs
• Maintenance, weather, etc.
~$390 million D&C Maintenance Capital ~$470 million All-In Maintenance Capital
(a) Assumes 10,000 ft. laterals and 2022 plan well costs (b) Assumes constant DUC inventory 28NGL Price Calculation Example
% of RRC Barrel Mont Belvieu ($/gal) Avg. 2021 1Q 2022E 2Q 2022E 3Q 2022E 4Q 2022E Avg. 2022E Avg. 2023E
53% Ethane $0.31 $0.37 $0.35 $0.34 $0.34 $0.35 $0.28
27% Propane $1.04 $1.22 $1.17 $1.12 $1.12 $1.16 $0.96
7% Normal Butane $1.18 $1.50 $1.37 $1.32 $1.32 $1.38 $1.12
4% Isobutane $1.18 $1.51 $1.38 $1.32 $1.32 $1.38 $1.12
9% Natural Gasoline $1.56 $2.07 $2.04 $1.92 $1.85 $1.97 $1.73
Range-Equivalent Mont Belvieu Barrel ($/gal) $0.72 $0.88 $0.83 $0.80 $0.79 $0.83 $0.69
Range-Equivalent Mont Belvieu Barrel ($/bbl) $30.05 ~$36.90 ~$35.00 ~$33.70 ~$33.25 ~$34.70 ~$28.90
Range's Pre-Hedge Realization ($/bbl) $31.23
Range's NGL Differential ($/bbl) $1.18 $0.00 - $2.00
2022 Guidance is the Range-Equivalent Mont Belvieu Barrel
PLUS $0.00 to $2.00 per Barrel
Note: Prices represent strip pricing as of 2/11/2022. Calculations illustrate pre-hedge realizations.
Conversion rate is 42 gallons : 1 barrel 29Long-Term Free Cash Flow Example
Range Has the Potential to Generate Significant, Durable Free Cash Flow Over Time.
Diversified Production Mix Protects Cash Flow if the Price of One Commodity Declines.
Annual Free Cash Flow ($ Billions)
NYMEX Natural Gas ($/Mmbtu)
$0.00 $2.50 $4.50
$40 $0.1 $1.2
WTI
($/bbl)
$100 $1.0 $2.0
Key Assumptions:
• Annual production and capital expenditures held constant from 2022 guidance
• Price differential and unit costs are assumed to be similar to 2022 guidance, adjusted for contractual savings
in gathering expenses over time, in addition to forecasted interest expense savings with debt reduction
Other Considerations & Takeaways:
• Even in bearish price scenarios, Range still generates ample free cash flow to cover dividend payments
• Modest hedging program can support cash flow further during weak price environments
Note: Free cash flow defined as operating cash flow before changes in working capital, less capital expenditures 30Macro Outlook Natural Gas & NGL
Natural Gas Demand Growth Outlook
2022-26 Demand Outlook                                                           U.S. Gas Demand Growth Outlook (Bcf/d)
                                                                            20
▪   Total demand growth of +19 Bcf/d through 2026                           18
    from LNG and Mexican exports, industrial and
                                                                            16
    electric power demand growth
                                                                            14
▪   LNG feedgas capacity increased to over 13 Bcf/d                         12
    in February 2022, with further growth expected by
                                                                            10
    year-end 2022
                                                                             8
▪   Second Wave LNG Projects could add another +8
                                                                             6
    Bcf/d of exports by 2026
                                                                             4
▪   Continued coal (currently ~22% of power stack)                           2
    and nuclear retirements (~19% of power stack)
                                                                             0
    present upside to this demand outlook                                                         2017-21                                               2022-26
▪   Reshoring of industrial demand and investments                                R+C        Industrial+Other         Electric Power         Mexico Exports       LNG Exports

    in domestic supply chains present upside to                                  U.S. LNG Export Terminal Capacity (Bcf/d)
    industrial gas demand
                                                                       22

                                                                       20                                       FERC Approved, Potential
                                                                                                                   Next Wave Projects
U.S. LNG Export Demand Outlook                                         18
                                                                                                                                                                      Potential 2022
                                                                                                                                                                       FID Projects

                                                                       16
                                                                                                                                                                     ECA Phase 1
▪   Second Wave U.S. LNG Projects of ~4.2 Bcf/d                        14               Under Construction
                                                                                                                                                                     Golden Pass T1-T3

    already under-construction. Further +4 Bcf/d likely                12
                                                                                           or In-Service                                                             Calcasieu Pass
                                                                                                                                       Sabine Pass T6
    to FID in 2022-23                                                  10
                                                                                                                                    Corpus Christi T3
                                                                                                                                 Freeport T1-T3
▪   Over 30 Bcf/d of Second-Wave LNG projects                           8
                                                                                                                             Cameron T1-T3
    have been proposed                                                  6                                                Corpus Christi T1-T2

▪   Range forecasts U.S. LNG feedgas capacity to                        4                               Cove Point
                                                                                                                     Elba Island

    reach ~14 Bcf/d in 2022 and ~21 Bcf/d by 2026                       2                 Sabine Pass T1-T5

                                                                        0
                                                                         12/16 12/17 12/18 12/19 12/20 12/21 12/22 12/23 12/24 12/25 12/26

                                Source: EIA, LNG operator announcements, Range Resources                                                                                               32
Natural Gas – 40% of U.S. Generation Mix
U.S. Power Generation by Source(a)
Growing Market Share in Power Gen.
40 48%
▪ Gas power demand grew by 12 Bcf/d from 45%
35 44%
2010-2020, while coal declined 20 Bcf/d(a) 42%
38% 40%
39% 39%
and renewables grew 6 Bcf/d(a) 30 37% 35%
33% 34%
Bcf per Day Equivalent
32%
25 30%
28% 28% 33% 28%
25% 30% 30%
20 24% 23%
21% 23%
Market Share Growth Should Continue 15
19%
▪ Approximately 18 Bcf/d of coal generation 10 11% 13%
10% 10%
remains to be displaced, or ~22% of U.S. 5% 6% 7% 7% 8%
5
Power Generation Mix 3% 4% 4% 5%
▪ 84 GW of coal plant capacity retired from 0
2008 2009 2010 2011 2012 2013 2014 2015 2016 2017 2018 2019 2020
2013-2021, and another 29 GW of coal plant Coal Gas Nuclear Hydro Solar+Wind Other
retirements have already been announced
for 2022-2026 Announced Coal & Nuclear Reactor Retirements
▪ More retirement announcements 14,000 3.5
Displacement (Bcf/d equivalent)
expected to occur in coming months/years 12,000 3.0
▪ Planned nuclear retirements (~3 GW of
Retirements (MW)
10,000 2.5
announced retirements for 2022-2026) also 8,000 2.0
remove large base-load of power generation 6,000 1.5
▪ New gas-fired reciprocating engines being 4,000 1.0
added to balance grid instability issues
2,000 0.5
created by renewables
0 0.0
2021 2022 2023 2024 2025 2026
Coal Nuclear Cumulative Displacement
Source: EIA. (a) Assumes 7x Heat Rate for gas equivalence 33Lower 48 Dry Gas Production
U.S. Natural Gas Production Has Declined ~3% From Late 2021 Highs,
Following Decline of Flush Winter Production and Return of Shut-In Volume.
Future Supply Growth Expected to Remain Low Due to Reduced Operator Activity.
100
98
96
94
U.S. L48 Pipeline Flows (Bcf/d)
92
90
88
86
84
82
80
78
76
74
72
70
68
1-Jan 1-Feb 1-Mar 1-Apr 1-May 1-Jun 1-Jul 1-Aug 1-Sep 1-Oct 1-Nov 1-Dec
2018 2019 2020 2021 2022
Source: Bloomberg 34Natural Gas Supply Less Net Exports
U.S. Natural Gas Supply Has Declined ~7% From 2019 Highs, When
Accounting for Significant Growth in U.S. Exports in Recent Years.
92
U.S. L48 Gas Production - Net Exports (Bcf/d)
90
88
86
84
82
80
78
76
74
72
70
68
1-Jan 1-Feb 1-Mar 1-Apr 1-May 1-Jun 1-Jul 1-Aug 1-Sep 1-Oct 1-Nov 1-Dec
2018 2019 2020 2021 2022
Source: Bloomberg 35Demand Growth Requires Higher Long-Term Prices
U.S. Natural Gas Supply & Demand Waterfall (Bcf/d)
116
114
112
110
108
106
104 ~15
102 Bcf/d
100
98
96
94
92
90
88
86
2021 ResComm Industrial Electric Mexico LNG 2026 Associated GOM & Call on
Demand & Other Power Exports Exports Demand Gas Other Gassy Basins
▪ Demand grows >19 Bcf/d by 2026, driven by increased LNG exports, industrial demand and power generation
▪ Collapse in oil-basin activity in 2020 and industry focus on capital discipline significantly reduce outlook for
associated gas growth versus pre-2020 expectations
▪ Flat offshore and declining legacy production offset some associated gas growth
▪ Result is a call on gassy basins of an additional ~15 Bcf/d to meet new demand
▪ Even if oil basin activity increases further with rising oil prices, significant growth is still needed from
gassy basins to meet future demand.
▪ Higher prices will be needed for Appalachia supply growth to meet demand, notably as core exhaustion accelerates
▪ Investor pressure for free cash flow limits public operator spending at current strip pricing
▪ Many public and private operators have hedged at low prices, limiting cash flow upside to rising prices
▪ Lack of exit strategy and incremental funding pressures PE-backed private operators to preserve liquidity /
generate free cash
Note: Associated gas supply assumes 5% CAGR. Other supply represents legacy shale, conventional, offshore and imports. 36NGL Macro Outlook
NGL Demand Growth Growing U.S. LPG Market Share with Rising Exports
4,500 50%
▪ IEA forecasts LPG (propane and butane) and 45%
4,000
ethane to be among the fastest growing global oil
Waterborne LPG Trade (MBL/D)
3,500 40%
products over medium and long term
35%
U.S. Market Share
3,000
▪ IEA projects LPG growth in residential cooking use, 30%
2,500
reducing global emissions versus current use of 25%
biomass for cooking 2,000
20%
▪ IEA forecasts Indian LPG demand to grow >50% 1,500
15%
2020-2030 as access to clean cooking grows 1,000 10%
▪ In 2022, international PDH plants are scheduled to 500 5%
start up with a combined capacity of 275 MBPD of - 0%
propane demand, in addition to another 60 MBPD
of LPG demand from new Asian ethylene capacity U.S. Waterborne LPG Trade Non-U.S. Waterborne LPG Trade U.S. Market Share
Ample Capacity for Additional U.S. LPG Exports
U.S. Export Bottleneck Relieved
3,000 120%
▪ U.S. LPG export capacity significantly increased in
recent years to ~2.45 MMBPD versus EIA field 2,500 100%
production of LPG (C3, NC4 and iC4) of ~2.79
Capacity Utilization
MMBPD in November 2021 2,000 80%
▪ U.S. LPG exports represented ~44% of global
MBL/D
1,500 60%
seaborne LPG trade in 2021, with ample spare U.S.
LPG export capacity remaining to gain market share 1,000 40%
▪ Local Northeast propane differentials have
500 20%
improved since start up of Mariner East 2
0 0%
EIA Forecasts U.S. C3+ Supply to Be
Jan-11
Jan-12
Jan-13
Jan-14
Jan-15
Jan-16
Jan-17
Jan-18
Jan-19
Jan-20
Jan-21
Jul-11
Jul-12
Jul-16
Jul-17
Jul-18
Jul-19
Jul-20
Jul-13
Jul-14
Jul-15
Jul-21
Approximately Flat Exit-to-Exit in 2022
Export Capacity Propane Exports Butane Exports Capacity Utilization
Source: IEA, India Energy Outlook, EIA, Wood Mackenzie, KPLER, Range estimates 37Propane Prices Moving Back to Pre-Shale Norms
Balanced Market Average (1993-2011): 71%
120%
100%
Propane / WTI Crude Price Ratio
Expected Return to
Balanced Market
80%
60%
40%
20%
Shale Supply Growth & Logistical Bottlenecks (2012-2020): 47%
0%
Propane% WTI Average
▪ Prior to the U.S. shale boom, propane fundamentals supported prices ~70% of WTI
▪ When shale supply growth outpaced demand growth and export capacity, the propane-WTI relationship de-coupled
▪ However, reduced shale supply growth and significant export capacity growth since early 2020 have strengthened
propane fundamentals, as propane prices have begun to return to the pre-shale norm
▪ Going forward, industry discipline and commitment to free cash flow reduce the future supply outlook. Meanwhile,
global demand for cleaner fuels continues to grow, and the U.S. has ample spare LPG export capacity to reach
growing global demand.
▪ Strengthened propane fundamentals support prices similar to pre-shale relationship to WTI. For example,
70% of $60/bbl WTI equates to $1/gal propane.
38LPG Demand Absorbs Growing U.S. Exports
Global LPG Supply & Demand Waterfall (MBL/D)
12,200
12,000
11,800
11,600
11,400
11,200
11,000
10,800
~800
10,600 MBPD
10,400
10,200
10,000
9,800
9,600
2021 ResCom + Industry PDH Ethylene 2026 Non-U.S. Call on
Demand +Autogas + Other Demand Supply U.S. Supply
▪ U.S. LPG spare export capacity averaged ~700 MBL/D in 2021, leaving room for further LPG export growth
▪ Global LPG demand CAGR of ~3.8% 2012-21. Forecast assumes demand grows at 5-year CAGR of 3.4%.
New PDH/ethylene projects drive ~1,000 MBL/D of demand growth.
▪ ResComm (~50% of demand) is steadily growing due to continued adoption rates in China, India, Indonesia
and other regions without access to electricity
▪ International LPG supply grows in 2022 due to partial return of OPEC+ production cuts, offset by OECD
refinery closures (~30% of global LPG supply comes from refining), and a slowdown in new LNG projects
▪ Relative economics support use of LPG over naphtha for international steam crackers. In an over-supply case,
converting just 10% of global naphtha ethylene cracking fleet would absorb a further 600 MBL/D of LPG.
▪ Call on U.S. Supply is ~800 MBL/D 2021-26, versus consultant supply growth forecasts of ~270 MBL/D
Source: EIA, Energy Aspects, Wood Mackenzie, IEA 39Financial Detail
2022 Annual Guidance
                                                                                       Full-Year 2022
                                                                                         Guidance
    Production per Day                                                                 2.12 - 2.16 Bcfe
    Capital Expenditures
     Drilling & Completion                                                          $425 - $445 Million
     Land & Other                                                                      $35 Million

    Cash Expense Guidance
     Direct Operating Expense per mcfe                                                 $0.09 - $0.11
     TGP&C Expense per mcfe                                                            $1.52 - $1.56
     Production Tax Expense per mcfe                                                   $0.03 - $0.05
     G&A Expense per mcfe                                                              $0.15 - $0.17
     Exploration Expense                                                              $22 - $28 Million
     Interest Expense per mcfe                                                         $0.20 - $0.22
     DD&A Expense per mcfe                                                             $0.46 - $0.50
     Net Brokered Marketing Expense                                                   $8 - $14 Million

    Pricing Guidance
     Natural Gas Differential to NYMEX                                               ($0.35) - ($0.45)
     Natural Gas Liquids (a)                                                     $0.00 to $2.00 per barrel
     Oil/Condensate Differential to WTI                                              ($6.00) - ($8.00)

                  (a) Represents differential to Mont Belvieu-equivalent barrel, based on a weighting of 53% ethane, 27% propane, 7% normal
                  butane, 4% iso-butane and 9% natural gasoline.                                                                              41
Well-Structured, Resilient Balance Sheet
• $2.4 billion elected commitment provides ample Year-End 2022 Net Debt / EBITDAX(a)
liquidity as Range has transitioned to generating
2.0x
significant free cash flow at strip pricing
• Approximately $750 million senior notes due by end 1.5x
of 2023 could be retired with expected free cash flow
• In January 2022, issued $500 million of 4.75% senior 1.0x
notes due 2030
• Proceeds were used to redeem $850 million 0.5x
senior notes due 2026 in February 2022
0.0x
• Annual interest savings of over $40 million Peer 1 RRC Peer 2 Peer 3 Peer 4
Successfully Reduced Debt & Improved Maturity Profile
Year-End 2018 Year-End 2021(b)
$2,400 $2,400
Total Debt: Total Debt:
$2,000 ~$3.9 Billion $2,000 ~$2.8 Billion
$1,600 $1,600
$ in millions
$ in millions
$1,200 $1,200
$929
$800 $749 $943 $750 $800 $750
$600
$498 $532 $500
$400 $400 $218
$203
$0 $0
2021 2022 2023 2023 2024 2025 2026 2027 2028 2029 2030+ 2021 2022 2023 2023 2024 2025 2026 2027 2028 2029 2030+
Range Notes Senior Secured Revolving Credit Facility Range Notes Senior Secured Revolving Credit Facility
Note: Peers include AR, CNX, EQT and SWN. (a) Based on FactSet Consensus estimates as of 2/18/22. (b) As of 12/31/21,
pro forma 2030 senior notes offering and redemption of 2026 senior notes in 1Q 2022. 42Hedging Program Supports Free Cash Flow
2022 2023
Avg. Floor Avg. Ceiling Avg. Floor Avg. Ceiling
Natural Gas $3.15 $3.49 $3.32 $3.84
Oil $61.54 $61.54 $71.39 $71.39
2022 Hedge Percentages 2023 Hedge Percentages
100% 100%
90% 90%
80% 80%
70% 70%
60% 60%
50% 50%
40% 40%
30% 30%
20% 20%
10% 10%
0% 0%
Total Revenue Natural Gas Oil NGLs Total Revenue Natural Gas Oil NGLs
Range’s Hedging Strategy, Coupled with a Diversified Production Mix,
Results in Both Downside Price Protection & Upside Price Participation
Note: Hedges as of 2/11/22, rounded to nearest 5% and assume election of swaptions. For a detailed monthly summary of
Range’s hedges, please visit the Company’s website. (a) NGL hedge percentage includes physical sales contracts with price 43
floors (puts), but no price ceiling.Favorable 2022 Hedge Position vs. Peers
Natural Gas Hedge Summary vs. Peers(a) Effective NYMEX Realization vs. Peers(a)
100% $4.00 $4.00
90% $3.80 $3.80
Effective NYMEX Price ($ per Mmbtu)
80% $3.60 $3.60
2022 Natural Gas Hedged
2022 Natural Gas Price
70% $3.40
$3.40
60% $3.20
$3.20
50% $3.00
$3.00
40% $2.80
$2.80
30% $2.60
20% $2.40 $2.60
10% $2.20 $2.40
0% $2.00 $2.20
RRC Peer 1 Peer 2 Peer 3 Peer 4
$2.00
% Hedged Avg. Floor Avg. Ceiling Effective NYMEX Realization
RRC Peer 1 Peer 2 Peer 3 Peer 4
Given the Constructive Outlook for Natural Gas Prices, Range Was Patient to
Hedge 2022 Natural Gas, While Also Increasing the Use of Collars.
As a Result, Range Has the Highest Effective NYMEX Realization
Among Appalachia Peers.
Note: Peers include AR, CNX, EQT and SWN. (a) Peer hedge percentages based on FactSet consensus estimates as of 2/18/22.
Effective NYMEX realization based on strip as of 2/11/22 and calculated as NYMEX strip, less hedge losses per mcf of production. 44Contact Information
Range Resources Corporation
100 Throckmorton St., Suite 1200
Fort Worth, Texas 76102
Laith Sando, CPA
Vice President – Investor Relations
(817) 869-4267
lsando@rangeresources.com
John Durham, CFA
Lead Financial Analyst
(817) 869-1538
jdurham@rangeresources.com
www.rangeresources.com
45You can also read