Scholarship @ Claremont - Claremont Colleges
←
→
Page content transcription
If your browser does not render page correctly, please read the page content below
Claremont Colleges
Scholarship @ Claremont

CMC Senior Theses CMC Student Scholarship

2021

SPAC Success Factors: Determinants of Post-Acquisition Share
Price Growth
Cade Moffatt

Follow this and additional works at: https://scholarship.claremont.edu/cmc_theses

 Part of the Finance and Financial Management Commons

Recommended Citation
Moffatt, Cade, "SPAC Success Factors: Determinants of Post-Acquisition Share Price Growth" (2021).
CMC Senior Theses. 2768.
https://scholarship.claremont.edu/cmc_theses/2768

This Open Access Senior Thesis is brought to you by Scholarship@Claremont. It has been accepted for inclusion in
this collection by an authorized administrator. For more information, please contact
scholarship@cuc.claremont.edu.
Claremont McKenna College

SPAC Success Factors: Determinants of Post-Acquisition Share Price
 Growth

 Submitted to
 Professor Dass

 By
 Cade Moffatt

 For
 Senior Thesis
 Spring 2021
 May 3, 2021

 1
2
Abstract

 This paper examines characteristics of Special Purpose Acquisition Companies
(SPACs) as determinants of post-acquisition success. I collected data on all SPACs which
merged with a target firm between 2016 and the start of 2021. The data set controls for a
host of variables including the contractual design of the SPAC, management team
characteristics, founder compensation structure, key underwriter data, and performance
metrics measured throughout the SPAC’s lifecycle. Using a multivariable regression, I
find new and robust insights into the SPAC market. Contrary to current literature, I
conclude that the misaligned incentives caused by the initial at-risk capital supplied by
founders are overstated. Additionally, I find evidence that underwriter characteristics are
declining in importance as more institutional investors enter the SPAC market. Finally, I
find that redemption rates have a key significant effect on post-acquisition share price
growth.

 3
Contents

I. Introduction..................................................................................................................5

II. SPAC Background ......................................................................................................7

 II.1 SPAC Structure .....................................................................................................7

 II.2 History ..................................................................................................................8

III. Literature Review ......................................................................................................9

 III.1 SPAC Sponsor Incentives .....................................................................................9

 III.2 The Role of Institutional Investor ....................................................................... 10

 III.3 Characteristics of SPAC success ......................................................................... 11

IV. Methodology ........................................................................................................... 13

 IV.1 Data ................................................................................................................... 13

 IV.1.1 Structural SPAC Data .................................................................................. 15

 IV.1.2 IPO Process Data ......................................................................................... 18

 IV.1.3 Performance Data ........................................................................................ 19

 IV.2 Model ................................................................................................................ 22

V. Results ...................................................................................................................... 24

 V.1 Structural SPAC Data .......................................................................................... 25

 V.2 IPO Process Data ................................................................................................. 28

 V.3 Performance Data ................................................................................................ 30

 V.4 Discussion ........................................................................................................... 31

Bibliography.................................................................................................................. 34

 4
I. Introduction

 Special Purpose Acquisition Companies, or SPACs, have experienced

tremendous growth over the past year, transitioning from a niche financial instrument

into the hottest commodity on Wall Street. Simply put, SPACs are blank check

companies which exist as an alternative to the traditional IPO process. They raise capital

through an IPO which is then used to merge with a private company, thereby taking it

public. Shareholders who do not approve of a proposed merger can choose to redeem

their shares in exchange for their full investment plus interest. If a SPAC fails to merge

with a target company within two years, it liquidates and returns capital to shareholders.

Once considered a “back-door” to public markets, the spotlight has suddenly been shone

on SPACs. Success stories of firms like Draft Kings (DKNG) providing shareholders

with impressive returns after going public via SPAC in 2020 created a favorable shift in

market sentiment, resulting in an extraordinary volume of new entrants into public

markets. As seen in Figure I.1, 2020 SPAC IPO proceeds were nearly double the entire

Figure I.1 - SPAC IPO Data from 2013 to April 10th, 2021. Source: (SPAC Research)
 350 120 Number of SPAC IPOs
 Amount Raised ($bn)

 300 100
S
 250
 80
 200
 60
 150
 40
 100
 50 20
 0 0
 2021
 2013 2014 2015 2016 2017 2018 2019 2020
 *
 # of IPOs 10 12 20 13 34 46 59 248 306
 Amount Raised ($bn) 1.4 1.8 3.9 2.5 10 10.8 13.6 83.4 99

 5
seven preceding years combined. Only four months into 2021, SPAC IPO proceeds have

already surpassed those record setting figures and outpaced traditional IPOs by a wide

margin.

 Despite the media hype, research on the determinants of post-acquisition

performance remains sparse. Unlike traditional firms, SPACs do not have operations or a

business model which can be used to predict success. Instead, a SPAC’s only assets are the

human capital of its management team and the capital raised through the IPO. Investors

are therefore faced with high levels of uncertainty when projecting the prospects of a

SPAC. Cummings (2014) compared this process to “betting on a jockey.” This paper

attempts to reduce the uncertainty by examining success factors of post-acquisition SPACs

using a host of variables regressed against post-acquisition share price growth.

 Past research has criticized SPACs for their structure which creates misaligned

incentives and substantial costs (Klausner, 2020); however, an empirical study focused on

post-acquisition performance has not been undertaken. The lack of research combined with

the continued flood of SPACs into public equity markets makes it increasingly important

to analyze the structure, history, and drivers behind SPAC success. While my study

provided many insights, three standout: first, contrasting previous research on perverse

incentives, at-risk capital supplied by founders was shown to have a positive and significant

effect on share price growth; second, there is new evidence suggesting that characteristics

of SPAC underwriters are declining in importance as more underwriters enter the SPAC

market; finally, share redemption rates were found to be highly variable across the SPAC

sample and had a negative, significant effect on post-merger SPAC performance. In my

 6
thesis, I will first provide insight into the structure and history of the blank check firms. I

will then discuss the existing literature before showcasing my methodology and results.

II. SPAC Background

II.1 SPAC Structure

 At their core, Special Purpose Acquisition Companies are an investment vehicle

which provide private firms an alternative route to public markets. Founders, or sponsors,

pool capital together for the sole purpose of taking a private firm public. At this point, they

have no business operations and do not have an acquisition target. The SPAC then raises

additional capital from institutional investors through an IPO. Typically, 85% to 100% of

IPO proceeds enter a trust which can only be used for an acquisition (Jenkinson and Sousa,

2009). During the SPAC’s life, the trust earns interest by investing in short term US

government securities. The remaining IPO proceeds and startup capital from founders are

used to cover the underwriter fees, IPO expenses, and working capital.

 Instead of receiving a salary, SPAC founders are compensated with a significant

equity stake purchased at a nominal price prior to the IPO. This block of shares is

commonly called the “promote” and typically equates to 25% of IPO proceeds or 20% of

shares outstanding. These shares are placed into an escrow account and are subject to

transfer restrictions and anti-dilution mechanisms. Restrictions often include a lock-up

period of up to one year after the business combination with exceptions if shares break a

specified price threshold.

 The SPAC founders have a two-year window after the IPO to complete an

acquisition. If this deadline is not met, the trust account is liquidated and returned to public

 7
shareholders. Assuming a firm is identified, an announcement is made and shareholders

vote to approve the deal. If shareholders do not approve of the acquisition, they can redeem

their shares in exchange for their initial investment plus interest. Founders, however, are

unable to participate in any liquidation meaning that they end up with nothing if they fail

to complete a deal. Oftentimes, liquidated shares are replaced through a private investment

in public equity, or PIPE, to ensure a deal is completed. Once a deal is completed, SPAC

shares are converted into shares of the new combined firm. Figure II.1 illustrates the SPAC

lifecycle.

Figure II.1 - The SPAC Lifecycle

II.2 History

 SPACs have only recently entered the mainstream, but the earliest iteration in the

United States can be traced back to 1993. Following the 1987 stock market crash, the SEC

implemented Rule 419 which was designed to give additional protection to public investors

 8
from blank-check penny stock companies. SPACs soon followed to circumvent the new

restrictions put in place. Since SPACs operated outside of the SEC’s new regulation,

Murray (2017) argues that they have been able to undergo change and evolution more

swiftly, leading to an investment vehicle that can quickly adapt to volatile market

conditions. Recent changes include removing share redemption thresholds and allowing

for share trading after the merger vote, which essentially provides investors with 100%

downside protection. These changes have played a vital role in making SPACs an attractive

option for both founders and institutional investors. In the following section, I discuss the

SPAC literature and theory which shaped my empirical model.

III. Literature Review

III.1 SPAC Sponsor Incentives

 A criticism consistently leveled against SPACs is the misaligned sponsor incentives

influenced by the current deal structuring. As mentioned in the previous section, founders

are compensated with the promote which typically equates to 20% of the outstanding

shares. This has made SPAC management a highly lucrative and attractive position. In a

2007 study performed by Jog and Son, the median return for the founders of a successfully

merged SPAC equated to 1,900%. If a merger does not occur, however, the SPAC is

liquidated, and the founders lose their entire investment. Therefore, SPAC sponsors are

heavily incentivized to complete a deal regardless of the underlying quality of the target

firm (Jog and Son 2007). Later studies by Berger (2008) and Jenkinson et al (2011)

solidified the validity of Jog & Son’s findings. These incentive issues are thought to be

made worse by the start-up capital supplied by founders. This investment is devoid of

 9
redemption rights and is therefore referred to as “at-risk”. Klausner (2020) argues that

higher levels of at-risk capital will widen the gap between founder and shareholder

motivations.

 In addition to being the root of unbalanced incentives, the promote paid to sponsors

causes significant share dilution and decreases shareholder value. In effect, the promote

acts as a tax on a SPAC’s merger. Klausner (2020) concluded that, of the SPACs which

successfully merged between 2019-2020, the median net promote as a percentage of post-

merger equity was 7.7%. In order for the acquisition to be a value increasing transaction,

the merger must generate a surplus greater than the inherent dilution within the SPAC’s

structure.

III.2 The Role of Institutional Investors and Share Redemptions

 SPACs have been described by some as a poor man's private equity, allowing

average retail investors an opportunity to bet on a sponsors’ skills in identifying and

merging with a high potential private firm. From this perspective, SPACs can be viewed

as a democratizing force within financial markets. Klausner (2020), however, argued that

the role of institutional investors is often understated. In his study based on the 46 SPACs

which merged from January 1st, 2019 to June 30th, 2020, he revealed that the median

ownership by 13F filers during this period is 87% of pre-merger SPAC shares. It can be

inferred from this figure that SPACs have not given the average retail investor a seat at the

table.

 Given that institutional investors hold most of the pre-merger shares, it is important

to understand how these firms view their positions. One may be inclined to believe that

 10
institutional investors trust in the ability of the sponsors and plan to hold onto their shares

through the merger. Of the 2019-20 cohort of merged SPACs researched by Klausner

(2020), however, the mean redemption rate equated to 58%. Despite these high rates of

redemption, mergers were still completed due to growth of PIPE financing available to

SPACs. In this sample, 77% of SPACs raised additional capital at the time of their mergers.

 After share redemptions, there is an average of 42% of the original shares

outstanding. At first glance, these unredeemed shares appear to be instances where

investors expressed confidence in the proposed deal and held onto their shares. Klausner

(2020) attempted to investigate this by analyzing the divestment rate of 13F shareholders.

Divestment can be considered either a redemption or sale of shares starting from the merger

announcement until just before the merger closes. From their analysis, it was discovered

that the mean SPAC divestment rate stood at 90% for SPACs merged in 2019, indicating

that IPO investors choose to redeem or divest their shares regardless of the target

companies’ outlook. Therefore, a high rate of redemption seems to be an industry standard

rather than a predictor of a target companies’ future success. Questions remain about the

long-term validity of these insights and their impact on post-acquisition performance.

Klausner’s study only observed SPACs which merged in 2019. By observing a longer

period, I seek to gain a better understanding of the impact that institutional investors and

share redemptions have on SPAC mergers.

III.3 Characteristics of SPAC Success

 Research on the underlying drivers of a successful SPAC is quite sparse, however,

Cumming’s (2014) study successfully laid out an economic model and methodology to

 11
investigate. It applied a logit model to comprehensively analyze the success factors for

their dependent variable: acquisition approval. Their sample consisted of all completed

SPACs listed on U.S. stock exchanges between 2003 and 2010. This sample included 163

SPACs, ninety-eight of which successfully completed an acquisition. The study utilized

twenty-three explanatory variables combined into four separate sections: SPAC Structure,

IPO Process, Ownership Structure, and Operations and Performance. Interestingly, the data

indicates that more experienced managers and boards do not enhance the probability of

deal approval. Additionally, it was found that more prestigious underwriters and large

underwriter syndicates adversely affect the chances of an acquisition target being approved

(Cummings et al, 2014).

 Cumming’s research was foundational in understanding the drivers behind SPAC

acquisition approval. To be applicable in 2020, however, the methodology must be updated

to encompass the drastic variations that the SPAC market has undergone. For instance,

acquisition approval is no longer a valid metric for success given the drastic decline in

liquidation rates caused by the growth of PIPE investments and the removal of redemption

thresholds. Cumming’s sample had a liquidation rate of 40% in comparison to a 2%

liquidation rate in 2019. Additionally, investors looking to hold their shares through a

SPAC merger will be unable to derive insights from Cumming’s research. In this paper, I

shift my attention towards post-merger stock performance to understand how SPAC

success factors impact shareholder value.

 12
IV. Methodology

IV.1 Data

 The purpose of my research is to understand success factors determining positive

returns following a SPAC acquisition. To do so, I analyze share price growth over a

specified trading period. Murray (2017) argues that SPACs have been continuously

evolving and adapting to changing market conditions. This suggests that newer SPACs will

provide more relevant results. Additionally, SPAC acquisitions showed steady growth

starting in 2016 prior to the SPAC boom witnessed in 2020, indicating a favorable swing

in market sentiment toward SPACs as a method of reaching public markets. To capture the

latest trends in SPACs, I have focused my study on SPACs which completed a deal after

January 1st, 2016. My primary sample measures share price growth over a 365-day trading

window. SPACs which closed a deal after January 1st, 2016 and prior to April 30th, 2020

were eligible for the sample. To capture price movement as the deal approaches

completion, I chose to begin the trading window 30-days prior to the acquisition date.

 I utilized the investment database “SPAC Research” to identify all relevant

offerings. Results were then confirmed through the investment database “SPAC Track”

and the SEC’s Electronic Data Gathering and Retrieval (EDGAR) database. There was a

total of ninety-one SPACs who completed their life cycle as blank check companies and

either liquidated or acquired a company during this time frame. Eleven SPACs failed to

combine with a target firm and have thus been excluded from the dataset, leaving eighty

SPACs who successfully completed their acquisition. A further five SPACs have been

excluded from the sample. The first successfully combined with a target company;

 13
however, the firm waived the closing conditions under the merger agreement which would

have required common stocks and warrants to be listed on the NASDAQ. The second was

the subject of an additional acquisition nine months after its initial combination. The final

three were delisted during the 365-day trading window leaving a sample of 75 SPACs. To

ensure my results are robust and valid, I also created samples which measured share price

growth over a 180-day and 90-day trading period. This reduced trading window allowed

me to include additional SPACs to the sample from the latter stages of 2020 and the start

of 2021. The 180-day and 90-day samples contains 101 and 130 total SPACs, respectively.

Table IV.1 provides a breakdown of SPACs included in each sample by year. For all three

samples, I collected data across three different types: structural SPAC data, IPO process

data, and performance data. The following section provides detail on the sources and

insights that can be derived from the data. Table IV.2 identifies the variables and their

respective definitions.

 Table IV.1 – SPACs Included in Each Sample by Year

 Source: (SPAC Research and SEC EDGAR)

 14
Table IV.2 – Variable Definitions

 IV.1.1 Structural SPAC Data

 Structural SPAC data includes the contractual design of the offering, leadership

 information, and incentive structure. Most of this information was compiled through the

 investing databases “SPAC Research” and “SPAC Track” alongside audited filings from

 SEC EDGAR. All SPACS are required to submit form 424 to the SEC in accordance with

 the Securities Act of 1933 (Heyman 2007). I leveraged these public filings to obtain reliable

 information on key components of my SPACs of interest to be used in my analysis.

 Primarily, these filings were used to gather data on SPAC managers. All managers listed

 within form 424 were included in the total managers variable and their ages were averaged

 to create the team age variable. In this study, average team age is used as a proxy for

 experience.

 15
In addition to pulling data from SEC filings, the vetted forms allowed me to validate

information from my investing databases. Trust value, IPO units, at-risk capital, and

promote shares were exported from the archived database and at-risk capital database

found on SPAC Research. The trust value variable measures the total IPO proceeds placed

into the escrow account after the IPO in millions of dollars. The IPO shares variable

measures the total public shares outstanding directly after the IPO. At-risk capital measures

the initial funds provided by the founders in millions of dollars. If the SPAC were to fail

to make a business combination, the at-risk capital would not be returned to the founders

as it is devoid of redemption rights. The promote shares variable measures the total shares

awarded to founders after the business combination is completed. I divided the promote

shares by the total IPO shares to normalize the data across all SPACs. This variable is used

to understand the underlying incentive issues derived from the compensation structure for

sponsors. For variables not easily exportable, I created a web scraper which was able to

automate the data pulling process and eliminate manual errors. Finally, to obtain the

expertise dummy variable, I manually cross-referenced manager names from form 424

with the “SPAC Research” directors database. 1 is used to denote SPACs with a manager

who had successfully completed two or more business combinations in their history and 0

otherwise. This dummy variable is used as a proxy for management’s expertise and

understanding of the SPAC industry.

 16
Tables IV.3 and IV.4 contain structural data statistics for the one-year and 90-day

samples respectively. The 90-day sample allowed for an additional 55 observations from

the latter stages of 2020 and the start of 2021 and will thus provide insight into how SPACs

have continued to develop when compared to the 365-day sample. Trust value in the 365-

day sample has a mean value of $265 million and a standard deviation of $198.09 million

indicating that SPACs continue to be highly differentiated in size. Despite promote shares

being negotiable, the promote to IPO shares ratio has a standard deviation of 0.02

indicating that SPAC founders have historically received relatively uniform payouts across

all SPACs. This lack of variance may minimize the insights into the misaligned incentives

caused by the promote.

Table IV.3 – Structural SPAC Data Summary Statistics – One-Year Sample

Table IV.4 – Structural SPAC Data Summary Statistics – 90-Day Sample

 17
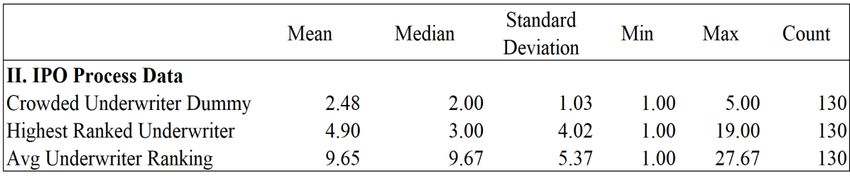
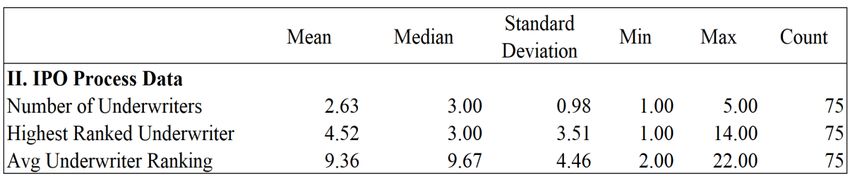
Trust value, number of managers, experience, expertise, and at-risk capital all had

relatively small increases after including the additional observations from the 90-day

sample (+1.5%, +0.2%, +0.1%, +3.3%, and +1.0% respectively). The promote to IPO

shares ratio, however, declined by -1.0%. The lack of significant change between the two

samples indicates that as SPAC boom continued through 2020, little evolution occurred in

SPAC structure.

IV.1.2 IPO Process Data

 IPO process data provides essential descriptive statistics on the SPAC IPO backers.

This data was scraped from SPAC Research through a channel of archival data on historic

SPAC underwriters. This dataset is given by annual panel data which I then aligned with

my structural SPAC data by year and underwriter. I was able to obtain data on the ranking

of underwriters based on total bookrunner volume as well as the total number of

underwriters backing a given SPAC. Examining the groups underwriting these SPACs will

allow my model to make predictions about how SPACs will perform based upon the total

volume in millions of dollars underwritten by the backer. Of particular interest in my

analysis is the phenomenon of “serial underwriting”, a case where one backer is behind an

extremely high volume of SPACs. By analyzing this group compared with low volume

backers, I can develop insights into underwriter incentives. We might expect that serial

underwriters back SPACs for the underwriting commission and fees associated with the

IPO rather than their expectations about company potential. Tables IV.5 and IV.6 contain

IPO process data summary statistics for the 365-day and 90-day samples.

 18
Table IV.5 – IPO Process Data Summary Statistics – One-Year Sample

Table IV.6 – IPO Process Data Summary Statistics – 90-Day Sample

IV.1.3 Performance Data

 Performance data includes variables which fluctuate during the SPAC’s lifecycle

and can be used as a benchmark for manager performance. Primarily, this data was scraped

from the archival database found on SPAC Research. The days searching variable was

calculated by finding the difference between the IPO date and the date the deal was

finalized. This variable allows for an analysis of SPAC managers ability to find a target

company quickly and close the deal. I expect that post acquisition performance will fall as

days searching approaches the two-year liquidation deadline. To not lose out on the

promote, managers will be motivated to push through a deal regardless of the quality of the

target firm. Redemption rate measures the percent of shares redeemed for cash from the

trust value throughout the SPAC’s lifecycle. Despite Klausner’s (2020) argument that

public investors divest their shares regardless of the potential outlook of the target firm, I

expect that redemption rate should give a measure of the shareholder’s trust in

 19
management. The implied pro forma enterprise value is calculated at the time of deal close

and pulled from the 8-K merger announcement. This value was then divided by trust value

to normalize across all observations. Principally, this variable will allow for an analysis of

management’s ability to find a favorable deal for shareholders. I expect there will be a

positive effect on post-acquisition performance the more enterprise value outweighs trust

value.

 For my dependent variable, I have chosen to analyze the growth rate of share price.

Studies in the past have largely focused their attention on the acquisition itself, however,

this provides little insight for investors looking for long term returns on their SPAC

investment. Using a price growth rate provides a more powerful indicator of a SPAC’s

success in current analysis, because it can directly chart a firm’s performance on public

markets. To calculate this value, I pulled daily share price data from the Center for

Research in Security Prices’ (CRSP) across my periods of interest for all SPACs included

in my sample. I used the following equation to calculate share growth:

 ℎ = ln ( 1 )
 0

 Tables IV.7 and IV.8 contain performance data summary statistics for the 365-day

and 90-day samples respectively. The 365-day price growth rate has a mean value of -32%

which is far below the S&P 500’s growth which had a CAGR of 12.9% between 2016 and

2020 (FRED). This clearly reflects the risky nature of SPACs and should be used to caution

investors trying to capitalize on the media hype. It is important to note, however, that SPAC

performance has shown strong improvement. The 13 SPACs included in the 365-day

sample which closed a deal in 2020 had a mean growth rate of 6.1%, highlighting the

 20
continued validation of SPACs as a method of reaching public markets. Interestingly, the

 90-day sample’s share price growth has a mean value of -6% up +26 percentage points

 from the 365-day sample. This indicates that public equity markets have historically

 overvalued SPACs shortly after the deal is completed.

Table IV.7 – Performance Data Summary Statistics – One-Year Sample

Table IV.8 – Performance Data Summary Statistics – 90-Day Sample

 The enterprise value to trust value ratio has a mean of 412%, highlighting the

 importance of PIPE financing to meet liquidity requirements. As Klausner (2020)

 showcased, 77% of SPACs received a capital infusion through PIPE financing or an

 additional investment from founders during their lifecycle. This additional capital provides

 management vital flexibility during the acquisition phase. The days spent searching for an

 acquisition had a mean value of 602.28 days which satisfies the two-year liquidation

 deadline. A considerable portion of the SPACs included in the sample, however, extended

 far beyond the deadline. In these cases, shareholders voted to extend the SPAC’s charter

 21
allowing it to bypass the liquidation requirements. Redemption rates in the 365-day sample

had a mean value of 55% which is consistent with Klausner’s (2020) study. After including

the additional firms from the 90-day sample, the mean falls by 10 percentage points. This

indicates the growing trust in SPACs from investors as more choose to hold their shares

throughout the entire SPAC lifecycle. Figure IV.8 shows redemption rates broken down by

year.

 Figure IV.8 – Average Redemption rates from 2017 through January 2021

 70%
 59% 58%
 60%
 51%
 50%

 37%
 40%
 29%
 30%

 20%

 10%

 0%
 2017 2018 2019 2020 2021

IV.2 Model

 To determine whether there is a significant linear relationship between share price

growth and the covariates listed above, I ran a multiple variable regression. For each

variable, I observe characteristics associated with SPAC “i” in year “t”. Prior to running

the regression, I transformed several variables to find the model with best fit. First, I

 22
performed a log transformation on At-Risk Capital to improve linearity between the

dependent and independent variables such that:

 = ln( )

Additionally, I created dummy variables using the number of managers, average team age,

number of underwriters, and days searching variables such that:

 0 ≤ 7
 = {
 1 > 7

 0 ≤ 53.6
 = {
 1 > 53.6

 0 ≤ 2
 = {
 1 > 2

 0 ℎ ≤ 730
 ℎ = {
 1 ℎ > 730

I chose seven directors as the Large Board Dummy variable cutoff and 53.6 as the

Experienced Dummy variable cutoff as they were the median values. Two was chosen as

the Crowded Underwriter Dummy cutoff because it logically allows for one lead

underwriter who takes on the most prominent role and a secondary underwriter with less

responsibility and less of the share of the profits. Finally, 730 days was chosen as the cutoff

point for the Days Searching Dummy as it naturally splits SPACs who completed their deal

within the two-year liquidation deadline and those who were forced to extend. To control

for the time difference fixed effect, I include a year dummy variable for each year and omit

2016. Running the regression with the four specified dummy variables above results in an

 23
R2 0.399 for the one-year sample and was thus chosen as the best fit. The adjusted R2 of 0.2332 is comparable to Kolb’s (2016) SPAC model which had an adjusted R2 of 0.19. V. Results Table V.1 outlines the regression results for all three samples. The one-year sample best represented the data, recording an R-squared of .399. Therefore, interpretations of the results are based on the one-year sample with consideration given to the significance and sign of the 180-day and 90-day samples. In the following section, I interpret the results across the three categories: structural SPAC data, IPO process data, and performance data. 24
Table V.1 - Regression Results

V.1 Structural SPAC Data

 Trust Value is the net IPO proceeds transferred to the SPAC escrow account. This

sum along with accrued interest is either used for an acquisition or paid back to investors

if the shares are redeemed or in the event of a liquidation. Cummings (2014) argues that

given a higher trust value, the value proposition of any acquisition proposal must be even

more attractive because the opportunity costs of redeeming shares increases. This implies

that shareholders demand a higher return on investment in cases where trust value is high.
 25
Surprisingly, trust value has a significant and negative effect on post-SPAC share price

performance for both the one-year and 90-day samples. For a one standard deviation

increase in trust value, there is an expected 0.44 standard deviation decrease in share price

growth. This reflects Roll’s (1964) argument that smaller firms yield larger average returns

even after adjusting for risk. Given that trust value is a large determinant of potential target

company size, it can be inferred that a larger trust value will have a negative effect on

returns.

 As stated previously, SPACs have no operations or business model that investors

can evaluate to predict success. Instead, investors base their decisions upon the

characteristics of the management teams (Cummings 2014). Interestingly, the large board

dummy variable produced a negative and insignificant sign across all samples. Yermack

(1996) argues that firms with smaller boards of directors have higher market valuations as

large boards may struggle with effective communication and decision-making. The

insignificant sign for the large board variable can be attributed to the immense structural

differences between SPACs and large corporations. The lack of operational responsibilities

allows for a far less complex environment where breakdowns in communication can be

mitigated.

 Similarly, the experienced variable returned a positive and insignificant sign.

Experience and institutional knowledge are likely essential to navigate the SPAC market

and acquire a successful target company; however, Cumming (2014) argues that younger

managers have not yet achieved comparable wealth to older managers and will thus be

more motivated to close a deal. These two contrasting effects may explain the lack of

 26
significance. While the experience variable was shown to be insignificant, the expertise

variable returned a positive and significant sign for both the one-year and 180-day samples.

If a member of a SPAC’s management team has completed one or more SPAC acquisitions,

there is a resulting 34.9% increase above average returns. The SPAC market is nuanced

and constantly changing. Having firsthand experience navigating the SPAC lifecycle is

shown to be instrumental in finding and identifying successful target companies.

 As stated in the literature review, there has been significant research dedicated to

the misaligned incentives and dilution caused by the sponsor promote, implying a negative

impact on post-acquisition share price performance (Klausner 2020). Receiving the

promote shares is contingent on founders successfully completing a deal. This causes

severe incentive issues, wherein the sponsor is motivated to complete an acquisition prior

to the expiration date regardless of the quality of the target firm. Interestingly, the promote

to IPO shares ratio returned a positive and insignificant sign. The lack of significance can

likely be explained by the uniformity within the sample. The mean value of promote shares

to total shares outstanding is 20.3% with only a 1.4% standard deviation in the one-year

sample. Founders are awarded proportionally similar compensation across most of the

SPAC population. Therefore, the SPACs within the sample are similarly impacted by the

sponsor promote, causing it to be insignificant.

 While the promote was shown to be insignificant, at-risk capital returned a positive

and significant sign for all three samples. A 10% increase in at-risk capital results in a 6.2%

rise in post-acquisition returns. SPAC founders are heavily incentivized to complete a deal

prior to their liquidation date due to the enormous payoff that can be achieved through the

 27
promote (Jog and Son 2007). These incentives grow even stronger when considering the

initial at-risk capital supplied by founders to cover overhead and IPO costs (Klausner

2020). Unlike other shares which can be redeemed from the trust value, at-risk capital is

void of redemption rights and cannot be recouped in the event of a liquidation. More capital

from founders should exacerbate the misaligned incentives between founders and public

shareholders. On the other hand, at-risk capital is exchanged for shares and warrants of the

SPAC and will thus force additional “skin-in the game” for founders. Founder payoff

becomes increasingly tied to post-acquisition performance as pools of at-risk capital grow

larger, explaining the positive and significant coefficient.

V.2 IPO Process Data

 The crowded underwriter dummy variable returns a negative and significant

coefficient for the one-year sample. Wilson (1968) proposes the idea that syndicates are

formed in cases where risk-sharing is needed. Instead of taking on the entire risk for a

particular SPAC, IPO investors choose to share it and split the subsequent payoff or losses.

Therefore, an increase in underwriters can be viewed as a lack of trust in SPAC

management from 13F filers. Additionally, SPAC management must balance challenges

derived from communicating with multiple stakeholders with differing risk tolerances.

This can slow efficiency and cause decision making problems. If a SPAC is underwritten

by three or more institutions, it results in a decline of 41% from the average return.

 The highest ranked underwriter variable returns a positive and significant

coefficient for the one-year sample. Intuitively, underwriters with a higher bookrunner

volume are more experienced and knowledgeable of the SPAC market. Additional

 28
expertise from underwriters is proven to be valuable during the searching and acquisition

phase of a SPAC’s lifecycle. For one increase in rank for a SPAC’s highest ranked

underwriter, there is an expected 6.6% increase in returns. Surprisingly, average

underwriter ranking results in a negative and significant coefficient for the one-year and

180-day samples. Each increase in rank results in an expected 6.6% increase in returns. It

appears that SPACs benefits from having a disparity in underwriter ranking. Having a clear

underwriting authority may mitigate the negative effects caused by having a crowded

underwriting table.

 It is important to note that the crowded dummy, highest ranked underwriter, and

average underwriter rank covariates all returned significant signs for the one-year sample;

however, they all proved insignificant in the 90-day regression. This is likely due to the

additional observations added to the sample from the end of 2020 and beginning of 2021.

By extending the sample period, the 90-day regression can more closely capture the effect

of the explosion in SPAC popularity seen in 2020. As a byproduct of the growth of SPACs,

a wave of institutional investors entered the SPAC market for the first time. In 2020, there

was a total of 41 active underwriters up 42% from 2019. This growth of institutional

investors reflects the continued legitimization of special purpose acquisition companies

and can explain the decreased need for risk sharing amongst underwriters. Additionally,

increased competition amongst underwriters and the subsequent increase in optionality for

SPAC founders likely mitigated the effects of specific underwriter characteristics.

 29
V.3 Performance Data

 The enterprise value to trust value interaction term is shown to have a positive and

significant sign with a 10-percentage point increase resulting in an expected 0.63% increase

in share price. These results can be interpreted in several different ways. First, it can be

inferred that the ratio between enterprise value and trust value showcases management’s

ability to strike a favorable deal for shareholders. It also provides further insight into the

effect of capital infusions during the SPAC lifecycle. In cases where trust values fall below

the required level of cash to complete a deal, SPACs have relied heavily on PIPE

investments to replenish redeemed capital and finalize mergers. These findings

demonstrate that PIPE financing affords management the flexibility to find and negotiate

more promising deals for shareholders.

 Redemption Rate returned a negative and statistically significant sign for all three

regressions, contradicting past research. Klausner (2020) argued that institutional

investors, who hold most of the public shares throughout a given SPACs life, are motivated

to divest their shares regardless of the potential quality of the target firm, minimizing the

insights derived from share redemptions. The data, however, shows that share redemptions

provide clear insight into post acquisition performance. Klausner focused his research on

SPACs which merged from 2019 through mid-2020 cohort, but significant changes have

been made since that point in time. As stated in the data section, average redemption rate

has fallen considerably since its high in 2018. This highlights the legitimization of the

SPAC market and shows that institutional investors are more willing to trust in the SPAC

process.

 30
The Days Searching Dummy coefficient proved to be statistically insignificant and

positive. As Jog and Son (2007) argued and later research confirmed, SPAC founders are

heavily incentivized to complete a deal prior to the liquidation date regardless of the quality

of the target firm. As time passes in theory, pressure to acquire a firm quickly continues to

mount for management. If a SPAC is unable to find a suitable acquisition target earlier in

its lifecycle, it becomes increasing unlikely that one will surface as the deadline looms

closer. Therefore, SPAC managers approaching the liquidation date should be incentivized

to push through riskier and less profitable acquisitions. Interestingly, the data does not

support this theory. The ability to circumvent the liquidation deadline by holding a

shareholder vote appears to mitigate the misaligned incentives derived from the SPAC

compensation structure.

VI. Conclusion

 This paper attempts to identify key SPAC characteristics that translate to post-

acquisition share price growth. The data I employ includes structural data, IPO process

data, and key performance metrics measured throughout the SPAC’s life. My study on the

determinants of post-acquisition success provides new and robust results which can be

employed by investors evaluating the SPAC market and for future studies.

 First, this paper reveals new findings on founder compensation, contradicting past

research. As discussed in the results section, at-risk capital was found to have a positive

and significant effect on share price growth in all three regressions despite the introduction

of potentially misaligned incentives. While there may still be concerns about founders

 31
promoting risky acquisitions to avoid losing their investment, additional at-risk capital

increases the tie between founder compensation and post-acquisition performance.

Applying this finding, shareholders should view high levels of at-risk capital as an indicator

of founder commitment.

 Second, I find evidence that underwriter characteristics are declining in importance

as a determinant for post-acquisition success. All three underwriter variables proved to be

significant in the one-year regression but were insignificant in the 90-day sample which

extends through January of 2021. The lack of significance in the 90-day sample reflects

rapidly changing market sentiments throughout 2020 which saw a wave of institutional

investors entering the SPAC market for the first time. SPAC founders now have

unprecedented optionality on who they plan to work with, and the results suggest that there

is no clear underwriter archetype which provides the strongest results. Therefore,

shareholders should not place excessive weight upon underwriter characteristics when

making investment decisions.

 Third, share redemption rates are shown to have a key significant effect on post-

acquisition share price growth for all three regressions. This result was to be expected but

was not certain given the high redemption rates seen across the majority of the SPAC

population. Additionally, Klausner’s (2020) argument suggested that most shareholders are

incentivized to divest their shares regardless of the quality of the target firm. My data,

however, confirms the significant association between share redemptions and share price

growth which can be applied by investors observing the SPAC market.

 32
This study was undertaken during a period of enormous growth and change for the

SPAC market, leaving significant room for future studies to build from as the SPAC market

continues to mature. Most notably, exploring the effect of the sponsor promote on share

price growth several years from now has the potential for robust and new findings. As

mentioned previously, the sponsor promote was largely uniform across the entire

population, resulting in a positive and insignificant effect in my regression. This is likely

to change, as SPACs continue to saturate the market and compete over the highest potential

firms. Successful SPACs will likely reduce the amount of promote shares awarded to

founders in exchange for higher potential returns post-acquisition. Some SPAC founders

have shown a willingness to adopt this strategy. Hedge fund billionaire, William Ackman,

founded Pershing Square Tontine Holdings (PSTH) and raised capital through an IPO in

July of 2020. Ackman decided to abandon the industry standard and completely removed

the promote from the SPAC structure. As more founders are forced to follow Ackman’s

lead, empirical analysis on the effect of the sponsor promote could be eye-opening.

 The SPAC has dominated headlines throughout 2020 and through the start of 2021;

however, a consensus between commentators is seemingly out of reach. Some argue that

the SPAC boom is a bubble that is sure to come crashing down while others claim SPACs

will never relinquish their crown back to the traditional IPO. Serious question marks

remain about their long-term prospects, but it does not appear like there is an end in sight

to this new era of SPACs. SPACs have seemingly become entrenched in public equity

markets and it is increasingly important for investors to educate themselves. By following

and understanding the above results, investors will maximize their preparedness for

determining which SPACs have the best chance of identifying a profitable target firm.

 33
Bibliography

Cumming, D., Haß, L. H., & Schweizer, D. (2014). The Fast-Track IPO – Success
 Factors for Taking Firms Public with SPACs. Journal of Banking & Finance, 47,
 198-213.

Jenkinson, T., & Sousa, M. (2009). Why SPAC Investors Should Listen to The Market.
 SSRN Electronic Journal. doi:10.2139/ssrn.1341771

Jog, V. M., & Sun, C. (2007). Blank Check IPOs: A Home Run for Management. SSRN
 Electronic Journal. doi:10.2139/ssrn.1018242

Klausner, M. D., & Ohlrogge, M. (2020). A Sober Look at SPACs. SSRN Electronic
 Journal. doi:10.2139/ssrn.3720919

Kolb, J., & Tykvová, T. (2016). Going Public Via Special Purpose Acquisition
 Companies: Frogs Do Not Turn into Princes. Journal of Corporate Finance, 40, 80-
 96. doi:10.1016/j.jcorpfin.2016.07.006

Murray, J. (2017). Innovation, Imitation and Regulation in Finance: The Evolution of
 Special Purpose Acquisition Corporations. Review of Integrative Business &
 Economics Research, 6(2), 1-27.

Rodrigues, U., & Stegemoller, M. A. (2011). Special Purpose Acquisition Corporations:
 A Public View of Private Equity. SSRN Electronic Journal.
 doi:10.2139/ssrn.1948642 6

Roll, R. (1981). A Possible Explanation of the Small Firm Effect. The Journal of
 Finance, 36(4), 879-888. doi:10.1111/j.1540-6261.1981.tb04890.x

 34
Wilson, R. (1968). The Theory of Syndicates. Econometrica, 36(1), 119.
 doi:10.2307/1909607

Yermack, D. (1996). Higher Market Valuation of Companies with a Small Board of
 Directors. Journal of Financial Economics, 40(2), 185-211. doi:10.1016/0304-
 405x(95)00844-5

 35
You can also read


