Conservation Buffer Distance Estimates for Greater Sage-Grouse-A Review
←
→
Page content transcription
If your browser does not render page correctly, please read the page content below
Conservation Buffer Distance Estimates for Greater Sage-
Grouse—A Review
By Daniel J. Manier, Zachary H. Bowen, Matthew L. Brooks, Michael L. Casazza, Peter S. Coates, Patricia A. Deibert,
Steven E. Hanser, and Douglas H. Johnson

Open-File Report 2014–1239

U.S. Department of the Interior
U.S. Geological Survey
U.S. Department of the Interior
SALLY JEWEL, Secretary
U.S. Geological Survey
Suzette M. Kimball, Acting Director
U.S. Geological Survey, Reston, Virginia: 2014
For more information on the USGS—the Federal source for science about the Earth,
its natural and living resources, natural hazards, and the environment—visit
http://www.usgs.gov or call 1–888–ASK–USGS
For an overview of USGS information products, including maps, imagery, and publications,
visit http://www.usgs.gov/pubprod
To order this and other USGS information products, visit http://store.usgs.gov
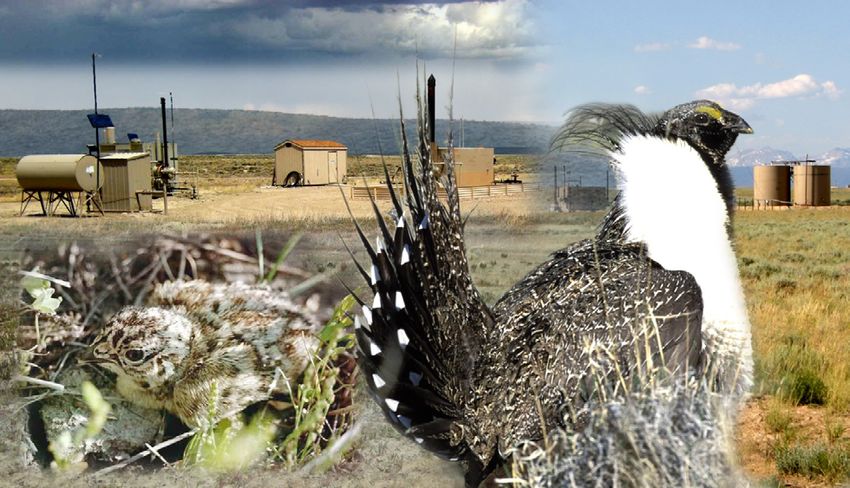
Cover. Photographs clockwise from top left by Cameron Aldridge and Daniel Manier (USGS),
Gary Kramer (USGS), and Cameron Aldridge; graphic design by Mari Kauffman (USGS).
Suggested citation:
Manier, D.J., Bowen, Z.H., Brooks, M.L., Casazza, M.L., Coates, P.S., Deibert, P.A., Hanser, S.E., and Johnson, D.H.,
2014, Conservation buffer distance estimates for Greater Sage-Grouse—A review: U.S. Geological Survey Open-File
Report 2014–1239, 14 p., http://dx.doi.org/10.3133/ofr20141239.
ISSN 2331-1258 (online)
Any use of trade, product, or firm names is for descriptive purposes only and does not imply
endorsement by the U.S. Government.
Although this report is in the public domain, permission must be secured from the individual
copyright owners to reproduce any copyrighted material contained within this report.
iiContents
Introduction .................................................................................................................................................................... 1
Analytical Realities and Additional Background ............................................................................................................. 2
Surface Disturbance ...................................................................................................................................................... 3
Linear Features ............................................................................................................................................................. 5
Energy Development ..................................................................................................................................................... 7
Tall Structures ............................................................................................................................................................... 8
Low Structures............................................................................................................................................................... 9
Activities (Without Habitat Loss) .................................................................................................................................... 9
References Cited ..........................................................................................................................................................10
Table
Table 1. Lek buffer-distance estimates for six categories of anthropogenic land use and activity ......................... 14
iiiConversion Factors
Inch/Pound to SI
Multiply By To obtain
Length
foot (ft) 0.3048 meter (m)
mile (mi) 1.609 kilometer (km)
yard (yd) 0.9144 meter (m)
Area
acre 4,047 square meter (m2)
acre 0.4047 hectare (ha)
acre 0.004047 square kilometer (km2)
section (640 acres or 1 square mile) 259.0 square hectometer (hm2)
square mile (mi2) 259.0 hectare (ha)
2
square mile (mi ) 2.590 square kilometer (km2)
SI to Inch/Pound
Multiply By To obtain
Length
meter (m) 3.281 foot (ft)
kilometer (km) 0.6214 mile (mi)
meter (m) 1.094 yard (yd)
Area
2
square meter (m ) 0.0002471 acre
hectare (ha) 2.471 acre
square kilometer (km2) 247.1 acre
2
square hectometer (hm ) 0.003861 section (640 acres or 1 square mile)
hectare (ha) 0.003861 square mile (mi2)
square kilometer (km2) 0.3861 square mile (mi2)
ivConservation Buffer Distance Estimates for Greater Sage-
Grouse—A Review
By Daniel J. Manier, Zachary H. Bowen, Matthew L. Brooks, Michael L. Casazza, Peter S. Coates, Patricia A.
Deibert, Steven E. Hanser, and Douglas H. Johnson
Introduction based, in conjunction with other considerations
(table 1). We present this information for six
This report was prepared at the request categories of land use or disturbance typically
of the U.S. Department of the Interior and is a found in land-use plans which are representative
compilation and summary of published of the level of definition available in the
scientific studies that evaluate the influence of scientific literature: surface disturbance
anthropogenic activities and infrastructure on (multiple causes; immediate and cumulative
Greater Sage-Grouse (Centrocercus influences); linear features (roads); energy
urophasianus; hereafter, sage-grouse) development (oil, gas, wind, and solar); tall
populations. The purpose of this report is to structures (electrical, communication, and
provide a convenient reference for land meteorological); low structures (fences and
managers and others who are working to buildings); and activities (noise and related
develop biologically relevant and disruptions). Minimum and maximum distances
socioeconomically practical buffer distances for observed effects found in the scientific
around sage-grouse habitats. The framework for literature, as well as a distance range for
this summary includes (1) addressing the possible conservation buffers based on
potential effects of anthropogenic land use and interpretation of multiple sources, expert
disturbances on sage-grouse populations, (2) knowledge of the authors regarding affected
providing ecologically based interpretations of areas, and the distribution of birds around leks
evidence from the scientific literature, and (3) are provided for each of the six categories (table
informing implementation of conservation 1). These interpreted values for buffer distances
buffers around sage-grouse communal breeding are an attempt to balance the extent of protected
locations—known as leks. areas with multiple land-use requirements using
We do not make specific management estimates of the distribution of sage-grouse
recommendations but instead provide habitat. Conservation efforts may then focus on
summarized information, citations, and the overlap between potential effect zone and
interpretation of findings available in scientific important habitats. We provide a brief
literature. We also recognize that because of discussion of some of the most relevant
variation in populations, habitats, development literature for each category. References
patterns, social context, and other factors, for a associated with the minimum and maximum
particular disturbance type, there is no single values in table 1 are identified in the References
distance that is an appropriate buffer for all Cited section with corresponding symbols.
populations and habitats across the sage-grouse Distances in this report reflect radii
range. Thus, we report values for distances upon around lek locations because these locations are
which protective, conservation buffers might be typically (although not universally) known, and
1management plans often refer to these locations. Natural movement behaviors of sage-
Lek sites are most representative of breeding grouse have been documented by multiple
habitats, but their locations are focal points studies that provide direct evidence of inter- and
within populations, and as such, protective intraseasonal movements from a few kilometers
buffers around lek sites can offer a useful (km) (nonmigratory populations; Berry and
solution for identifying and conserving seasonal Eng, 1985; Connelly and others, 2004) to 20–30
habitats required by sage-grouse throughout km or more (Connelly and others, 2004; Fedy
their life cycle. However, knowledge of local and others, 2012; Tack and others, 2012). An
and regional patterns of seasonal habitat use influential, telemetry-based, tracking project in
may improve conservation of those important central Montana indicated more than 90 percent
areas, especially regarding the distribution and of breeding season movements by male grouse
utilization of nonbreeding season habitats were within 1.3 km (0.8 mi) of a lek and 76
(which may be underrepresented in lek-based percent were within 1 km of a lek (0.6 mi;
designations). Wallestad and Schladweiler, 1974). The 1-km
(0.6-mi) buffer used in many management
Analytical Realities and Additional efforts was based upon this research. More
recent analyses have indicated that 90–95
Background percent of habitat use at the population level
Understanding the effects of multiple was focused within approximately 8 km (5
human land uses on sage-grouse and their miles [mi]) of several California and Nevada lek
habitats is complicated by the combination of sites (Coates and others, 2013), and 95 percent
environmental, ecological, and socioeconomic of all nests were located within approximately 5
conditions across the species range, which km (3.1 mi) of leks. Holloran and Anderson
includes parts of 11 U.S. States and 2 Canadian (2005) found that 64 percent of nests in
Provinces in western North America. Responses Wyoming occurred within 5 km (3.1 mi) of
of individual birds and populations, coupled leks, suggesting considerable protection of
with variability in land-use patterns and habitat sage-grouse within these proximate habitats. In
conditions, add variation in research results. contrast, home ranges as large as 2,975 km2
This variability presents a challenge for land (1,149 mi2) have been documented (Connelly
managers and planners seeking to use research and others, 2000, 2004) in some portions of the
results to guide management and plan for sage- species’ range. These larger distances suggest
grouse conservation measures. that for some populations, the minimum
Variability between sage-grouse distance inferred here (5 km [3.1 mi]) from leks
populations and their responses to different may be insufficient to protect nesting and other
types of infrastructure can be substantial across seasonal habitats. Based on the collective
the species’ range. Our interpretations attempt information reviewed for this study,
to encompass variability in populations (for conservation practices that address habitats
example, migratory versus nonmigratory) and falling within the interpreted distances may be
rangewide response patterns of sage-grouse to expected to protect as much as 75 percent
various human activities. Logical and (Doherty and others, 2010) to 95 percent
scientifically justifiable departures from the (Coates and others, 2013) of local population’s
“typical response,” based on local data and habitat utilization.
other factors, may be warranted when Habitat condition, composition,
implementing buffer protections or density structure, and distribution are important
limits in parts of the species’ range. potential modifiers of the effect of human
infrastructure and activities on sage-grouse
2populations (Dinkins and others, 2014; Walters to reduce disturbance to breeding sage-grouse.
and others, 2014). The distribution of sagebrush Although specific details and implementation of
(Artemisia spp.) is a well-known biological and these different approaches have varied, each
statistical predictor of sage-grouse response to approach has the ability (alone or in concert
their environment (for example, Connelly and with others) to protect important habitats,
others, 2004; Aldridge and Boyce, 2007; Hagen sustain populations, and support multiple-use
and others, 2007; National Technical Team, demands for public lands. As such, local and
Sage Grouse, 2011; Wisdom and others, 2011; regional differences in design and
Kirol and others, 2012; Beck and others, 2014; implementation of conservation plans should be
Smith and others, 2014). Differences among assessed with explicit attention to the details
sagebrush communities within a population and cumulative impact of a suite of actions,
range may also affect the impact of including but not limited to the buffer distances,
infrastructure. For example, primary which are the focus of this report.
productivity of sites is typically greater in
mountain big sagebrush (A. tridendata ssp. Surface Disturbance
vaseyana) communities than Wyoming big
sagebrush (A. t. ssp. wyomingensis) Surface disturbance represents a
communities (Davies and Bates, 2010). combination of human activities that alter or
Sage-grouse depend on sagebrush, so remove the natural vegetation community on a
buffer protections may be most effective when site. Isolating the potential effects of human
focused on avoidance of disturbance to land-use patterns on sage-grouse is challenging
sagebrush that provides the keystone to sage- because causal factors are frequently
grouse habitat. Important sage-grouse habitats interrelated and interactive (for example roads
include those with >40 percent sagebrush and distribution lines or roads and well pads)
landcover (within 5 km [3.1 mi] radial making a general discussion of “development
assessment area; Knick and others, 2013), effects” necessary. In cases where better
sagebrush patch sizes greater than 1 km2 (0.4 discrimination is available, those specific types
mi2) (Aldridge and Boyce, 2007), and plot-level of surface disturbances are addressed in the
composition of approximately 10–30 percent following sections. The values in this section
sagebrush cover and >15 percent grasses and reflect a nondiscriminatory understanding of the
forbs (Connelly and others, 2004; Stiver and independent and interactive and cumulative
others, 2006). Avoidance of activities that effects of activities that remove sagebrush cover
increase distance between sagebrush patches or and other natural vegetation, and often include
that impose barriers to dispersal could also help continual and (or) intermittent activities, such as
maintain populations (Wisdom and others, running motors and pumps, vehicle visits, and
2011; Knick and Hanser, 2011). equipment servicing. The collective influence of
Various protection measures have been human activity on the landscape, often referred
developed and implemented, including to as the human footprint (Leu and others,
complete closure of important habitats, distance 2008), has been associated with negative trends
buffers that restrict disturbing activities within in sage-grouse lek counts (Johnson and others,
designated distances, and development- 2011) and population persistence (Aldridge and
disturbance density limits within habitats (for others, 2008; Wisdom and others, 2011). A
examples see, “Policy and Rules for multiscale assessment of factors associated with
Development” at http://utahcbcp.org/htm/tall- lek abandonment between 1965 and 2007 found
structure-info). Timing restrictions have also that the level of the human footprint within 5
commonly been employed at lek sites, primarily km (3.1 mi) of the lek was negatively associated
3with lek persistence (Knick and Hanser, 2011). within this range (for example, Berry and Eng,
Agricultural activities, including tilling, 1985; Lyon and Anderson, 2003; Holloran and
seeding, and other highly managed activities, Anderson, 2005; Walker and others, 2007;
are a component of the human footprint and Aldridge and others, 2008; Knick and others,
clearly fall into the category of surface 2011; Naugle and others, 2011; Coates and
disturbance (removal of native vegetation); others, 2013). Importantly, due to variability
however, agriculture is a special case because, among individuals and populations, some
although agriculture occupies large areas with individuals in most populations (migratory and
transformed conditions, these lands are typically nonmigratory) may move greater distances than
privately owned and the habitat value of those included in the buffer, but specific
agricultural areas is not zero because these lands protections cannot, practically, be determined
can provide cover and forage for some for all individuals and all behavioral patterns.
populations in some seasons (Fischer and Although leks are generally recognized as the
others, 1996). For example, sage-grouse have center of breeding and nesting habitats, recent
been known to use agricultural lands in late utilization distribution analyses have helped to
summer and early spring (Fischer and others, refine understanding of sage-grouse habitat-use
1996). Though we found no direct evidence for patterns throughout the year. Based on this
spacing recommendations between agricultural approach, Coates and others (2013) suggested
lands and leks or other sage-grouse habitat, the that an 8-km (5-mi) protection area centered on
conversion of sagebrush to agriculture within a an active lek location should encompass the
landscape has been shown to lead to decreased seasonal movements and habitat use of 90–95
abundance of sage-grouse in many portions of percent of sage-grouse associated with the lek.
their range (Swenson and others, 1987; Smith Longer distance movements are not always
and others, 2005; Aldridge and Boyce, 2007; explicitly protected in this context, and habitats
Aldridge and others, 2008). A potential associated with previously unidentified leks
mechanism for this decrease in abundances, may not be protected. However, final settling
besides the direct loss of habitat, is the locations for more mobile individuals may be
association of generalist predators (Common associated with quality habitats protected by
Raven [Corvus corax] and Black-billed Magpie buffers around adjacent lek sites. Furthermore,
[Pica hudsonia]) with agricultural infrastructure buffer distances beyond 8 km (5 mi) result in a
(Vander Haegen and others, 2002) and decreasing benefit (cost-benefit trade-off) of
subsequent predation on sage-grouse (Connelly increasing protection in areas that are less
and others, 2004; Coates and Delehanty, 2010). commonly used by sage-grouse. Without
Estimated distance effects were population-specific information regarding the
translated to a 5- to 8-km (3.1- to 5-mi) radius location of habitats and movement of birds,
around each lek to describe a possible which may be utilized when available (for an
conservation buffer area (interpreted range) example see, Colorado Greater Sage-grouse
based on interpretation of two principal factors: Steering Committee, 2008), this generalized
the potential effect area and the potential protection area (circular buffer around active
distribution of habitat use within affected areas. leks with radius of 8 km [5mi]) offers a
The need for protection of populations that are practical tool for determining important habitat
not well understood requires some areas. (Note: the Colorado Plan [Colorado
generalization, and this distance range is Greater Sage-grouse Steering Committee, 2008]
proposed because research suggests that a recommended a 6.4-km [4-mi] circular buffer,
majority of sage-grouse distributions and which may be well suited for those populations
movements (within and between seasons) occur and falls within the range identified here.)
4Importantly, similar results and interpretations Linear Features
to those derived from California and Nevada
populations (Coates and others, 2013) were Roads, especially active roads such as
attained from the eastern portion of sage-grouse collectors, major haul, and service roads, as well
range; namely, Holloran and Anderson (2005) as county, State, and Federal highways, create
reported 64 percent of monitored nests fell many of the same “aversion” factors described
within 5 km (3.1 mi) of a lek, and response to previously that are related to traffic noise on
industrial development (decreased nesting rates roadways and interactions with infrastructure
and success rates) was observable to distances associated with corridors (such as fences, poles,
between 5 and 10 km (3.1–6.2 mi) from a lek and towers). One potential mechanism behind
suggesting that similar buffer distances are as road-aversion behavior by sage-grouse could be
relevant in Wyoming as in the Great Basin. In the intermittent noise produced by passing
Utah, approximately 90 percent of nests (not all traffic. Blickley and others (2012) discovered
movements) were located within 5 km (3 mi) of that noise-disturbance simulations that
a lek and threshold distance increased with mimicked intermittent sources (road noise), or
greater contiguity of habitats. The smallest separately, drilling noises (continuous),
effect distance (3.2 km [2 mi] from a lek) generated a significant reduction in lek
described by Naugle and others (2011) was attendance of sage-grouse (73-percent reduction
previously described and tested in field research with road noise, 29 percent with drilling noise).
by Holloran and Anderson (2005) and Walker Most planning related to linear features
and others (2007); these studies were designed applies to new construction, that is, avoidance
to evaluate the effectiveness of existing of placing new roads or transmission lines in
stipulations. However, recent evaluation of important habitats, but existing roads might also
different effect areas (Gregory and Beck, 2014) be addressed by considering seasonal closures,
suggested significant immediate effects on lek or removal, of roads within protective buffer
attendance with one well pad within 2 km (1.2 areas. Fragmentation of habitats related to the
mi) of a lek and time-lagged effects due to network of roads and other linear features
industrial development within 10 km (6.2 mi) of (potential for cumulative effects) may have
a lek indicating a habitat within the 8 km (5 mi) negative effects on sage-grouse populations by
identified here may still experience an influence reducing and fragmenting sagebrush habitat.
of development on some landscapes. Although When compared to extirpated leks, occupied
considerable protections would be afforded by leks have twice the cover of sagebrush (46
using a greater buffer distance from leks, percent versus 24 percent) and ten times larger
research has indicated population effects are average sagebrush patches (4,173 hectares [ha]
variable, and the cumulative effect of [10,310 acres] versus 481 ha [1,190 acres])
development may extend across the landscape (Wisdom and others, 2011). However, it is
many kilometers (>10 km [6 mi]) beyond the important to recognize that previous
immediately affected areas. Diminishing gain assessments of relations between sage-grouse
analysis (Coates and others, 2013) suggested distributions and roads include a combination of
that sustained gains from habitat protection positive and negative relations (Johnson and
(based on percent of highly used areas protected others, 2011), and local effects may be
versus total area protected) diminished after 8 restricted to visible (or audible) range.
km (5 mi)(radius) from leks, which helped to Correlations between the distribution of roads
establish a ceiling on interpretations for habitat with the distribution of quality sagebrush
buffers seeking to maximize conservation habitats (due to moderate topographic relief),
benefits and minimize impacts on land uses. interactions between influence of roads and
5infrastructure with topography and habitat 5-km (3.1-mi) radius of lek exceeded 30 km
conditions (visibility and audibility), and (18.6 mi). In Great Plains populations (MZ1),
differences in traffic volumes may all contribute lek trends declined within a 10 km (6.2 mi)
to population effects on sage-grouse; not all radius of a major road. It is important to note
roads have the same effect (Carpenter and that many of the regional assessments did not
others, 2010; Dinkins and others, 2014). indicate decreasing lek trends associated with
Because roads and other linear features can the various size-classes of roads that were
have different effects on sage-grouse behavior, assessed (Johnson and others, 2011). In separate
regional models of distributions and population analyses in Wyoming, probability of sage-
dynamics have attempted to capture some grouse habitat use (based on pellet-count
differences; for example, roads closer to lek surveys) declined around major roads (State and
locations and other seasonal habitats may have Federal highways and interstates) when
greater effects than those occurring farther from assessed using a 1-km (0.6-mi) exponential
important habitats (Hanser and others, 2011). decay function (exp(distance /–1km); Hanser and
Effects of pipelines and powerline corridors others, 2011). Assessment of lek trends in
were tested but were not found to have clear, proximity to a large, interstate highway (I-80)
rangewide effects on lek trends (Johnson and indicated that all formerly recorded lek sites
others, 2011). However, it has become evident within 2 km (1.25 mi) of the highway were
that interactions and co-location of linear unoccupied, and leks within 7.5 km (4.7 mi) of
features (for example, power distribution lines the highway had declining attendance (Connelly
along roads and railroads) can make separation and others, 2004).
of effects difficult (Walters and others, 2014); Radio-telemetry (Very High Frequency,
power lines are addressed in a following section VHF) studies are often used to help track and
(Tall Structures). document animal movements and habitat use,
Because of general concerns about and some have reflected affinity of sage-grouse
habitat fragmentation and loss due to to roads (for example, Carpenter and others,
transportation networks, rangewide assessment 2010; Dinkens and others, 2014). However, this
of the effects of distributed human features, pattern may be due to search patterns employed
including road proximity (distance) and density, by road-bound investigators (Fedy and others,
on trends in sage-grouse populations (based on 2014) or the distribution of roads across quality
lek counts), were conducted (Johnson and habitats in flat and lower elevation terrain
others, 2011). Incremental effects of (Carpenter and others, 2010; Dinkins and
accumulating length of roads in proximity to others, 2014) as opposed to selection of roads as
leks were apparent rangewide, although limited preferred habitats. Seasonal, Statewide habitat
to major roads (State and Federal highways and models in Wyoming indicated a difference in
interstates). This effect was demonstrated by seasonal sensitivity to density of paved roads,
decreasing lek counts when there were more suggesting a decaying effects function
than 5 km (3.1 mi) of Federal or State highway approaching zero as distance approaches 3.2 km
within 5 km (3.1 mi) of leks and when more (2 mi) of leks (negative exponential) during the
than 20 km (12.4 mi) of highway occurs within nesting and summer seasons, and a decay
an 18-km (11.2-mi) window (Johnson and function approaching zero as distance
others, 2011). Regional assessments (sage- approaches 1.5 km (0.9 mi) of leks during
grouse management zones, MZs; see Stiver and winter (Fedy and others, 2014). However,
others, 2006) indicated downward trends in Dinkins and others (2014) found decreased risk
northern Great Basin (MZ4 and a portion of of death for hens with increasing road density,
MZ5) populations when road density within but they also noted that the co-location of road
6distribution and quality habitat may have significant negative relation between well
influenced this result. Although noise has been density and probability of sage-grouse habitat
clearly demonstrated to influence sage-grouse selection during nesting (3.2-km [2-mi] radius)
(Blickley and others, 2012), the influence of and winter (6.44-km [4-mi] radius) seasons. In
individual roads or networks of roads on sage- the Powder River Basin, wintering sage-grouse
grouse habitat use and demographic parameters were negatively associated with increasing
remains a research need. This is a good example coalbed natural gas well densities within a 2-km
of the challenge associated with making clear × 2-km (1.24-mi × 1.24-mi) window (Doherty
interpretations of the effect area (and therefore, and others 2008). Also, Gregory and Beck
a definitive buffer distance) for these types of (2014) documented lek attendance decline when
infrastructure. energy development averaged 0.7 well
pads/km2 (1.81 well pads/mi2; using a 10-km ×
Energy Development 10-km [6.2-mi × 6.2-mi] assessment window)
across multiple populations and different
Research and applications addressing development patterns.
surface disturbances in sagebrush ecosystems A key consideration, besides the impacts
have been commonly conducted in relation to of the development footprint on habitat
energy development activities. Lands affected condition and predation potential, is the effect
by these activities have been the focus of many of intermittent noise on behavior (avoidance) as
studies investigating the effects of evident from work by Blickley and others
anthropogenic activities on sage-grouse (2012) who found decreased lek activity due to
behavior and population dynamics, so the mimicked drilling and road noise produced at
previous section (Surface Disturbance) contains close range (volume level equivalent to a road
much of the information relevant here. or well 400 m [1300 ft] away). A precise
Direct impacts of energy development distance for noise effects has not been
on sage-grouse habitats and populations, such as determined, but this value likely varies
loss of sagebrush canopy or nest failure, have depending on the source (equipment, vehicles)
been estimated to occur within a 1.2-ha (3-acre) and the terrain.
area of leks (radius: 62 m [68 yards]); indirect Less information is available about the
influences, such as habitat degradation or effects of renewable energy development, such
utilization displacement, have been estimated to as wind-turbine arrays, on sage-grouse. LeBeau
extend out to 19 km (11.8 mi) from leks and others (2014) monitored effects during
(Naugle and others, 2011). Regional analyses of breeding season (95 nests and 31 broods) and
well-density and distance effects (Johnson and found a linear decline of 7.1 percent in nest
others, 2011) suggested negative trends in failure and 38 percent in brood failure with each
populations (lek counts) when distance was less 1-km (0.6-mi) increase in distance from wind
than 4 km (2.5 mi) to the nearest producing energy infrastructure (less effect with greater
well; whereas density effects were evident distance). Changes in mortality were not
rangewide based on decreasing population attributed to direct collisions but to increased
trends when greater than eight active wells predation. It is notable that one study on prairie
occurred within 5 km (3.1 mi) of leks, or when chickens (a related galliform, Tympanuchus
more than 200 active wells occurred within 18 cupido) found increased nest success rates
km (11 mi)of leks. In Wyoming, significant adjacent to recent wind-energy facilities
negative relations between use of seasonal (Winder and others, 2014).
habitats and well densities have been Suggestions that sage-grouse
demonstrated. Fedy and others (2014) found a instinctively avoid wind turbines (tall
7structures) to avoid predators are debated 1.3 km (0.8 mi) of a lek (76 percent of
because of the difficulty in directly connecting movements occurred within 1 km [0.6 mi]).
predation risk to infrastructure, which often Subsequently, Connelly and others (2000, p.
includes a combination of features (Walters and 977) suggested, "avoid building powerlines and
others, 2014). A further discussion of this topic other tall structures that provide perch sites for
is contained in the Tall Structures section raptors within 3 km of seasonal habitats... lines
below. It is notable that use of wind turbines as should be buried or posts modified to prevent
perches has not been documented. use as perches...” Recent research has added
important information to previous speculations
Tall Structures and estimations, specifying concentrated
foraging behaviors by common ravens (a
It is important to recognize that the common predator of sage-grouse nests) at 2.2
effect of tall structures remains debated, and this km (1.4 mi) from electrical transmission towers
category contains a wide array of infrastructure with the observed foraging area extending out to
including poles that support lights, telephone 11 km (6.8 mi; Coates, and others, 2014a).
and electrical distribution, communication According to estimates, the greatest potential
towers, meteorological towers, and high-tension impact on sage-grouse nests occurs within 570
transmission towers. Determining effects of m (0.35 mi) of structures (Howe and others,
these structures has remained difficult due to 2014). Negative trends in lek counts were
limited research and confounding effects (for associated with increasing number of
example, towers and transmission lines are communication towers within 18km of leks
typically associated with other development range wide (Johnson and others 2011). Johnson
infrastructure; Messmer and others, 2013; and others (2011) also documented negative
Walters and others, 2014). Lacking precise trends in lek counts for Great Plains populations
information regarding the influence of tall within 20 km (12.4 mi) of a power transmission
structures on the foraging behavior of corvids line or when the linear density of powerlines
and raptors, management plans have adopted within 5 km (3.1 mi) of leks was greater than 10
similar buffer distances to other infrastructure, km (6.2 mi)—notably, affected areas may be
for example a 1-km (0.6-mi) buffer of greater in these habitats (compared to other
avoidance around lek sites. The general intermountain communities) because visibility
assumption is that these structures offer is often greater in gentle terrain.
opportunities for increased predator use and Although considerable attention has
thereby generate aversion behaviors among prey been paid to the influence of tall structures
species (that is, sage-grouse); however, other (both anthropogenic and trees) on the quality of
effects, such as electro-magnetic radiation, have sage-grouse habitat (for example, Connelly and
not been eliminated, and effects on predation others, 2000; Connelly and others, 2004; Stiver
rates have not been confirmed (Messmer and and others, 2006; National Technical Team,
others, 2013). Habitat alteration, akin to other Sage-Grouse, 2011; Manier and others, 2013),
linear features (see previous section), may also solid evidence that sage-grouse instinctively
be considered an important component of avoid tall structures to avoid predators remains
interactions between powerline corridors and debated because of the difficulty in connecting
sage-grouse populations. The 1-km (0.6-mi) predation risk to various combinations of
buffer indicated here (table 1) was based upon infrastructure (Walters and others, 2014).
Wallestad and Schladweiler (1974) who However some evidence exists; in Wyoming the
observed that more than 90 percent of breeding risk of death for sage-grouse hens was greater
season movements by male grouse were within near potential raptor perches (Dinkins and
8others, 2014), and in Idaho common raven who stated that only 5 percent of leks were
abundance was greater near energy found within 200 m (656 ft) of a building,
infrastructure (2.2 km [1.4 mi]; Coates and which suggests structures, even without regular
others 2014a,b). Coates and others (2014b) activity and (or) noise, may have produced
found different effects of infrastructure on three aversion behavior in historic sage-grouse
species of raptor (Buteo spp.) and common populations. Recent research provides evidence
ravens, with clear increases in raven abundance that ravens forage at distances as far as 5.1 km
with infrastructure but less consistent results (3.2 mi) from buildings in sagebrush
with raptors. Also, in Wyoming, common raven environments (Coates and others, 2014a)
habitat use was greatest within 3 km (1.8 mi) of suggesting that a wide distribution of
human activity centers, and raven occupancy infrastructure that can supply nesting or resting
was correlated with nest failure (Bui and others, sites for ravens could have negative effects on
2010). These studies suggest a potential sage-grouse populations.
increase in predators of sage-grouse, in
particular ravens, which may influence Activities (Without Habitat Loss)
predation pressure more than raptors.
Tests using recorded noises and wild
Low Structures sage-grouse populations (Blickley and others,
2012) suggest that loud noises transmitted at
Collisions of flying sage-grouse with decibels (70 dB at 0 m; 40 dB at 100 m [328 ft])
fences have been associated with mortality to approximate a noise source 400 m (1300 ft)
(Beck and others, 2006; Stevens and others, from leks caused decreased activity on leks.
2012a,b). Incidents were focused within 1.6–3.2 Though they did not test the range of potential
km (1–2 mi) of leks on flat to rolling terrain and noise volumes or activities (different noises)
fences with wide spacing of poles and (or) less associated with recreation or other
visible ‘t-posts’ (as opposed to wooden posts) (nonindustrial) activities, this research is our
(Stevens and others 2012a,b). Importantly, the best evidence of the effect of noise (independent
effect of fences was apparently less in rougher from infrastructure) on sage-grouse behavior.
terrain, presumably due to differences in flight The upper limit (4.8 km [3 mi]) is the value
behaviors in the birds. Marking fences helps being used by the State of Nevada for reducing
flying grouse avoid these collisions; therefore, noise effects on sage-grouse due to locations of
marking or removal of fences within 2 km (1.2 geothermal energy facilities (Nevada
mi) of leks on flat or rolling terrain can reduce Governor’s Sage-Grouse Conservation Team,
sage-grouse mortality associated with collisions. 2010). Better understanding of the type,
In a review of previous research, including frequency, and volume of noise effects on sage-
theses and reports, Connelly and others (2004, grouse behavior will enhance our ability to
p. 4–2) described findings of Rogers (1964) define effect areas.
9References Cited Coates, P.S. and Delehanty, D.J., 2010, Nest
predation of Greater Sage-Grouse in relation
Symbols in this section refer to citations in Table 1. to microhabitat factors and predators: Journal
of Wildlife Management, v. 74, p. 240–248.
Aldridge, C.L., and Boyce, M.S., 2007, Linking
Coates, P.S., Casazza, M.L., Blomberg, E.J.,
occurrence and fitness to persistence—
Gardner, S.C., Espinosa, S.P., Yee, J.L.,
Habitat-based approach for endangered
Wiechman, L., and Halstead. B.J., 2013,
Greater Sage-Grouse: Ecological
Evaluating Greater Sage-Grouse seasonal
Applications, v. 17, p. 508–526.
space use relative to leks: Implications for
Aldridge, C.L., Nielsen, S.E., Beyer, H.L., surface use designations in sagebrush
Boyce, M.S., Connelly, J.W., Knick, S.T., and ecosystems: Journal of Wildlife Management,
Schroeder, M.A., 2008, Range-wide patterns v. 77, p. 1598–1609.
of Greater Sage-Grouse persistence: Diversity
Coates, P.S., Howe, K.B., Casazza M.L., and
and Distributions, v. 14, p. 983–94.
Delehanty, D.J., 2014a, Common raven
Beck, J.L., Booth, D.T., and Kennedy, C.L., occurrence in relation to energy transmission
2014, Assessing Greater Sage-Grouse line corridors transiting human-altered
breeding habitat with aerial and ground sagebrush steppe: Journal of Arid
imagery: Rangeland Ecology and Environments, v. 111, p.68–78.
Management, v. 67, p. 328–332.
Coates, P.S., Howe, K.B., Casazza, M.L., and
Beck, J.L., Reese, K.P., Connelly, J.W., and Delehanty D.J., 2014b, Landscape alterations
Lucia, M.B., 2006, Movements and survival influence differential habitat use of nesting
of juvenile Greater Sage-Grouse in buteos and ravens within sagebrush
southeastern Idaho: Wildlife Society Bulletin ecosystem: Implications for transmission line
v. 34, p. 1070–1078. development: Condor, v. 116, p. 341–356.
Berry, J.D., and Eng, R.L., 1985, Interseasonal Connelly, J. W., Schroeder, M. A., Sands, A.
movements and fidelity to seasonal use areas R., and Braun, C. E., 2000, Guidelines to
by female sage-grouse: Journal of Wildlife manage sage grouse populations and their
Management, v. 49, p. 237–40. habitats: Wildlife Society Bulletin, v. 28,
‡ Blickley, J.L., Blackwood, D., Patricelli, G.L., p. 967–985.
2012, Experimental evidence for the effects of § Connelly, J. W., Knick, S.T., Schroeder, M.
chronic anthropogenic noise on abundance of A. and Stiver, S. J., 2004, Conservation
greater sage-grouse at leks: Conservation assessment of greater sage-grouse and
Biology, v. 26, p. 461–471. sagebrush habitats: Western Association of
Bui, T.V.D., Marzluff, J.M., Bedrosian, B., Fish and Wildlife Agencies (WAFWA),
2010, Common raven activity in relation to 600 p.
land use in western Wyoming: implications Colorado Greater Sage-grouse Steering
for greater-sage grouse reproductive success: Committee, 2008, Colorado Greater Sage-
Condor, v. 112, p. 65–78. Grouse Conservation Plan. Colorado Division
Carpenter, J., Aldridge, C.L., and Boyce, M.S., of Wildlife, Denver, Colorado, USA.
2010, Sage-grouse habitat selection during Davies, K.W. and Bates, J.D., 2010, Vegetation
winter in Alberta: Journal of Wildlife Characteristics of Mountain and Wyoming
Management, v. 74, p. 1806–1814. Big Sagebrush Plant Communities in the
10Northern Great Basin: Rangeland Ecology Gregory, A.J., and Beck, J.L., 2014, Spatial
and Management, v. 63, p. 461–466. heterogeneity in response of male greater
sage-grouse lek attendance to energy
Dinkins, J.B., Conover, M.R. Kirol, C.P. Beck,
development: PLoS ONE, v. 9, e97132.
J. L. and Frey S.N,. 2014, Greater sage-grouse
hen survival: effects of raptors, anthropogenic Hagen, C.A., Connelly, J.W., Schroeder, M.A.,
and landscape features, and hen behavior: 2007, A meta-analysis of greater sage-grouse
Canadian Journal of Zoology, v. 92, p. 319– Centrocercus urophasianus nesting and brood-
330. rearing habitats: Wildlife Biology, v. 13,
p. 42–50
Doherty, K.E., Naugle, D.E., Walker, B.L., and
Graham J.M., 2008, Greater Sage-Grouse Hanser, S.E., Aldridge, C.L., Leu, M., Rowland,
Winter Habitat Selection and Energy M.M., Nielsen, S.E., and Knick S.T., 2011,
Development: Journal of Wildlife Greater Sage-Grouse: General Use and Roost
Management, v. 72, p. 187–95. Site Occurrence with Pellet Counts as a
Measure of Relative Abundance, p. 112–140
Doherty, K.E., Naugle, D.E., and Walker B.L.,
in S. E. Hanser, M. Leu, S. T. Knick, and C.
2010, Greater Sage-Grouse nesting habitat:
L. Aldridge, eds., Sagebrush ecosystem
the importance of managing at multiple
conservation and management: ecoregional
scales: Journal of Wildlife Management, v.
assessment tools and models for the
74, p. 1544–1553.
Wyoming Basins: Allen Press, Lawrence, KS.
Fedy, B.C., Aldridge, C.L., Doherty, K.E.,
* Holloran, M.J., and Anderson. S.H., 2005,
O'Donnell, M., Beck, J.L., Bedrosian, B.,
Spatial Distribution of Greater Sage-Grouse
Holloran, M.J., Johnson, G. D., Kaczor,
Nests in Relatively Contiguous Sagebrush
N.W., Kirol, C.P., Mandich, C.A., Marshall,
Habitats: Condor, v. 107, p. 742–52.
D., McKee, G., Olson, C., Swanson, C.C. and
Walker, B.L., 2012, Interseasonal Movements ° Howe, K.B., Coates, P.S., and Delehanty, D.J.,
of Greater Sage-Grouse, Migratory Behavior, 2014, Selection of anthropogenic features and
and an Assessment of the Core Regions vegetation characteristics by nesting Common
Concept in Wyoming: Journal of Wildlife Ravens in the sagebrush ecosystem: Condor,
Management, v. 76, p. 1062–1071. v. 116, p. 25–49.
Fedy, B.C., Doherty, K.E., Aldridge, C.L., ◊ Johnson, D. H., Holloran, M. J. Connelly, J.
O’Donnell, M., Beck, J.L., Bedrosian, B., W. Hanser, S. E. Amundson, C. L. andKnick
Gummer, D., Holloran, M.J., Johnson, G.D., S. T., 2011, Influences of Environmental and
Kaczor, N.W., Kirol, C.P., Mandich, D.A., Anthropogenic Features on Greater Sage-
Marshall, D., McKee, G., Olson, C., Pratt, Grouse Populations, 1997–2007, Chapter 17
A.C., Swanson, C.C.,Walker, B.L., 2014, In S. T. Knick and J. W. Connelly, eds.,
Habitat prioritization across large landscapes, Greater Sage-Grouse: Ecology of a Landscape
multiple seasons, and novel areas: An Species and Its Habitats, Studies in Avian
example using Greater Sage-Grouse in Biology No. 38: University of California
Wyoming: Wildlife Monographs, v. 190, Press: Berkeley, CA, p. 407–450.
p. 1–39.
Kirol, C.P., Beck, J.L., Dinkins, J.B., and
Fischer, R.A., Reese, K.P., and Connelly, J.W., Conover, M.R., 2012, Microhabitat selection
1996, Influence of vegetal moisture content for nesting and brood-rearing by the Greater
and nest fate on timing of female sage grouse Sage-Grouse in xeric big sagebrush: Condor,
migration: Condor, v. 98, p.868–872. v. 114, p.75–89.
11Knick, S.T., 2011, Historical development, Nest Initiation and Movement. Wildlife
principal federal legislation, and current Society Bulletin, v. 31, p. 486–91.
management of sagebrush habitats: Manier, D.J., Wood, D.J.A., Bowen, Z.H.,
implications for conservation. in S. T. Knick Donovan, R.M., Holloran, M.J., Juliusson,
and J. W. Connelly, eds. Greater Sage- L.M., Mayne, K.S., Oyler-McCance, S.J.,
Grouse: ecology and conservation of a Quamen, F.R., Saher, D.J., and Titolo, A.J.,
landscape species and its habitats. Studies in 2013, Summary of science, activities,
Avian Biology No. 38, University of programs, and policies that influence the
California Press, Berkeley, CA. p. 13–31. rangewide conservation of Greater Sage-
Knick, S.T., and Hanser, S.E., 2011, Connecting Grouse (Centrocercus urophasianus): U.S.
pattern and process in Greater Sage-Grouse Geological Survey Open–File Report 2013–
populations and sagebrush landscapes, in S. 1098, 331 p.
T. Knick and J. W. Connelly, eds., Greater Messmer, T.A., Hasenyager, R. Burruss, J. and
Sage-Grouse: ecology and conservation of a Liguori S., 2013, Stakeholder contemporary
landscape species and its habitats. Studies in knowledge needs regarding the potential
Avian Biology No. 38: University of effects of tall structures on sage-grouse.
California Press, Berkeley, CA. p. 383–405. Human-Wildlife Interactions, v. 7, p. 273–
Knick, S.T., Hanser, S.E., and Preston, K.L,. 298.
2013, Modeling ecological minimum National Technical Team, Sage-Grouse, 2011,
requirements for distribution of greater sage- A report on national Greater Sage-Grouse
grouse leks: implications for population conservation measures. Bureau of Land
connectivity across their western range, Management: Technical Report. Washington,
U.S.A.: Ecology and Evolution, v. 3, D.C. and Denver, Colorado. 74p.
p.1539–1551.
ǂ Naugle, D. E., Doherty, K.E. Walker, B.L.
Knick, S.T., Hanser, S.E. Miller, R.F., Pyke, Holloran, M.J. and Copeland H.E., 2011,
D.A., Wisdom, M.J., Finn, S. P., Rinkes, E.T. Energy Development and Greater Sage-
and Henny C.J., 2011, Ecological Influence Grouse. In Greater Sage-Grouse: Ecology of a
and Pathways of Land Use in Sagebrush, In S. Landscape Species and Its Habitats, edited by
T. Knick and J. W. Connelly, eds., Greater S.T. Knick and Connelly J.W. Studies in
Sage-Grouse: Ecology of a Landscape Avian Biology No. 38, University of
Species and Its Habitats, Studies in Avian California Press: Berkeley, CA, p. 489–504.
Biology No.38: University of California
Press: Berkeley, CA, p. 203–252. ψ Nevada Governor’s Sage-Grouse
Conservation Team, 2010, Nevada energy and
LeBeau, C.W., Beck, J.L., Johnson G.D. and infrastructure development standards to
Holloran, M.J., 2014, Short-term impacts of conserve Greater Sage-Grouse populations
wind energy development on Greater Sage- and their habitats. State of Nevada, Reno,
Grouse fitness: Journal of Wildlife 58 p.
Management, v. 78, p. 522–530.
Rogers, G.E., 1964, Sage-grouse investigations
Leu, M., Hanser, S.E., and Knick S.T., 2008,
in Colorado. Colorado Game and Fish
The human footprint in the West: a large-
Department, Technical Publication No. 16,
scale analysis of anthropogenic impacts,
Fort Collins, Colo.
Ecological Applications, v. 18, p. 119–1139.
Smith, J.T., Flake, L.D., Higgins, K F.,
Lyon, A.G., and Anderson S.H,. 2003, Potential
Kobriger, G.D., and Homer C.G., 2005,
Gas Development Impacts on Sage Grouse
12Evaluating lek occupancy of Greater Sage- Vander Haegen, W.M., Schroeder M.A. and
Grouse in relation to landscape cultivation in DeGraaf R.M.. 2002. Predation on real and
the Dakotas: Western North American artificial nests in shrub steppe landscapes
Naturalist, v. 65, p. 310–320. fragmented by agriculture: Condor, v. 104,
p. 496–506.
Smith, K.T., Kirol, C.P., Beck, J.L, .and
Blomquist, F.C., 2014, Prioritizing winter * Walker, B. L., Naugle, D. E. and Doherty K.
habitat quality for greater sage-grouse in a E.. 2007. Greater Sage-Grouse population
landscape influenced by energy development: response to energy development and habitat
Ecosphere, vol. 5, article 15 loss: Journal of Wildlife Management, v. 71,
p. 2644–2654.
Stevens, B.S., Reese, K.P. Connelly, J.W., and
Musil D.D., 2012a, Greater sage-grouse and Wallestad, R. O., and Schladweiler, P, 1974.
fences: Does marking reduce collisions? Breeding season movements and habitat
Wildlife Society Bulletin, v. 36, p. 297–303. selection of male sage grouse: Journal of
Wildlife Management, v.38, p. 634–637.
« Stevens, B.S., Connelly, J.W. and Reese K.P.,
2012b, Multi-scale assessment of greater Walters, K., Kosciuch K., and Jones, J., 2014,
sage-grouse fence collision as a function of Can the effect of tall structures on birds be
site and broad scale factors.: Journal of isolated from other aspects of development:
Wildlife Management, v. 76, p. 1370–1380. Wildlife Society Bulletin, vol. 38, p. 250–256.
Stiver, S.J., Apa, A.D., Bohne, J.R., Bunnell, Winder, V.L., McNew, L.B., Gregory, A.J.,
S.D., Deibert, P.A., Gardner, S.C., Hilliard, Hunt, L.M., Wisely, S.M., and Sandercock,
M.A., McCarthy C.W., and Schroeder M.A., B.K., 2014, Effects of wind energy
2006, Greater Sage-grouse Comprehensive development on survival of female greater
Conservation Strategy. Western Association prairie- chickens: Journal of Applied Ecology,
of Fish and Wildlife Agencies. WAFWA v. 51, p. 395–405.
Report, Cheyenne, Wyoming. Available Wisdom, M. J., Meinke, C. W. Knick, S. T. and
online: Schroeder, M. A., 2011, Factors associated
http://www.wafwa.org/documents/pdf/Greater with extirpation of sage-grouse. In Knick, S.
Sage-grouseConservationStrategy2006.pdf T. and Connelly, J. W., eds. Greater Sage-
Swenson, J. E., Simmons, C.A. and Eustace Grouse: ecology of a landscape species and its
C.D., 1987, Decrease of Sage Grouse habitats. Studies in Avian Biology No. 38,
Centrocercus urophasianus after ploughing University of California Press: Berkeley,
of sagebrush steppe: Biological Conservation, California, p. 451–472.
v. 41, p. 125–132.
Tack, J.D., Naugle D.E., Carlson J.C. and
Fargey P.J., 2012,. Greater sage-grouse
(Centrocercus urophasianus) migration links
the USA and Canada: a biological basis for
international prairie conservation: Oryx, vol. ISSN 2331-1258 (online)
46, p. 64–68. http://dx.doi.org/10.3133/ofr20141239
13Table 1. Lek buffer-distance estimates for six categories of anthropogenic land use and activity. Literature
minimum and maximum values are distances for observed effects found in the scientific literature. Interpreted
ranges indicate potential conservation buffer distances based on multiple sources. [Citations for literature minimum
and maximum values are denoted using corresponding symbols in the References Cited section.]
Category Literature minimum Interpreted range (lower) Interpreted range (upper) Literature maximum
Surface disturbance 3.2km (2mi) * 5km (3.1mi) 8km (5mi) 20km (12.4mi) ◊
‡
Linear features 400m (0.25mi) 5km (3.1mi) 8km (5mi) 18km (11.2mi) ◊
Energy development 3.2km (2mi) ǂ 5km (3.1mi) 8km (5mi) 20km (12.4mi) ◊
Tall structures 1km (0.6mi) ° 3.3km (2mi) 8km (5mi) 18km (11.2mi) ◊
Low structures 200 m (0.12 mi) § 2 km (1.2mi) 5.1 km (3.2mi) 5.1 km (3.2mi) «
Activities 400 m (0.25 mi) ‡ 400 m (0.25 mi) 4.8 km (3mi) 4.8 km (3mi) ψ
14You can also read