Corporate Overview November 2019

Page created by Harold Holland
 
CONTINUE READING
Corporate Overview November 2019
Corporate
Overview
November 2019
Corporate Overview November 2019
CAUTIONARY NOTE
Forward Looking Statements
>   This presentation is confidential and is being issued for informational purposes only, is not intended to provide the basis for any credit or other evaluation and does not form part of any offer or
    invitation to sell or issue any securities or any solicitation of any offer to purchase or subscribe for any securities. This presentation, in whole or in part, shall not form the basis for any contract or
    investment decision with respect to Westport Fuel Systems and should not be relied on in connection with any such contract or decision. No reliance should be placed on the accuracy or
    completeness of the information contained in this presentation. Westport Fuel Systems has not independently verified any data from third party sources referred to in this presentation.

>   This presentation contains forward-looking statements, including statements regarding Westport Fuel Systems’ business, revenue, liquidity and cash usage expectations, future of our development
    programs, future sales of products and gross margin, the demand for and future availability of our products, the growth rate for various business segments, the costs of various competing
    technologies, the future success of our business and technology strategies, social and regulatory environments, the performance and competitiveness of Westport Fuel Systems products and
    expansion of product coverage and future market opportunities. These statements are neither promises nor guarantees, but involve known and unknown risks and uncertainties and are based on
    both the views of management and assumptions that may cause our actual results, levels of activity, performance or achievements to be materially different from any future results, levels of activities,
    performance or achievements expressed in or implied by these forward looking statements. These risks and uncertainties include risks and are based on certain assumptions related to our revenue
    growth, operating results, costs and recoveries of ongoing regulatory investigations, industry and products, the general economy, conditions of and access to the capital and debt markets,
    governmental policies, regulation and approvals, technology innovations, fluctuations in foreign exchange rates, operating expenses, the availability and price of natural gas, global government
    stimulus packages, the acceptance of and shift to natural gas vehicles, the relaxation or waiver of fuel emission standards, the inability of fleets to access capital or government funding to purchase
    natural gas vehicles, the development of competing technologies, our ability to adequately develop and deploy our technology, the actions and determinations of our joint venture and development
    partners, as well as other risk factors and assumptions that may affect our actual results, performance or achievements or financial position discussed in Westport Fuel Systems most recent Annual
    Information Form and Annual Report on Form 40-F for the year ended December 31, 2018 and other filings made by Westport Fuel Systems with securities regulators. Readers should not place
    undue reliance on any such forward-looking statements, which speak only as of the date they were made. We disclaim any obligation to publicly update or revise such statements to reflect any
    change in our expectations or in events, conditions or circumstances on which any such statements may be based, or that may affect the likelihood that actual results will differ from those set forth in
    these forward looking statements except as required by National Instrument 51-102. The contents of any website, RSS feed or twitter account referenced in this presentation are not incorporated by
    reference herein.

>   This communication is not intended to and does not constitute an advertisement, an offer to sell or the solicitation of an offer to subscribe for or buy or an invitation to purchase or subscribe for any
    securities or the solicitation of any vote in any jurisdiction pursuant to the proposed transactions or otherwise, nor shall there be any sale, issuance or transfer of securities in any jurisdiction in
    contravention of applicable law. No offer of securities shall be made except by means of a prospectus meeting the requirements of Section 10 of the United States Securities Act of 1933, as
    amended. Subject to certain exceptions to be approved by the relevant regulators or certain facts to be ascertained, no public offer will be made directly or indirectly, in or into any jurisdiction where
    to do so would constitute a violation of the laws of such jurisdiction, or by use of the mail or by any means or instrumentality (including without limitation, facsimile transmission, telephone and the
    internet) of interstate or foreign commerce, or any facility of a national securities exchange, of any such jurisdiction. No securities commission or similar authority of the United States, Canada, or any
    other jurisdiction has reviewed or in any way passed upon this document or the merits of the securities described herein, and any representation to the contrary is an offense.

                                                                                                                                                                                                             PAGE 2
Corporate Overview November 2019
WESTPORT FUEL SYSTEMS
                                                         Overview                                                              Sales by Region (2018)

                 $270M                                  > Leading global supplier of clean, affordable
                   2018                                      alternative fuel systems for automotive applications
                  Revenue
                                                        > Four business segments:                                                                     18%
                                                                                                                                     62%
  750+                              12                           > Aftermarket systems
  Patents /                        Offices                                                              Growing, profitable,                         10%
 Applications                         &                          > Light duty OEM                       strong market share
                                  Facilities                                                                                                        10%
                                                                 > Heavy duty OEM                - Game-changing technology
                                                                                                                                Europe   Americas   Asia    Other
                   1250                                          > Cummins Westport Inc.
    70                                                                                                                         Key Priorities
                 Employees
                                    10                  > Strongly positioned to capitalize on the shift away
 Countries                       Established                 from traditional transportation fuels toward clean                1. Sustained growth of
 customers                         brands                    transportation                                                       aftermarket and light duty
   served
                                                                                                                                  OEM businesses
                                                        > Steady progress on attaining positive earnings
                ~$375M                                                                                                         2. Accelerate HPDI 2.0
                  Market                                                                                                          commercialization
                Capitalization                           Listings
                                                                                                                               3. Continue to improve cash
                                                         > NASDAQ and TSX: WPRT                                                   flow and operating results

                                    Note: Approximate number of employees and products as of December 31, 2018;
                                     worldwide granted patents and pending applications for Westport Fuel Systems                                          PAGE 3
                                      companies as of June 5, 2018. Market capitalization as of November 8, 2019
Corporate Overview November 2019
WESTPORT’S ALTERNATIVE FUEL CAPABILITIES
Broad Range of Products that Deliver Emission Reductions

LPG                                CNG                                LNG                           H2

Liquefied Petroleum                Compressed                          Liquefied                    Hydrogen
Gas / Propane /                    Natural Gas                         Natural Gas
Autogas / BioLPG

> Components and complete          > Components and                    > Complete systems           > High and low pressure
   systems                            complete systems                                                 components
                                                                       > Heavy-duty and high
> Light-duty applications –        > Light- and medium-duty               horsepower applications   > Light- to heavy-duty and
   vapor and liquid LPG               applications                                                     industrial applications
                                                                       > Monofuel and dual fuel
> Monofuel, bi-fuel, dual fuel     > Monofuel, bi-fuel, dual              solutions                 > Hydrogen/CNG blends or
   solutions                          fuel solutions                                                   pure hydrogen
> The most commonly used
   alternative fuel in the world

                                                            Renewable Fuels
                                                     Substitute for fossil based fuels

                                                                                                                                 PAGE 4
Corporate Overview November 2019
WE DESIGN, DEVELOP AND MANUFACTURE
ALTERNATIVE FUEL COMPONENTS AND SYSTEMS
 Fuel Tank Systems              Valves                  Regulators              Injectors                Electronics

                                        CNG
                                        Tank                     CNG
                                        Valves                   Pressure
                                                                 Regulators      Natural Gas
 Type 1 CNG Tank System                                                          Injectors

                                                                                                                  CNG
                           CNG                                                                                    Electronic
                           Fill                                                          Injector                 Control
                                                      LPG
                           Valves                                                        Rails                    Modules
                                                      Pressure
                                                      Reducers
  LPG Level Sensor
                                        Solenoid
                                        Cylinder
                                        Valves
            HPDI LNG                                             HPDI
            Pump                                                 Gas
                                                                 Conditioning
                          Integrated                             Module                             Bi-Fuel
                          Tank Valve
                                                                                                    Electronic
                          Regulator
                                                                                                    Control
                                                                                                    Modules
                                                                                        HPDI
                                                                                        Injector
                                                   H2 Pressure
                                       H2 Tank     Control
                                       Valves      Modules
 HPDI LNG Tank Module

                                                                                                                         PAGE 5
Corporate Overview November 2019
NATURAL GAS AND LPG VEHICLES IN SERVICE
 Natural Gas Vehicles in Service                                               LPG Vehicles in Service
                    (in thousands)                                                          (in thousands)
              Africa, 268         North America, 225                                  Japan,    China, 240
                                                                        Mexico, 350                              USA, 210
                                                                                       340
                                                                 Australia, 700
               Europe,                            Total:                                                                        Total:
                2,014                             27.8 million                Thailand,
                                                                                                                                27.1 million
                                                                                                                 Turkey,
                                                                                1,600
                                                                                                                  6,100
                                                                                                                                               • Natural gas and LPG
  Latin
                                                                                                                                                 vehicles are in wide use
                                                                       Ukraine,
 America,                                                               2,400                                                                    in many countries
  5,417                                                                                                                                          around the world.
                                                                                                                                               • About 55 million
                                                                    Italy, 3,000
                                                                                                                                                 natural gas and LPG
                                                                                                                         Russia,                 vehicles are currently in
                                       Asia-                                                                              4,500
                                      Pacific,                                                                                                   service, with about 1.5
                                      19,842                                                                                                     million new vehicles or
                                                                          Korea, 3,500
                                                                                                                                                 vehicle conversions sold
                                                                                                    Poland,                                      annually.
                                                                                                     4,200

   Source: NGV Global July 2019                                          Source: World LPG Association 2018 Annual Report, Westport analysis

                                                                                                                                                                  PAGE 6
Corporate Overview November 2019
SAVING MONEY WITH LPG & CNG VEHICLES

       Fuel Type                                     Petrol                 LPG            CNG

       Incremental Price per Vehicle                                     € 1,000          € 1,500
                                                                                                    The actual payback period is
                                                                                                    dependent upon vehicle
       Fuel Cost (€/ltr or kg)                        €1.50                € 0.65         € 0.95*   transaction prices, annual
                                                                                                    distance traveled, fuel prices
                                                                                                    and the impact of taxes and
       Annual Distance (km)                         20,000               20,000           20,000    incentives.

                                                                                                    All of these factors vary over
       Fuel Consumption (km/ltr or kg)**                12                   11             21      time and between jurisdictions.

       Annual Fuel Cost                             € 2,500              € 1,200          € 900

                                 Annual Fuel Cost Savings                € 1,300          € 1,600

                                 Payback Period (months)                     9              11

                                            FOR ILLUSTRATIVE PURPOSES ONLY
                                          Note: Payback period improves with incentives
                                                                                                                                     PAGE 7
                                                   * Euro 0.95/kg = 0.684/m3
                                                    ** Average European car
Corporate Overview November 2019
TRANSPORTATION FUEL PRICES
                                                                                                                             Sources:
                                                                                   Average US energy prices for vehicles     US DOE Alternative Fuel Data Center,
                     Current Diesel and NG Prices        (US $/gallon or DGE)
                                                                                   $ per diesel gallon equivalent            US EIA, Westport analysis
    $7.00
                                                                                   $5.00
                                                                                   $4.50
    $6.00
                                                                                   $4.00
                                                                                   $3.50
    $5.00
                                                                                   $3.00
                                                                                   $2.50                                                               CNG
    $4.00
                                                                                   $2.00                                                               Diesel
                                                                                   $1.50
    $3.00
                                                                                   $1.00
                                                                                   $0.50
    $2.00
                                                                                   $0.00

                                                                                            2001
                                                                                            2002
                                                                                            2003
                                                                                            2004
                                                                                            2005
                                                                                            2006
                                                                                            2007
                                                                                            2008
                                                                                            2009
                                                                                            2010
                                                                                            2011
                                                                                            2012
                                                                                            2013
                                                                                            2014
                                                                                            2015
                                                                                            2016
                                                                                            2017
                                                                                            2018
                                                                                            2019
    $1.00

    $0.00                                                                                   In the US
                    US           Germany        France       UK            Italy              • Natural gas prices have been relatively stable
                                           Diesel   NG                                        • Diesel prices have fluctuated, a lot
                                                                                              • Diesel price dropped to be on par with natural
Sources:
globalpetrolprices.com Nov 8, 2019
                                     In Europe                                                  gas from 2015 through 2017
cngeurope.com Nov 2019                 • Sustained high prices for fuel
US EIA Nov 2019
                                       • Sustained price advantage for natural gas

                                                                                                                                                       PAGE 8
Corporate Overview November 2019
Source: European Automobile Manufacturers Association (ACEA),
NEW VEHICLES BY FUEL TYPE IN EUROPE                                                                     Power Systems Research

                  Vehicle Sales in Millions             Passenger Car Sales by Fuel                     Commercial Vehicle Sales by Fuel
             20                                  100%                                                100%

             18                                  90%                                                   90%

             16                                  80%                                                   80%
                                                           44%    47%
             14                                  70%                     50%                           70%
                                                                                 57%
             12                                  60%                                   NG/LPG          60%
Commercial
Vehicle                                                                                PHEV/BEV
             10                                  50%                                                   50%       98.9%       98.7%       98.5%      98.2%
                                                                                       Hybrid
Passenger                                                                              Petrol
Car           8                                  40%                                                   40%
                                                                                       Diesel

              6                                  30%                                                   30%
                                                           52%    49%
                                                                         44%
              4                                  20%                                                   20%
                                                                                 36%

              2                                  10%                                                   10%

              0                                   0%                                                    0%
                    2015   2016   2017    2018            2015    2016   2017   2018                              2015        2016       2017        2018

                                                                                                                                                       PAGE 9
Corporate Overview November 2019
EUROPEAN LIGHT DUTY OEM MARKET OVERVIEW
Key driver: Emissions standards – EU Light Duty vehicles CO2 regulations summary

 EU introduced stringent regulations for passenger cars and
                                                                                           Path to achieve the 2021 target of 95 g/km is
 vans requiring roughly -33% reduction in CO2 emissions in
 2025 and -50% in 2030 compared to 2018                                                    disrupted by:
                                                                                               • Loss of diesel
                                                                                               • Growth of petrol
                                                                                               • Growth of SUVs
                                                                                           CO2 Emissions are on the rise

                                                                                           Penalties are set at €95 for each g/km above the
                                                                                           target from 2025. If the industry as a whole misses
                                                           NEW!
                                                                                           the passenger car target by 20 g/km, this would
                                                                                           result in average penalties of €1900 per vehicle

                 https://www.theicct.org/sites/default/files/publications/EU-LCV-CO2-2030_ICCTupdate_20190123.pdf
                 *https://www.eea.europa.eu/highlights/average-co2-emissions-from-new.

                                                                                                                                           PAGE 10
Global market size and market
LIGHT DUTY OEM SYSTEMS                                                                   shares are WFS estimates

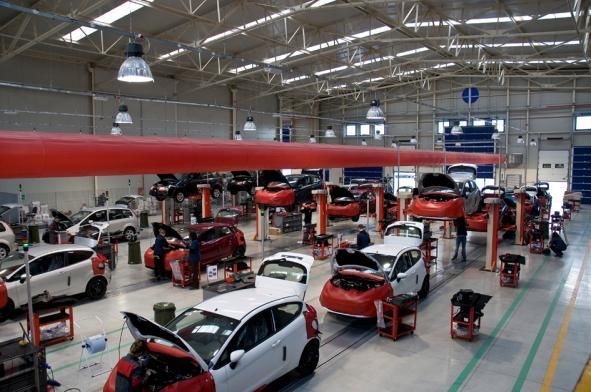
Global OEM LPG/CNG Light Duty Vehicles                                 Brescia Italy Plant

• Global sales: ~500,000 units/year
• WFS ~30% share
• 70% CNG / 29% LPG / 1% H2

     4%              Europe
  14%
                     India

15%           51%    China
                                    IATF 16949:2016   ISO 14001:2014   • High level of automation
                                                                       • Poka-Yoke systems
                                        Robust processes,
                     Middle East                                       • A complete OEM design validation plan
                                       risk prevention and
  16%                                                                  • Safety reliability
                                      environmental controls
                     Other                                             • State-of-the-art technical cleanliness control

Customer Portfolio

                                                                                                                          PAGE 11
Global market size and market
INDEPENDENT AFTERMARKET (IAM)                                                            shares are WFS estimates

Aftermarket Kits and Components                                  Delayed OEM Services
• Global LPG/CNG conversion kits: ~1 million units/year          • Global DOEM installations: ~35,000 units/year
• WFS ~30% global share: 300,000 kits annually                   • WFS ~95% share
• 60% LPG / 40% CNG                                              • Key markets: Italy, Turkey, USA

                                                                                                         DOEM Customers
         5%           Europe & Middle
                      East
25%                   Americas
               50%
                      Asia Pacific

    20%               Other

Key Market    Share      Fuel           WFS Aftermarket Brands
Argentina     50%     CNG                                             WFS capabilities:
Italy         40%     LPG & CNG                                       • Application development
Poland        30%     LPG                                             • Certification
Russia        30%     LPG                                             • Product validation
Turkey        30%     LPG                                             • Vehicle conversion
                                                                      • Logistics solutions

                                                                                                                         PAGE 12
FULLY INTEGRATED WESTPORT HPDI 2.0™ HD TRUCK SOLUTION
HIGH CONTENT AND SIGNIFICANT WESTPORT FUEL SYSTEMS IP

On Engine                                      On Chassis                                 On LNG Tank

   High Pressure                                                        Tank Selection     Gas Temperature
   Direct Injector                                                     Control Manifold        Sensor
                                    Gas Rail
                                                                                                             LNG Pump
                                                                                                             Control Manifold

                                                                                                                        LNG Tank
OEM Engine
                                                                                                                         Module

                        Gas
                     Conditioning
                       Module
                                                                                                                        Cryogenic High
                       (GCM)
                                                                        HPDI Control                                    Pressure Pump
                                               Integrated Gas Module                              Fuel Level Signal
                                                                         Software
                                                                                                    CANditioner

                                                                                                                                PAGE 13
BENEFITS OF WESTPORT HPDI 2.0™

                  > Same torque as diesel engine
                  > Same efficiency as diesel engine
                  > Lower emissions than diesel engine
                     ▪ 20% CO2 reduction
                     ▪ >100% CO2 reduction potential
                  > No change to engine architecture
                  > Minimal change to vehicle architecture

                  Compared to spark ignited natural gas engines:
                  > Higher torque, more efficient, less CO2

                                                                   PAGE 14
*Assuming recognition of 20% carbon intensity reduction
CO2 REDUCTION OPPORTUNITY                                                          with 20% renewable gas blend and 90% gas energy ratio

                                                                                   ** Varies by vehicle class and application
With HPDI    2.0TM   Technology

CO2 reduction legislation driving                                  • Westport HPDI 2.0 provides 20%+ CO2 reduction.
new technologies in HD trucking                                       • Meets or exceeds 2025/2030 EU requirement.

Europe:
 From 2019 baseline,
                                                                   • Penalty for non-compliance in EU is €4,250 per
 -15% CO2 required by 2025
                                                                     gram/ton-km starting in 2025.
 -30% CO2 required by 2030
                                                                      • Penalty up to €38,000 per truck.
US:
 Up to 25%** CO2 reduction
 from 2017 through 2027                                            • Only technology available today that meets the
                                         Westport HPDI   2.0TM       EU 2025 regulation.

                                                   20% Renewable
                                    Fossil LNG
                                                       LNG
                                                                   • Preserves substantial OEM investments.

                                    -20%            -34%*
                                                                                                                                    PAGE 15
HPDI / LNG OEM HEAVY-DUTY VEHICLE PAYBACK ANALYSIS

         Fuel Type                                Diesel                  HPDI / LNG

         Incremental Price per Vehicle                                        €40,000

                                                                                         The actual payback period is
         Fuel Cost (€/ltr or kg)                   €1.36                       € 0.95*   dependent upon vehicle
                                                                                         transaction prices, annual
                                                                                         distance traveled, fuel prices
         Annual Distance (km)                    120,000                      120,000    and the impact of taxes and
                                                                                         incentives.
         Fuel Consumption (km/ltr or kg)            3.3                            4.8   All of these factors can vary over
                                                                                         time and between jurisdictions.
         Annual Fuel Cost                        € 49,000                     € 23,900

                                   Annual Fuel Cost Savings                   € 25,100

                                   Payback Period (months)                         19

                                               FOR ILLUSTRATIVE PURPOSES ONLY
                                                                                                                              PAGE 16
                                                  * Euro 0.95/kg = 0.684 Euro/m3
FUELS AND TECHNOLOGIES COMPETING                                                         Information based on latest
                                                                                         estimates from multiple
                                                                                         industry sources and may vary
FOR THE TRANSPORTATION FUTURE
  Heavy Duty Truck, 400 mile daily range, current costs and technologies:
                        Fuel             Fuel +         Propulsion          Daily                  Daily
    Fuel System        Storage          Storage          System            Fueling                 Fuel
                         Size           Weight             Cost             Time                   Cost
                        (cubic feet)     (pounds)        (approximate)      (minutes)          (US West Coast)

  Diesel                    11            560            $42,000              10                   $185
  SI NG                     55           1,125           $72,000              15                   $165
  HPDI                      32           1,270           $82,000              10                   $135
  H2 Fuel Cell              60           1,500           $150,000             20                   $285
                                                                          80 (@ 700kW)
  Battery Electric        160           17,800           $310,000                                  $115
                                                                         480 (@ 120kW)

              There has been considerable interest and hype around battery electric and
              fuel cell technologies but in many applications, particularly those that require
              extended range, these technologies are not yet economically viable

                                                                                                                         PAGE 17
HPDI 2.0™ - COMMERCIALLY ATTRACTIVE & AVAILABLE NOW

                                                             Westport   Battery
     For Long Haul HD Truck Application           Diesel
                                                            HPDI 2.0™   Electric

     Meet EU 2025/2030 requirements?               X          ✓           ✓
     Meet customer requirements?
     • Range, payload, performance, durability
     • Operations, refuel/recharge time
                                                   ✓          ✓           X
     Infrastructure in place?                      ✓          ✓           X
     Commercially available and viable?            ✓          ✓           X
     Total Cost of Operation                     Baseline   Lower       Higher

                                                                                   PAGE 18
THE PROMISE OF RENEWABLE NATURAL GAS
                                                                                  Renewable Natural Gas (RNG) use has grown by 55% annually in the
  Natural gas vehicles operating on captured                                      US and in 2018 accounted for almost 1/3 of US on-road NGV fuel use
  methane can provide negative CO2 emissions,                                                         United States RNG Growth
  making them cleaner than electric vehicles.                                                           (Diesel Gallon Equivalents)
                                                                                               200                                                           RNG

                                                                                    Millions
                                                                                                                                                               ,
   Lifecycle Carbon Intensity of Petroleum and Alternative Fuels                               150                                                           32%
   CO2 equivalent per megajoule                                                                100
                                                                                                                                               CNG
                            Diesel                                        102.0                50                                                ,
                                                                                                                                               68%
                         Gasoline                                       99.8                     0
                      Fossil CNG                                       79.4                          2014   2015   2016    2017       2018
                                                                                   Source: NGV America and Coalition for Renewable Natural Gas, April 2019
                    Corn Ethanol                                    66.8
           Biodiesel (Corn/Soy)                                    55.5
                   RNG (Landfill)                                  48.2           RNG uses
                                                                                  the existing
                 Synthetic Diesel                              28.0
                                                                                  gas grid to
         Biodiesel (Cooking Oil)                              20.9                connect
 RNG (Wastewater Treatment)                                   19.3                producers to
             RNG (Food Waste)                     -22.9                           consumers
           RNG (Dairy Manure)                               -252.0                across
                                                                                  continents
                                           Traditional Fuels
                                           20% to 50% CO2 reduction
                                           50% to 100% CO2 reduction
Source: California Air Resources Board     >100% CO2 reduction

                                                                                                                                                               PAGE 19
CAN WE MAKE ROAD TRANSPORT CARBON NEUTRAL?

ZERO NET CARBON BIO METHANE + FOSSIL GAS BLEND
ENOUGH FOR 100% OF EU 28 TRUCK ENERGY DEMAND IN 2030
                          0%
                                                                                                                                                            Less than Zero Net CI

                                                                                                                                                                Zero Combined CI
                                                 7% Livestock Manure Anaerobic Digestion

                         20%
                                                                             25% Woody Residues Gasification→
     Blend Percentage

                         40%

                                                                     29% Crop Residues Anaerobic Digestion →
                         60%
                                                                                                                                                                                     4% Muni. Solid Waste

                         80%                                                                                                                                       35% Fossil Gas

                        100%
                            -400   -350   -300    -250                  -200                   -150                   -100                   -50            0                      50       100      150
                                                                                           Carbon Intensity [MJ/kg]
Ref: Westport estimate based on CARB LCFS averages and GTI data sources

SAE INTERNATIONAL                                               MARK DUNN - WESTPORT FUEL SYSTEMS                                                                                                          20
                                                  Copyright © SAE International. Further use or distribution is not permitted without permission from SAE
STEADY REVENUE, WITH HPDI POSITIONED FOR GROWTH
                              2017 Revenue                                 2018 Revenue                                 2019 Guidance
                                 $230M                                         $270M                                    $295-305M
                                                                                                                            82.4
                                                                           80.5
                                                                                                                                        75.4
                                                                                                               73.2

                                                            63.8                           65.5
 ($ in millions)

                                                                                                     60.5
                    57.3      58.6                57.5
                                        56.4

                   Q1 2017   Q2 2017   Q3 2017   Q4 2017   Q1 2018       Q2 2018        Q3 2018     Q4 2018   Q1 2019     Q2 2019   Q3 2019

       Balanced business with market-ready solutions and customers in 70 countries
                                                            Note: Results for 2019 are unaudited.                                              PAGE 21
2016 – 2019 ADJUSTED EBITDA TREND

                        30
                                                                                            +$24.8 m

                        20                                                                    Q3

                        10
                                                                                  +$9.6 m     Q2

                                                                                              Q1
                         0
                               2016        2017                                    2018      2019
     In millions of $

                        -10

                        -20
                                         -$19.9 m

                        -30

                        -40

                              -$46.0 m
                        -50

                                          Note: Results for 2019 are unaudited.                        PAGE 22
WFS BUSINESS UNITS
    Independent                                                                  Cummins Westport
                             Light Duty OEM            Heavy Duty OEM                                           Corporate
    After Market                                                                       JV
• Small vehicle market    • Small vehicle market     • Commercial launch of     • CNG SI engines          • Continue to
  where fuel savings is     where fuel savings is      HPDI 2.0 in Europe in    • UltraLow NOx              rationalize corporate
  the key driver            the key driver             2018                     • Solid revenues and        expenditures
• Distribution            • OEMs such as VW          • Weichai signed as 2nd      gross margins           • Increasing operating
• Moderate growth of 5%   • Growth of 10 - 15% per     customer in 2018         • Declining R&D and tax     leverage
  per annum                 annum                    • Regulation and total       expenses
• AEBITDA margins of      • AEBITDA margins of         cost of ownership will   • Net income growing
  ~15%                      ~10%                       drive business           • JV term ends 2021

 Increasing operating      Growth and cash flow        Increasing volumes       Strong cash dividends      Overhead to decrease
      cash flows                business                 improve margin                                      as % of revenue

                 Future growth plus aligning costs with revenues will drive profitability

                                                                                                                           PAGE 23
WFS GROWTH PATH
                                    HD OEM / HPDI business
                                    Game changing technology
                                    High growth potential

                                                               LD OEM business
                                                               10-15% growth rate
                                                               Stable, profitable

                                    Aftermarket business
                                    Single digit growth rate
                                    Stable, profitable

    2017          2018     2019
    Aftermarket   LD OEM   HD OEM

                                                                                    PAGE 24
THINKING AHEAD

> www.wfsinc.com
You can also read